
94% of researchers rate our articles as excellent or good
Learn more about the work of our research integrity team to safeguard the quality of each article we publish.
Find out more
ORIGINAL RESEARCH article
Front. Phys., 31 October 2022
Sec. Soft Matter Physics
Volume 10 - 2022 | https://doi.org/10.3389/fphy.2022.971112
This article is part of the Research TopicActive and Externally Driven Granular MatterView all 8 articles
Communication via mechanical stress feedback is believed to play an important role in the intercellular coordination of collective cellular movements. One such movement is ventral furrow formation (VFF) in the Drosophila melanogaster embryo. We previously introduced an active granular fluid (AGF) model, which demonstrated that cellular constriction chains observed during the initial phase of VFF are likely the result of intercellular coordination by tensile-stress feedback. Further observation of individual cellular dynamics motivated us to introduce progressive constrictions and Markov chain Monte Carlo based fluctuation of particle radii to our AGF model. We use a novel stress-based Voronoi tessellation method to translate the anisotropic network of highly polydisperse, axisymmetric force centers into a confluent cellular layer. This allows us to apply a similar means of analysis to both live and simulated embryos. We find that our enhanced AGF model, which combines tensile mechanical stress feedback and individual cellular fluctuations, successfully captures collective cell dynamics.
There is emerging evidence that mechanical stress feedback is a pervasive factor in synchronizing the activity of cells during morphogenesis and other developmental processes [1–15]. However, intercellular communication via mechanical stress feedback is not understood to the same degree as chemical and electrical signaling. This is in large part due to limited ability to measure mechanical forces between the individual cells of a biological tissue in real time. Direct measuring techniques such as magnetic fluid or particle localization [16–20] and indirect methods such as microscopy analysis techniques [21, 22], application of optogenetic techniques [23, 24], or application of laser ablation techniques [25, 26] have undoubtedly pushed our understanding forward. However, the creation of numerical models of biological development is also very important to the investigation of intercellular communication and coordination via mechanical stress feedback.
Numerical models provide a means of exploring collective phenomena associated with mechanical stress field distribution and related intercellular mechanical forces within developing biological tissues. Such numerical models have been used in various biological contexts and for a variety of organisms. These include numerical models of chick somitogenesis and forebrain [27, 28], cell flow in zebrafish tail bud elongation [7, 29, 30], mouse distal visceral endoderm formation and elongation [31], and elongation of the C. elegans embryo [32]. Here we present an enhanced active granular fluid (AGF) model with Markov chain Monte Carlo (MCMC) fluctuations and demonstrate its ability to capture dynamics of ventral furrow formation (VFF) in the Drosophila melanogaster embryo.
During embryonic development, the embryo establishes axes, patterns tissues, grows, specifies the identities of cells and tissue that differentiate into functional cells and tissues, and generates the shape and form of the embryo. Morphogenesis, the generation of form and structure in an organism, is directed and guided by cascades of gene expression, gene activation, and biochemical signaling. However, a growing field of literature has highlighted the importance of intercellular mechanics as a critical mechanism in the control of morphogenesis [1–6, 33–43]. Drosophila has emerged as one of the major model organisms for the study of mechanical signaling. VFF, one of the main morphogenetic movements of gastrulation in Drosophila, has been an especially rich avenue of investigation. VFF internalizes a rectangular field of approximately 950 cells along the underside of the embryo that becomes the mesoderm: the region that eventually forms muscle, heart, blood, etc. in Drosophila [44–47].
The region internalized by the VFF is defined by the partly overlapping expression of twist and snail. These genes not only define the region but also make the cells of the region mechanically active [43, 45, 46, 48, 49]. These cells remain in the same positions and do not translocate within the mesoderm field during VFF [47, 50]. The invagination of the field proceeds in a stereotypic pattern: apical flattening of the cells, an increasing number of cells undergoing apical constrictions (the slow phase), inward buckling driven by rapid apical constriction [47] and basal expansion [51] (the fast phase) controlled by the secretion of the Fog signal ligand, and formation of the ventral furrow proper [45, 47, 49, 50, 52–54]. Apical constriction pulses in individual cells can be categorized as either unratcheted or ratcheted. Ratcheted pulses are those for which the cells lock-in a reduced size. Repeated ratcheted pulses underpin apical constrictions. Detailed observation of cellular dynamics revealed random apical size fluctuations for cells undergoing unratcheted pulses [49, 55]. These random unratcheted pulses can transition to ratcheted constrictions during the slow phase and have been shown to be positively correlated with apical constriction in neighboring cells [56].
Our observations have shown that the correlation between apical constrictions is far more extensive than simple neighbor–neighbor interactions. Constrictions form chain-like patterns that percolate across the mesoderm field during the slow phase of apical constrictions. These patterns are known as cellular constriction chains (CCCs) and are indicative of tensile mechanical stress feedback [1]. Our most recent work demonstrates that CCCs form along underlying paths of tensile stress that can extend through or wrap around regions of reduced apical constriction [2]. This phenomenon lowers the impact of local contractility reduction, thus aiding the robustness of VFF.
Our original AGF model captured the formation of CCCs; however, it was unable to describe details of the constriction progression because constrictions were treated as instantaneous. To capture the dynamics of apical constrictions during VFF, we have enhanced our previous AGF model to incorporate fluctuations in apical constrictions during both ratcheted and unratcheted pulses. We have also introduced gradual ratcheted apical pulses to our tensile-stress-driven stochastic process rather than the single ratcheted constriction step that we previously used. These changes allow us to apply similar analyses to data from both live embryos and simulated embryos. Detailed analysis of cell apical area trajectories reveals that the transition from unratcheted to ratcheted pulses is markedly sharp. In addition, we find that the onset time of this transition and the rate of successive ratcheted pulses after the onset vary between cells. The agreement between the predicted and observed behavior further confirms the crucial role of mechanical stress feedback in the apical constriction process of VFF.
To characterize the collective dynamics of constricting cells during the onset of VFF, we have processed time-lapse confocal images of the apical surface of the ventral region of five embryos. The images were acquired previously [2] and are available from Dryad [57].
We have 1) segmented the images; 2) tracked the cells; 3) measured the cell areas, aspect ratios, and the positions of the cell centroids; and 4) evaluated the constriction histories of the tracked cells. The segmentation and tracking was done using Embryo Development Geometry Explorer (EDGE) software package [58], and further data processing was performed by employing a combination of in-house MATLAB and Fortran routines. The degree of constrictions was characterized using the area reduction factor
which describes how the area A of a given cell apex changes relative to the reference area Aref of the same individual cell before the ratcheted constriction process begins. The reference area is obtained by averaging the cell area over several sequential confocal images. The results are presented for two embryos with the best alignment, referred to as Embryo 1 and Embryo 2.
To visualize the constriction dynamics, the tracked cells in the segmented video frames were color-coded by the value of the area reduction factor Eq. 1. The factor is marked at finite intervals 0.95k, (k = 0, 1, 2, … ), with a cutoff at a minimal constriction degree. We show results for two cutoffs: k = 2 (rA = 0.90) in Figure 1 to depict the progression of the collective constriction process and at a strong-constriction level k = 8 (rA = 0.66) in Figure 2 to emphasize the formation of CCCs. We also show the time evolution of the number of constricted cells at different constriction levels (Figures 3A,B) for both embryos.
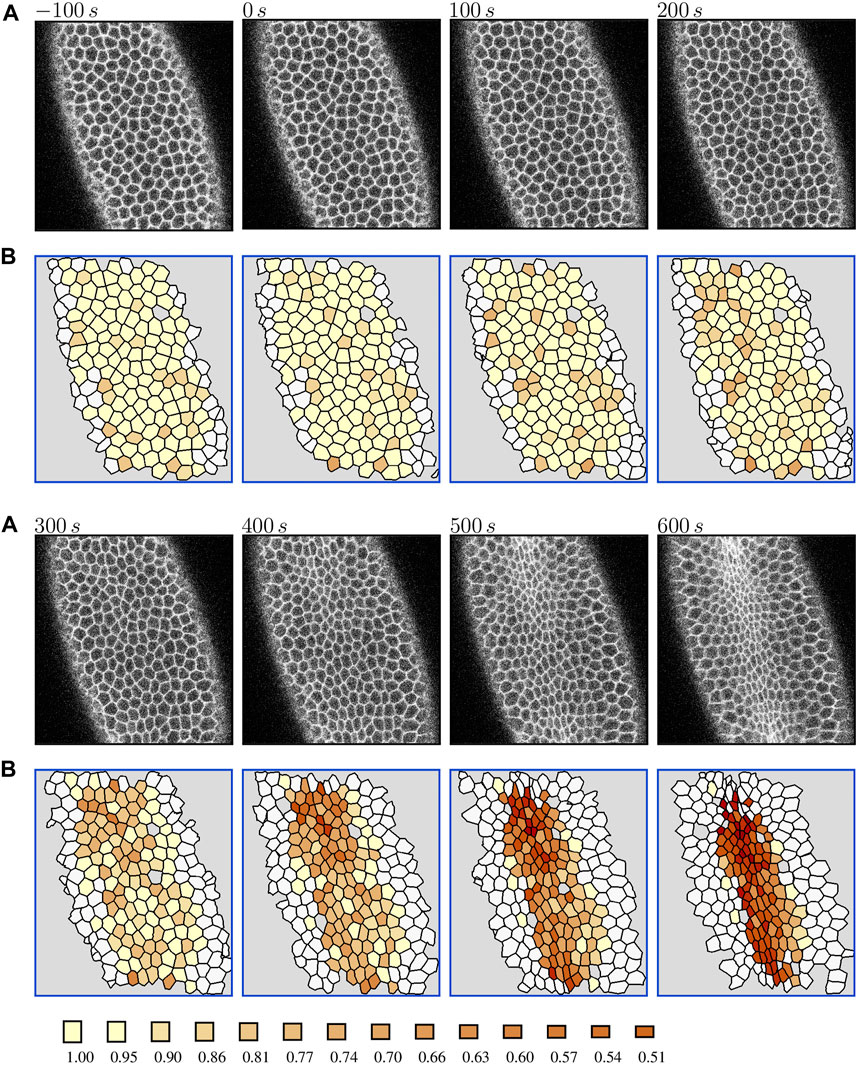
FIGURE 1. Evolution of overall cell apical constriction patterns in the Drosophila embryo during the slow phase of VFF. (A) The original contrast-enhanced time-lapse images of the ventral side of a live Spider-GFP Drosophila embryo at the time (as labeled) measured from the onset of the ratcheted constriction process. (B) The corresponding processed images with tracked cells colored by the value of area reduction factor rA = 0.95k, where k = 0, 2, 3, … (color bar); untracked cells are indicated in white, and areas not identified as cells by the image processing software are marked in gray. Time zero is set at the onset of the ratcheted constriction phase. The color scale is truncated at k = 2 because of the data resolution. The results for Embryo 1. Live embryo images were acquired previously [2] and are used here under the article’s CC BY license.
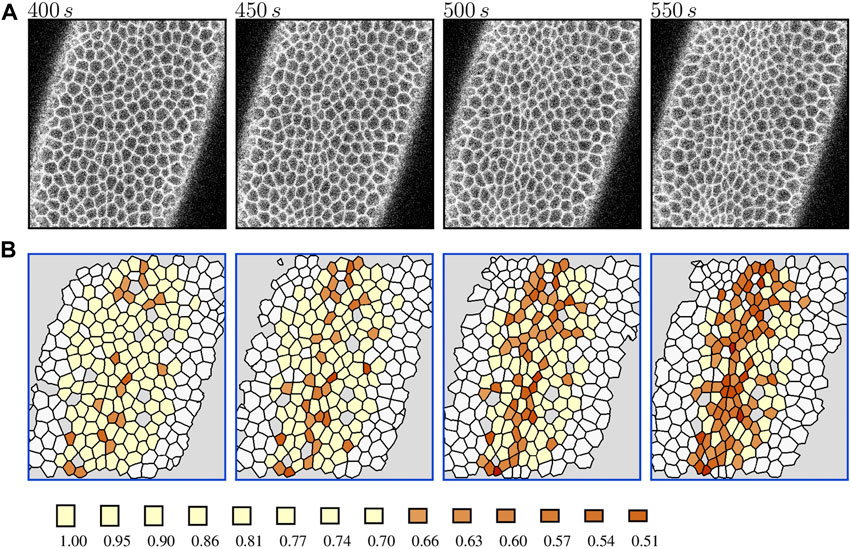
FIGURE 2. Formation of cellular constriction chains (CCCs) in the Drosophila embryo during the late slow phase of VFF. (A) The original contrast-enhanced time-lapse images of the ventral side of a live Spider-GFP Drosophila embryo. (B) The corresponding processed images with tracked cells colored by the value of area reduction factor rA. The labeling is the same as in Figure 1, except that the color scale is truncated to visualize the formation of chains of strongly constricted apices (rA ≤ 0.66). The results for Embryo 2. Live embryo images were acquired previously [2] and are used here under the article’s CC BY license.
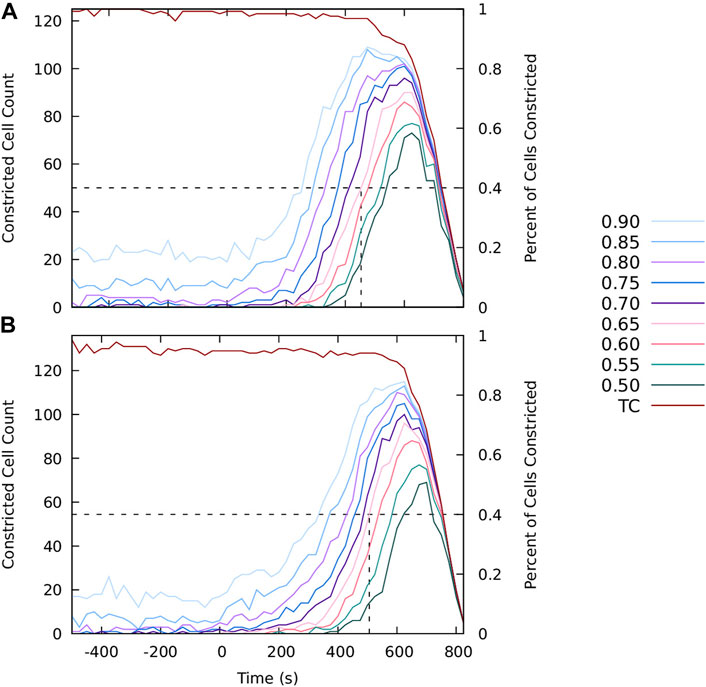
FIGURE 3. The progression of the apical constriction process. The graphs show the number (left scale) and the fraction (right scale) of tracked cells with the area reduction factor rA smaller than the specified value (as labeled). The current number of tracked cells (TC) is also shown. At the onset of invagination the number of tracked cells decreases because the cells move out of the focal plane. The results for (A) Embryo 1 and (B) Embryo 2.
Both the processed images (Figure 1) and area histories (Figure 3) indicate that at the initial stage cell apices fluctuate in size in an approximately stationary random process. The intensity of these fluctuations (roughly 10%–20% of the apical cell area) remains approximately constant at this stage. The observed cell dynamics results from the existence of unratcheted constriction pulses of actomyosin network [49], the machinery that drives the constriction process.
Consistent with earlier observations [49, 56], the initial unratcheted-constriction phase is followed by the ratcheted-constriction phase, during which the size of cell apices gradually decreases. The transition between the unratcheted and ratcheted phases is manifested by the increase in the number of constricted cells, initially at lower constriction degree (rA > 0.9), and later at increasingly higher constriction degrees. The transition is quite sharp, and the ratcheted phase is clearly distinguishable from the earlier unratcheted phase [56] (Figure 3).
After more than 50% of cells constrict to rA = 0.65, the ventral surface bulges inwards and starts to invaginate. As a result, the cell apices move out of the focal plane of the confocal imaging system, and the images lose their resolution, as seen in the last frame in Figure 1. Thus, the number of tracked cells decreases, which is reflected in the decreased counts of the number of constricted cells. The data depicted in Figures 1–3 do not show any subsequent transition from a slower progressive ratcheted constriction phase to the fast constriction phase postulated in [47], but rather reveal a gradual acceleration of the constriction process reflected in the increasing number of strongly constricted cells. These findings are consistent with the analysis by Xie and Martin [56] of their experimental data.
Figure 2 demonstrates that apical constrictions are spatially correlated: they tend to form chain-like structures termed CCCs [1, 2]. Based on the analogy between force chains in granular media [59, 60] and CCCs, we argued that CCCs emerge as a result of cell communication via mechanical forces. To elucidate the role of such communication, we have developed a numerical AGF model with mechanical feedback. We demonstrated that there is a good agreement of our simulation results with in vivo observations of the constriction morphologies and constricted-cell cluster statistics [1, 2].
Our previous work [1, 2] focused on strongly constricted cells, and strong constrictions are typically ratcheted (irreversible) [49, 56]. In our modeling approach we thus treated constrictions as irreversible instantaneous events. In the present paper we concentrate on both unratcheted constriction fluctuations and the gradual character of the collective ratcheted apical constriction dynamics (Figure 1 and Figure 3). Thus, we have enhanced our AGF model accordingly.
Similar to our previous approach [1, 2], the enhanced AGF model describes the mechanics of the confluent 2D system of constricting cell apices on the ventral surface of the Drosophila embryo using a set of force centers representing individual cells. (See [61] for a review of force-center techniques.). As depicted in Figure 4, the active region and the explicitly simulated part of adjacent ventrolateral tissue are mapped onto a rectangular domain of force centers. To reduce the numerical cost, for the remaining dorsolateral tissue we use an implicit representation in terms of a set of springs with properties matching elastic properties of the modeled epithelial layer.
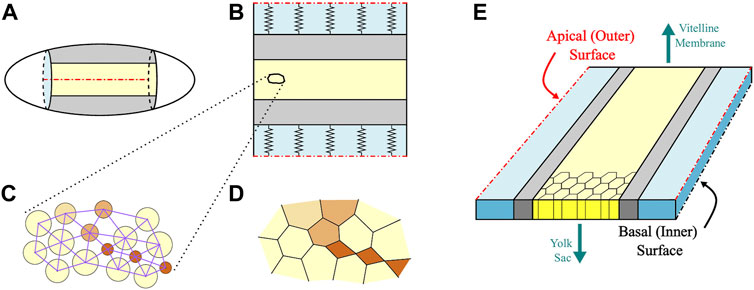
FIGURE 4. Schematic of the AGF model. (A) The simulated domain of the Drosophila embryo. The active ventral and the passive lateral regions are marked in yellow and gray, respectively. (B) The simulated region is mapped onto a rectangular domain with periodic boundary conditions in the anteroposterior direction. The outer part of the passive region (light blue in the figure) is modeled implicitly as an elastic medium represented by springs. (C) The cells are described using force centers interacting via repulsive and attractive forces. The repulsive forces (represented by circles) act between all contact cells. The attractive forces (represented by lines) act only between neighbors and do not switch during the progression of the constriction process. (D) The confluent cell layer is obtained from the force center system using the augmented stress-based Voronoi construction. In both (C,D), the constricted particles are marked in brown; the color intensity represents the degree of constriction. (E) At this stage of development, the Drosophila embryo consists of a single layer of cells. The basal surface faces the inner yolk sac while the apical surface faces the vitelline membrane that encapsulates the embryo. Our AGF model focuses on the apical surface.
In the anteroposterior direction we apply periodic boundary conditions to mimic anchoring of the boundaries of the active domain by immobile end caps of the embryo. Immobile anterior and posterior boundaries of the active domain ensure that apical constrictions generate anisotropic stress distribution in the tissue [1, 2, 62]. One could use fixed boundary conditions instead, but this would not yield a more realistic description of the end caps because of a high Gaussian curvature of the epithelial layer in the end-cap regions.
The cell boundaries for a given force-center configuration are determined using our augmented stress-based Voronoi construction [2] (Figure 4). The new model involves two major enhancements: 1) we introduce unratcheted cell size fluctuations around a current anchor size associated with the degree of ratcheted constrictions; and 2) we describe ratcheted constrictions as a multistep gradual constriction process (Figure 5).
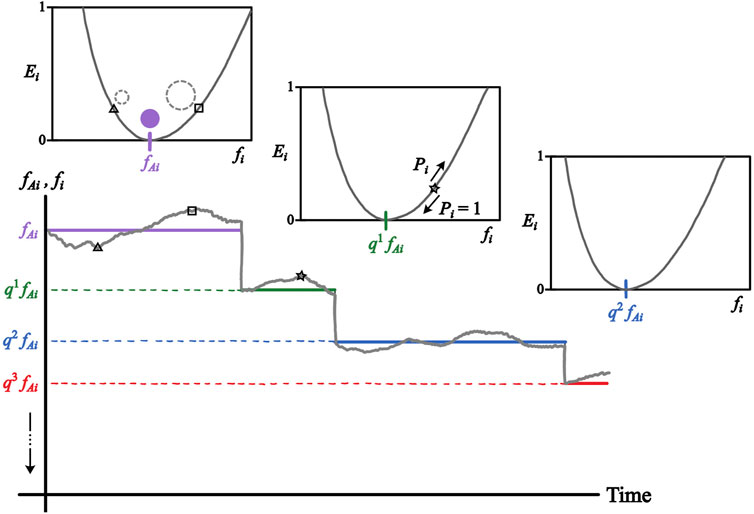
FIGURE 5. Representation of unratcheted and ratcheted constriction processes in the enhanced AGF model. The unratcheted constrictions are modeled as uncorrelated random fluctuations of the actual constriction factor fi, Eq. 6, (gray line) around the current anchor value fAi, Eq. 7, (purple, green, and blue lines). The unratcheted constrictions are modeled as MCMC generated from the Metropolis potential Ei with the minimum at fAi (insets); the ratcheted constrictions are represented by a unidirectional, stress-correlated stepwise process resulting in a decrease of fAi by a ratio q = 0.9 in each step. Left inset shows that the actual interaction range of a force center can be larger or smaller than the anchor size. Middle inset indicates that the decrease or increase of fi in a given simulation step is accepted with the probability Pi that depends on Ei, as defined by Eq. 9. All three insets show that ratcheted constrictions result in a shift of the Metropolis potential towards the smaller values of fi.
The force centers i and j interact via a combination of pairwise-additive repulsive and attractive spring potentials, V = Vr + Va, where
is the repulsive part, and
is the attractive part. Here ϵ is the characteristic energy scale, rij is the separation between force centers i and j, and
In the initial state the force-center system is a 50%–50% bidisperse mixture with the interaction-range ratio r = 1.1. The cells in the central band (approximately 12 cells wide) are active, and the remaining cells are passive. This geometry is the same as in our previous study [2].
During the constriction process the interaction ranges di of force centers representing the active cells change, and the system undergoes a quasistatic evolution, passing through a sequence of states in mechanical equilibrium for each set of di values. The cell geometry is obtained from the equilibrium configuration of the force centers using the stress-based augmented Voronoi construction.
After the onset of the ratcheted constriction process, the system of cell apices becomes highly polydisperse and anisotropic. The standard Voronoi tessellation [63], which is based on the positions of particle centers alone, cannot accurately represent this geometry. We have solved this problem [2] by defining the Voronoi tessellation in terms of the stress-based cellular shape tensor
where
is the normalized virial stress tensor, rij = ri − rj is the relative position of the force centers ri and rj, fij = −∇ijV (where ∇ij denotes gradient with respect to the relative position rij) is the intercellular force, and s0 is an O (1) scale factor representing a typical number of springs contributing to cellular deformation in a given direction. We use s0 ≈ 2 in our analysis. The force fij includes both the attractive and repulsive contributions.
The shape tensor
between a trial point ρ and the force center i, where ρi = ρ − ri is the relative trial point–force center position, ρi = |ρi|, and
According to the analyses [49, 56] of actomyosin pulses and the associated cell area changes, apical constrictions can be classified as unratcheted or ratcheted. Unratcheted constrictions can be interpreted as random fluctuations of cell areas, whereas ratcheted constrictions lead to a permanent cell area decrease. Thus, to describe the constriction process, we introduce two sets of random variables di and dAi undergoing two coupled stochastic processes, corresponding to unratcheted and ratcheted constrictions, respectively. The random variable di represents the actual range of the interaction potential Eq. 2 of the force center i. The anchor range dAi, around which unratcheted constrictions of cell i occur, characterizes the current state of the ratcheted actin-myosin meshwork. We also define the corresponding two dimensionless actual and anchor constriction factors
and
where d0i is the initial value of the interaction range of the force center i.
Since our previous investigation did not reveal significant correlations between weak constrictions observed in vivo [2], the unratcheted constrictions are modeled here as an uncorrelated Markov process generated using the Markov chain Monte Carlo method [64]. This Markov process describes random fluctuations of the actual range di around the corresponding anchor range dAi. Here, size fluctuations of different cells are statistically independent and do not involve mechanical feedback.
The stepwise ratcheted apical constrictions, on the other hand, strongly depend on mechanical feedback from apical constrictions of other active cells likewise undergoing pulsatile apical constrictions. In the enhanced AGF model, the anchor range dAi undergoes a unidirectional stepwise reduction process that models the cell area reduction due to ratcheted pulses of planar multidirectional actomyosin constriction [49, 56]. The stress-coupled ratcheted constrictions are simulated using a method similar to that of our previous model [2], except that a multistep process is employed instead of a single-step one. The unratcheted and ratcheted stochastic processes are schematically depicted in Figure 5 and described in detail in Section 3.3.1 and Section 3.3.2, respectively.
The unratcheted fluctuations of the interaction range di of cell i are generated from the Metropolis probability potential
using the standard MCMC approach. The potential defined by Eq. 8 has a minimum at fi = fAi and diverges at fi → 0, which prevents introduction of negative values of fi. The unratcheted fluctuations of different cells are not coupled, except for the coupling through the stress-correlated anchor ranges dAi, as described in Section 3.3.2.
The MCMC for each particle is constructed as a sequence of Monte Carlo steps. To perform a given step, we generate a trial value of the constriction factor,
where
is the change of the Metropolis potential (Figure 5); otherwise, the trial step is rejected, and the constriction factor fi remains unchanged. Smaller values of the parameter b in Eq. 9 allow larger fluctuations. We use Δ = 10–2 in this study.
As in our previous work [2], ratcheted constrictions are described by a stress-driven stochastic process. In our present algorithm we follow a similar procedure, except that the constrictions occur in a multistep process. In a given constriction step, the anchor potential range of a constricting cell is reduced by a fixed ratio q,
(where q = 0.9 in our simulations). In subsequent simulation steps, the elementary constriction Eq. 11 can be repeated multiple times (Figure 5), until fAi < fc, where fc = 0.2 is the terminal constriction factor. Each stepwise reduction of fAi represents the effect of a ratcheted actomyosin pulse.
In a given simulation step, particle constrictions occur with a finite probability Pi(si), where si is the feedback parameter associated with constriction-triggering tensile stress σi experienced by particle i. Since constriction chains develop due to propagation of tensile stress along force chains [1, 2] and not because of the anisotropy of particle stress itself, we define the triggering stress in terms of the isotropic part of the virial stress tensor,
(where
To account for the observed dynamics of ratcheted constrictions, we use the stress-feedback parameter with a cutoff
The cutoff reduces the rate of ratcheted constrictions at large tensile stresses and thus allows us to avoid an acceleration of strong constrictions (which is not observed in vivo, according to Figure 1). Ratcheted apical constrictions in ventral furrow cells, on average, undergo 3.2 apical constriction pulses within 6 min. Each pulse lasts approximately 30 s and the time between pulses is approximately 80 s [49, 65].
The stress σi in Eq. 13 is normalized by the average tensile stress σref experienced by a single cell constricted in the initial configuration to f = 0.6. We use σc/σref = 0.4 for the cutoff value. The Heaviside step function Θ in the feedback parameter Eq. 13 selects the tensile-stress domain σi > 0, and p = 3 is the stress-sensitivity profile parameter. The constriction probabilities Pi(si) are calculated from the relation
where the parameter β measures the magnitude of the stress feedback contribution relative to the stress-insensitive background value. The normalization factor α/Na (where Na is the total number of active particles including the unconstricted and constricted ones) controls the number of constrictions per simulation step. We use α = 6 and β = 250 in our simulations. To reflect the experimentally observed sharp onset of ratcheted constrictions (Figures 1, 3), the probability Pi of ratcheted constrictions is set to zero for times smaller than a specified onset time.
The simulation starts from an initial equilibrated configuration. At each simulation step we perform the following calculations: 1) the anchor interaction force ranges dAi = fAid0i are updated according to the procedure described in Section 3.3.2; 2) the actual interaction force ranges di = fid0i are updated for all force centers according to the MCMC procedure described in Section 3.3.1; 3) the system is equilibrated again using the procedure described in [66] and the triggering stresses Eq. 12 are calculated from the equilibrated intercellular forces.
To generate the Voronoi cell-constriction patterns and constricted-cell statistics, the force-center configurations are postprocessed. The virial stresses are evaluated according to Eq. 4, and the Voronoi cells are determined according to the recipe described in Section 3.2. The area reduction factors, Eq. 1, are then evaluated from the size of the Voronoi cells.
Representative results of our numerical simulations performed using the enhanced AGF model are shown in Figures 6–8. The simulation frames and the constriction data are depicted in the form similar to the one employed to present the in vivo results in Section 2. To determine the constriction levels of simulated cells, we use the area reduction factor defined in Eq. 1, with A denoting the current area of a Voronoi cell and Aref representing the corresponding area in the initial state. The time, measured by the number of simulation steps, is set to zero at the beginning of the ratcheted constriction process and is normalized by the time at which 40% of cells have reached the rA = 0.65 constriction level.
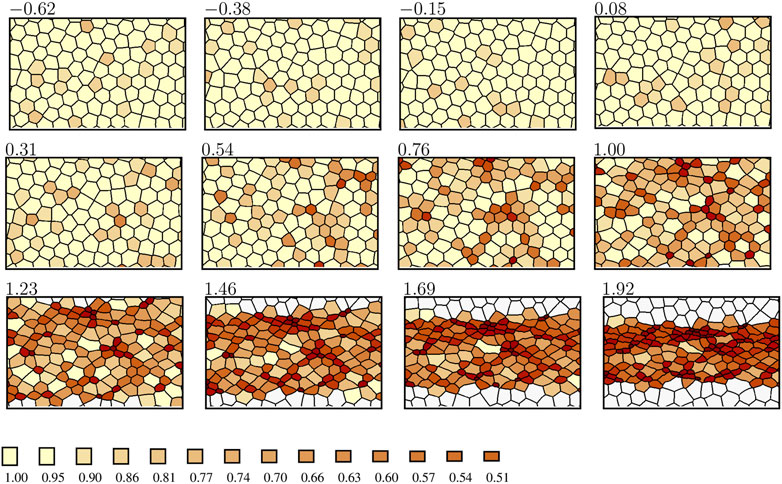
FIGURE 6. Evolution of constriction patterns, as predicted by the enhanced AGF model. The active cells are color-coded by the value of the area reduction factor rA (color bar); the passive cells are indicated in white. The time zero corresponds to the onset of ratcheted constrictions, and the time is normalized by the time at which 40% of cells are constricted at the level rA = 0.65. The anteroposterior axis is horizontal. Only a portion of the simulation domain is depicted.
The in vivo (Figure 1) and simulated (Figure 6) constriction patterns show striking similarities. During the initial unratcheted constriction phase a small fraction of cells undergo low-amplitude fluctuations in size. During this phase, a few constricted-cell clusters occur randomly due to the finite concentration of constricted cells, but there is no coupling between cell constrictions. Both in vivo and in simulations, the constricted-cell clusters are transient.
After the onset of ratcheted constrictions, the number of constricted cells and their degree of constriction gradually increase. During this phase, strong spatial correlations between constricted cells develop, both in vivo and in simulations. Namely, the cells form elongated clusters, i.e., CCCs, which gradually create a network percolating the system in the anteroposterior direction (Figures 2, 7).
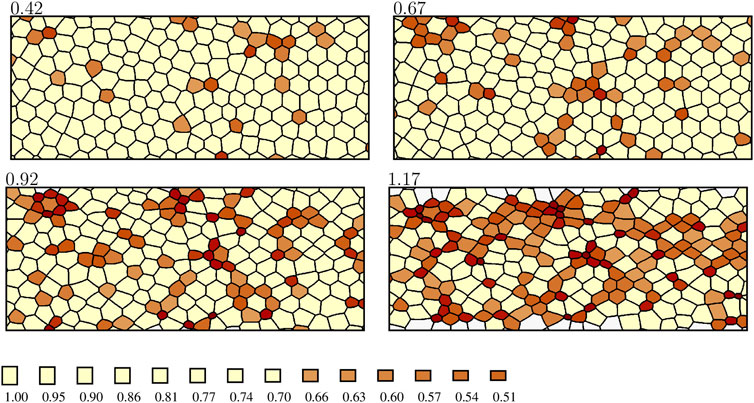
FIGURE 7. Formation of cellular constriction chains during the simulated constriction process. The labeling is the same as in Figure 6, except that the color scale is truncated to visualize the formation of chains of strongly constricted cells (rA ≤ 0.66). The anteroposterior axis is horizontal. A larger portion of the simulation domain is depicted than the one represented in Figure 6 to show the development of an elongated percolating cluster oriented in the anteroposterior direction.
In [2] we demonstrated that the statistics of experimentally observed, strongly constricted cell clusters agree with the corresponding results of numerical simulations based on the original single-step ratcheted AGF model with mechanical feedback. In the absence of mechanical feedback, agreement was not obtained. These observations provided strong evidence that mechanical feedback controls the collective constriction dynamics in vivo. Similar chains are predicted by the current enhanced AGF model with gradual constrictions (Figure 7). Thus, formation of stress-induced CCCs does not depend on whether constrictions are instantaneous or gradual. However, the enhanced AGF model allows us to study the time progression of the constriction process, which was not possible with the original AGF model.
The counts of constricted cells presented in Figure 8A show that after the stress-correlated process of ratcheted constrictions begins at time zero, the number of constricted cells undergoes a steady increase at a rate that initially grows, and then remains approximately constant until the fraction of constricted active cells approaches the saturation level at 100%. The number of constrictions increases at a similar rate for different cutoffs of rA, but the onset of stronger constrictions is delayed, similar to the in vivo results in Figure 3 (although the delay in simulations is somewhat smaller).
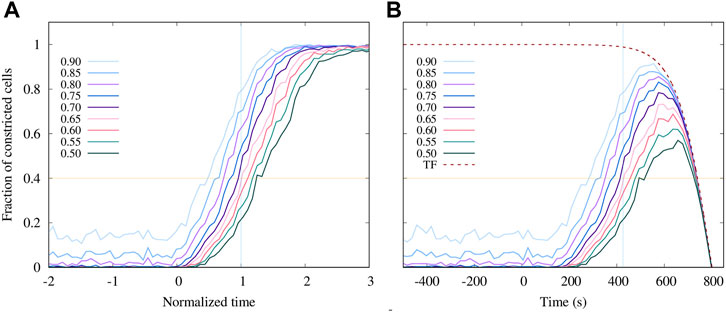
FIGURE 8. Predictions of the enhanced AGF model for the progression of the apical constriction process. (A) The fraction of active cells with the area reduction factor rA smaller than the specified value (as labeled) vs. normalized time (as defined in Figure 6). (B) The results shown in (A) multiplied by the truncation function (TF) Eq. 15 that was fitted to the fraction of tracked cells shown in Figure 3A (Embryo 1). The simulation time is shifted and rescaled to match the experimental timescale. The onset of the constrictions in the simulations is set to t = 150 s.
To directly compare our numerical simulations with the experimental data presented in Figure 3A for Embryo 1, we replot the simulation results in Figure 8B using rescaled and shifted time to match the experimental observation time. Since the number of tracked cells decreases at long times due to the limitations of the confocal imaging system (as discussed in Section 2), the simulation results are multiplied by the truncation function
fitted to the current number of tracked cells in the experiment depicted in Figure 3A. Here t is the observation time, tc and αc are fitting parameters, and the fitted curve is normalized by the maximal number of tracked cells. This procedure enables a direct comparison of the simulation and experimental results.
With this correction for the experimental resolution, there is a very good agreement between the simulations and in vivo data (Figure 3A) up to time t ≈ 700 s, above which a comparison is not possible because the experimental data lose resolution due to an insufficient number of tracked cells. Considering that time dependence of cell contractility in our model is not imposed but arises entirely from tensile-stress feedback between constricting cells, the agreement between the simulations and experimental data provides further evidence that mechanical feedback is key to governing the dynamics of the constriction process.
The agreement between simulations and in vivo results occurs not only for overall constricted cell counts but also for constriction histories of individual cells. As shown in Figure 9, there is usually a sharp transition between the initial interval of unratcheted constrictions and the following period of ratcheted constrictions, during which the cell area gradually decreases. The onset time and the rate of area decrease vary significantly from cell to cell. For a given cell, the ratcheted constriction rate is often approximately constant (Figures 9A,B), but the cell area can saturate at the late stage of the process (Figure 9C).
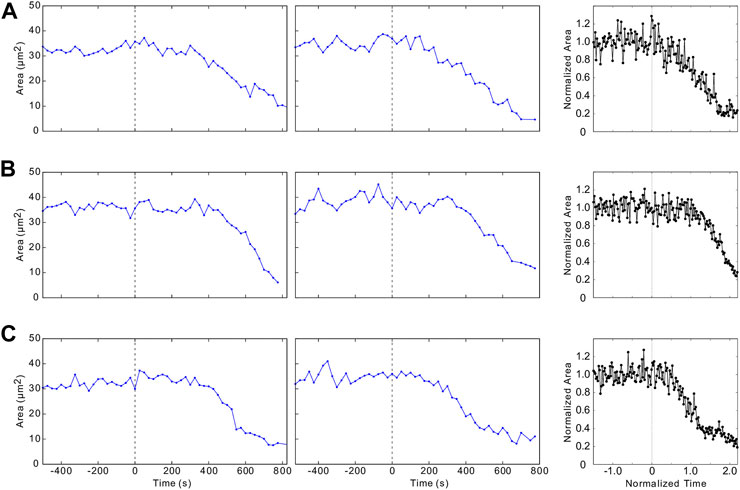
FIGURE 9. Constriction histories of individual cells. (A–C) depict examples of time evolution of individual cells for the same embryos as the ones analyzed in Figures 1–3. Embryo 2 (first column), Embryo 1 (second column), and simulated trajectories (third column).
The distribution of the onset time of ratcheted constrictions of individual cells can be inferred from the data presented in Figures 3, 8. Taking the value rA = 0.85 of the constriction factor as the ratcheted-constriction threshold, the line rA = 0.85 can be interpreted as the cumulative distribution of the ratcheted-constriction onset times. For both in vivo and simulation data depicted in Figure 3A and Figure 8, respectively, the distribution shows that at time t = 400 s about 40% of cells have not started ratcheted constrictions whereas 35% of cells have already constricted to rA = 0.7. The variation of the constriction onset time is associated with the spatial variation of tensile stress in a cohesive cellular matter, according to our model. Thus, concurrent presence of unconstricted and strongly constricted cells (both in vivo and in silico) further confirms that tensile stress plays a key role in coordinating apical constrictions.
Additional insights into physical mechanisms involved in the observed dynamics can be obtained from a comparison of the area reduction factor rA and the square of the constriction factor fA for the anchor interaction range with the stresses acting on the cell. We provide this comparison for six representative cells in Figure 10, where we plot these factors along with the trace
of the virial stress tensor Eq. 4, where S1 and S2 are its eigenvalues. The positive values of
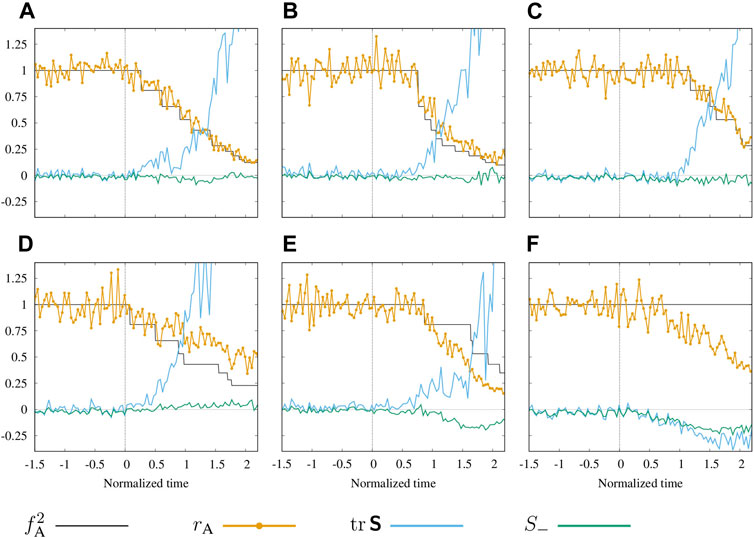
FIGURE 10. Mechanics of the cellular constriction process. (A–F) Time histories of the area reduction factor rA and the square of the anchor constriction factor
The results depicted in Figures 10A–E show that the initiation of the ratcheted constriction process for a given cell (black line) coincides with the initiation of the tensile stress increase (blue line). This behavior is associated with the two-way coupling between the constrictions and stress. The first ratcheted constriction occurs randomly with low probability because of a low value of the triggering stress Eq. 12 (in Figure 10 approximated by
The area reduction factor rA often follows the anchored constriction factor
Combined with our previous findings regarding formation of CCCs [1, 2], the results presented here provide compelling evidence that tensile mechanical stress feedback plays a pivotal role during the apical constriction phase of VFF. Our enhanced AGF model with MCMC fluctuations captures not only the experimentally observed chain-like constriction patterns (Figure 7), but also the overall dynamics of the constriction process (Figure 8) and key features of constriction histories of individual living cells in the active ventral region (Figures 9, 10).
We find that the transition from unratcheted to ratcheted apical constriction phase is remarkably sharp (Figure 3), consistent with data from other groups [56]. The underlying in vivo mechanism of this transition has yet to be elucidated. Our analysis of the apical constriction histories in vivo and in silico shows that the onset of ratcheted apical constrictions in individual cells is also sharp, but the time of onset and rate of subsequent ratcheted constrictions significantly vary from cell to cell (Figure 9). We also observe that often there is an increase in the apical area of individual cells just before the onset of ratcheted constrictions. This preceding increase in area is likely caused by cells’ passive response to tensile mechanical stress generated by the constrictions of nearby cells. Since this constriction-initiating stress propagates along precursor stress lines, it causes formation of CCCs [2]. The varying times of the constriction onset and the differences in constriction rates between cells are due to tensile stress nonuniformities, which are characteristic of cohesive particulate matter and are amplified by the formation of CCCs.
We emphasize that our model reproduces many details of the time progression of the constriction process without introducing a prescribed time evolution of cell contractility. Unlike the results of an earlier study by Spahn and Reuter [62] where fluctuating constriction dynamics were modeled assuming Wiener fluctuations about an imposed time evolution of cell contractility, in our approach the constriction dynamics are driven by mechanical stress feedback. The constriction patterns and collective cell dynamics result from the development of the underlying strongly inhomogeneous tensile stress field controlling cell constrictions and not from a prescribed contractility evolution.
We also note that other models of VFF [24, 51, 67–70] focus on the actual invagination of the furrow, but do not examine the preceding propagation of apical constrictions, as our study does. Moreover, while these investigations provide invaluable insights into the mechanics of VFF, none of them analyzes the effects of mechanical stress feedback. Below, we discuss some implications of our investigations in the context of coordination of morphogenetic movements by mechanical forces and the associated stress feedback.
Since the anterior and posterior end caps of the embryo remain relatively stationary throughout the VFF process [55], as more cells constrict and a network of CCCs percolates across the entire ventral field, the intensity of anteroposterior mechanical tension dramatically increases. The tension in the percolating CCC network causes both local-level and ventral field-wide effects. On the cellular level, we have previously shown that an increase in tensile mechanical stress coupled with mechanical stress feedback driving the formation of CCCs encourages ratcheted constrictions in cells with decreased contractility [2]. The stress-induced constrictions of such cells can restore the formation of a percolating network of CCCs and ensure generation of strong anteroposterior tensile stress in the entire ventral region.
Our current results extend our previous work to cells that did not undergo ratcheted constrictions because of a delayed constriction onset. We find that the buildup of tension along the CCCs can generate local regions of compression in the areas enclosed by interconnected chains of the stress-carrying network of CCCs. As tension increases in the chains, the enclosed unconstricted cells will experience compressive forces oriented normal to the anteroposterior direction. This compression can reduce the widths of the cell apices without the need for ratcheted actomyosin pulses (see Figure 10F, Figure 11B). Since the tension that generates the transverse compression is approximately uniform along the entire ventral field, compression-induced constrictions are synchronized between different local regions, allowing all unconstricted cells in the active region to quickly reduce their width when the tissue starts to buckle inwards at the onset of actual invagination.
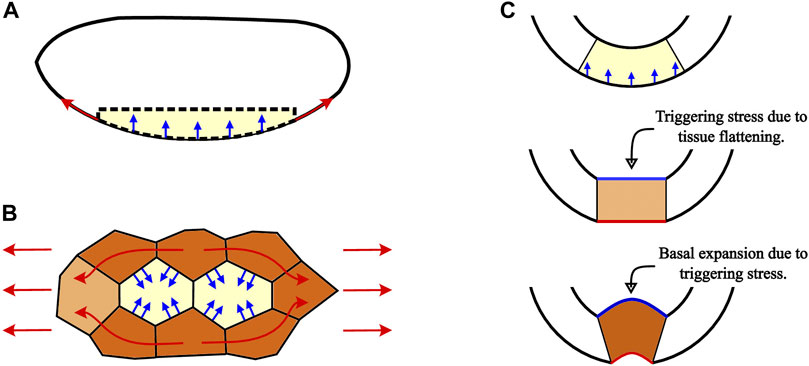
FIGURE 11. Schematic of how the percolation of tension along CCCs generates region-wide changes to help produce coherent invagination throughout the entire ventral field. (A) Anteroposterior tension (red arrows) that builds up along the active region between the relatively immobile anterior and posterior end caps of the Drosophila embryo causes a region-wide dorsoventral compression (blue arrows) that pushes the entire region inwards. (B) Regions of unconstricted cells (yellow) that are surrounded by cells already in the constriction chains (brown) experience compressive forces (blue arrows) arising from the anteroposterior tension in the CCCs (red arrows). These transverse compressive forces, acting perpendicular to the tensile stress direction, cause cells between constriction chains to reduce their apical areas as the tension increases, despite these cells having completed few or no ratcheted pulses. Thus, CCCs carrying tension along the anteroposterior axis and the cells compressed by the chains synchronously reduce apical areas throughout the whole ventral furrow field. (C) Cross-sectional embryo schematic showing how stresses associated with formation of CCCs can trigger the invagination phase of VFF. When the active region moves inward and flattens as a result of a combination of local apical constrictions and the inward pressure generated by the high-tension network of CCCs, compressive stress develops along the basal surface (straight blue line). Mechanical stress feedback then promotes the basal expansion that is necessary for successful invagination of the furrow.
Anteroposterior tension along the curved ventral region produces dorsoventral compression that pushes the field dorsally (inwards), as depicted in Figure 11A and investigated in [70, 71]. This effect, analogous to the inward deformation of a soft tissue caused by a tight elastic band, is proportional to both the curvature and tension. A recent thin-shell model [70] shows that the inward stress generated by apical constrictions can alone produce an invagination similar to ventral furrow. However, we expect that for a finite-thickness viscoelastic cell layer of an embryo, such an invagination would be hindered by elastic bending stresses arising in the cell layer that changes its curvature and buckles inward.
In the light of the above reasoning, we hypothesize that cells do not merely passively deform in response to the applied inward pressure. Instead, to prevent generation of bending stresses counteracting the invagination, the applied pressure triggers coordinated apicobasal shortening and basal expansion of ventral field cells (Figure 11C) that have been shown to drive ventral furrow invagination [51]. This triggering behavior is similar to the local-deformation mechanism considered in the model of mechanical feedback effects developed in [72]. Thus, we propose that ventral furrow is formed by a stress-synchronized combination of the 3D cell shape changes and the inward pressure produced by the ventral field-wide tension of the network of CCCs.
The above mechanical-feedback scenarios are consistent with the results of experiments by Guglielmi et al. [23], who observed that a sufficiently strong local optogenetic inhibition of cell contractility leads to ventral field-wide arrest of VFF. Such inhibition disrupts formation of the percolating tension-bearing network of CCCs so there is no inward compression to trigger the transition to the invagination phase of VFF. In contrast, at a lower level of optogenetic inhibition, constrictions were observed to penetrate through the disrupted region [2, 23]. This penetration enabled propagation of a percolating network of CCCs, thereby restoring the mechanical synchronicity of the entire ventral field and the formation of the ventral furrow in both the unaffected regions and the optogenetically affected domain.
If the initiation of basal expansion and apicobasal shortening by inward stress exerted by CCCs is confirmed by future studies, this would suggest that VFF is controlled by a cascade of the following mechanical-feedback effects. At the early stage of VFF the tensile-stress feedback produces a network of CCCs over the curved ventral field. The resulting inward stress triggers the invagination process, and intercellular tension decreases because the invaginating elastic cell strip with CCCs shortens as its curvature diminishes. This change in tension induces Snail-dependent disassembly of adherens junctions and brings about the observed epithelial-mesenchymal transition in the invaginated tissue [4].
Others have also found evidence for the involvement of tensile stress in VFF. By means of an algorithm used to find astronomical filamentous structures, Yevick et al. identified a supracellular actomyosin cytoskeletal network that provides robustness to the invagination of the ventral furrow [71]. These authors traced a myosin II network in the ventral field demonstrating redundant paths and a stiffer network oriented along the tensile stress direction. They discovered that the network grows along tensile stress [5, 71]. These authors seem to have been unaware of our findings on the propagation of apical constrictions by mechanical feedback along lines of tension [1]. Despite somewhat divergent views, both groups observed similar phenomena and formed similar conclusions.
It was recently shown that mechanotransductive cascade of endoderm invaginations can be triggered by mechanical cues [3], and similar stress-feedback mechanisms may be at play during cephalic furrow formation [73, 74]. Work done using magnetic nanoparticles has demonstrated the ability of experimentally controlled forces in gastrulating Drosophila embryos to produce morphogenetic movements [3, 75]. Thus, the picture that emerges is one where mechanical feedback might produce stresses and triggers that encompass the entirety of morphogenesis in gastrulation. Rather than only being involved in isolated morphogenetic movements, mechanical feedback may orchestrate the entire gastrulation process, coordinating all of the Drosophila morphogenetic movements: ventral furrow formation, cephalic furrow formation, dorsal transverse fold formation, posterior midgut invagination, anterior midgut invagination, and germband extension.
Despite the above findings, there are many open questions regarding molecular mechanisms involved in transduction of mechanical feedback and generation of the required mechanical activity of cells involved in morphogenetic movements. A recent study has demonstrated that optogenetic activation of Rho1 induces actomyosin contraction and ectopic furrow formation in both ventral and dorsal tissues at the onset of gastrulation. In the ventral epithelium, cell shape changes and tissue changes are similar to those in VFF; however, in the dorsal epithelium, cells and tissues behave differently. This implies that the dorsal epithelium is less mechanically active than the ventral epithelium. It is likely that dorsal, twist and possibly snail are necessary for the mechanical behavior of the ventral epithelium [76]. These results suggest that there are cellular components and certain arrangements of cellular components in the presumptive mesoderm that are necessary for efficient mechanical feedback.
Here, we presented our enhanced mechanical-feedback-based AGF model that incorporates unratcheted apical cell size fluctuations and multistep ratcheted apical constrictions. We showed that our model faithfully captures both region-wide dynamics and individual cell area trajectories. These results contribute to the mounting evidence that mechanical-feedback control plays a critical role in embryonic development. Further investigation of the ventral field-wide synchronization mechanism and correlation between molecular motor activity and degree of constriction will advance our understanding of the phenomena identified in this study. We are currently working on modeling mechanical feedback effects for the entirety of VFF.
Publicly available datasets were analyzed in this study. The embryo images can be obtained from https://doi.org/10.5061/dryad.m7q37nv and the enhanced AGF model codes are available from https://github.com/Guo-Jie-Jason-Gao/Drosophila-Markov-chain-Monte-Carlo-model.
G-JG, MH, JT, and JB conceived and developed the project and contributed to manuscript writing. JT provided the experimental data. G-JG, MH, and JB developed the enhanced AGF model. MH and JB analyzed the in vivo data. G-JG and JB developed simulation algorithms and analyzed the simulation data. All authors provided ideas and insightful discussions of all aspects of the project.
MH was partially supported by startup funding from Angelo State University. The Angelo State University College of Science and Engineering and the Department of Physics and Geosciences provided publication fee assistance. The AGF simulations were performed on the computational facility made available by the startup funding of Shizuoka University (G-JG).
The authors declare that the research was conducted in the absence of any commercial or financial relationships that could be construed as a potential conflict of interest.
All claims expressed in this article are solely those of the authors and do not necessarily represent those of their affiliated organizations, or those of the publisher, the editors and the reviewers. Any product that may be evaluated in this article, or claim that may be made by its manufacturer, is not guaranteed or endorsed by the publisher.
1. Gao GJJ, Holcomb MC, Thomas JH, Blawzdziewicz J. Embryo as an active granular fluid: Stress-coordinated cellular constriction chains. J Phys Condens Matter (2016) 28:414021.
2. Holcomb MC, Gao GJJ, Servati M, Schneider D, McNeely PK, Thomas JH, et al. Mechanical feedback and robustness of apical constrictions in Drosophila embryo ventral furrow formation. Plos Comput Biol (2021) 17:1009173. doi:10.1371/journal.pcbi.1009173
3. Mitrossilis D, Röper JC, Le Roy D, Driquez B, Michel A, Ménager C, et al. Mechanotransductive cascade of Myo-II-dependent mesoderm and endoderm invaginations in embryo gastrulation. Nat Commun (2017) 8:13883. doi:10.1038/ncomms13883
4. Weng M, Wieschaus E. Myosin-dependent remodeling of adherens junctions protects junctions from Snail-dependent disassembly. J Cel Biol (2016) 212:219–29. doi:10.1083/jcb.201508056
5. Chanet S, Miller C, Vaishnav E, Ermentrout B, Davidson L, Martin A. Actomyosin meshwork mechanosensing enables tissue shape to orient cell force. Nat Commun (2017) 8:15014. doi:10.1038/ncomms15014
6. Hunter M, Fernandez-Gonzalez R. Coordinating cell movements in vivo: Junctional and cytoskeletal dynamics lead the way. Curr Opin Cel Biol (2017) 48:54–62. doi:10.1016/j.ceb.2017.05.005
7. Das D, Chatti V, Emonet T, Holley SA. Patterned disordered cell motion ensures vertebral column symmetry. Dev Cel (2017) 42:170–80.e5. doi:10.1016/j.devcel.2017.06.020
8. Fruleux A, Boudaoud A. Modulation of tissue growth heterogeneity by responses to mechanical stress. Proc Natl Acad Sci U S A (2019) 116:1940–5. doi:10.1073/pnas.1815342116
9. Mann A, Sopher RS, Goren S, Shelah O, Tchaicheeyan O, Lesman A. Force chains in cell-cell mechanical communication. J R Soc Interf (2019) 16:20190348. doi:10.1098/rsif.2019.0348
10. Nestor-Bergmann A, Johns E, Woolner S, Jensen OE. Mechanical characterization of disordered and anisotropic cellular monolayers. Phys Rev E (2018) 97:052409. doi:10.1103/PhysRevE.97.052409
11. Nestor-Bergmann A, Goddard G, Woolner S, Jensen OE. Relating cell shape and mechanical stress in a spatially disordered epithelium using a vertex-based model. Math Med Biol A J IMA (2018) 35:1–27. doi:10.1093/imammb/dqx008
12. Banavar SP, Trogdon M, Drawert B, Yi TM, Petzold LR, Campas O. Coordinating cell polarization and morphogenesis through mechanical feedback. Plos Comput Biol (2021) 17:e1007971. doi:10.1371/journal.pcbi.1007971
13. Dye NA, Popovic M, Iyer KV, Fuhrmann JF, Piscitello-Gomez R, Eaton S, et al. Self-organized patterning of cell morphology via mechanosensitive feedback. eLife (2021) 10:e57964. doi:10.7554/eLife.57964
14. Wagh K, Ishikawa M, Garcia DA, Stavreva DA, Upadhyaya A, Hager GL. Mechanical regulation of transcription: Recent advances. Trends Cel Biol (2021) 31:457–72. doi:10.1016/j.tcb.2021.02.008
15. Valet M, Siggia ED, Brivanlou AH. Mechanical regulation of early vertebrate embryogenesis. Nat Rev Mol Cel Biol (2022) 23:169–84. doi:10.1038/s41580-021-00424-z
16. Doubrovinski K, Swan M, Polyakov O, Wieschaus E. Measurement of cortical elasticity in Drosophila melanogaster embryos using ferrofluids. Proc Natl Acad Sci U S A (2017) 114:1051–6. doi:10.1073/pnas.1616659114
17. Serwane F, Mongera A, Rowghanian P, Kealhofer D, Lucio A, Hockenbery Z, et al. In vivo quantification of spatially-varying mechanical properties in developing tissues. Nat Methods (2017) 14:181–6. doi:10.1038/nmeth.4101
18. D’Angelo A, Solon J. Application of mechanical forces on Drosophila embryos by manipulation of microinjected magnetic particles. Bio Protoc (2020) 10:e3608. doi:10.21769/BioProtoc.3608
19. D’Angelo A, Dierkes K, Carolis C, Salbreux G, Solon J. In vivo force application reveals a fast tissue softening and external friction increase during early embryogenesis. Curr Biol (2019) 29:1564–71.e6. doi:10.1016/j.cub.2019.04.010
20. Selvaggi L, Ackermann M, Pasakarnis L, Brunner D, Aegerter C. Force measurements of Myosin II waves at the yolk surface during Drosophila dorsal closure. Biophys J (2022) 121:410–20. doi:10.1016/j.bpj.2021.12.038
21. Brodland G, Conte V, Cranston P, Veldhuis J, Narasimhan S, Hutson M, et al. Video force microscopy reveals the mechanics of ventral furrow invagination in Drosophila. Proc Natl Acad Sci U S A (2010) 107:22111–6. doi:10.1073/pnas.1006591107
22. Merkel M, Manning M. Using cell deformation and motion to predict forces and collective behavior in morphogenesis. Semin Cel Dev Biol (2017) 67:161–9. doi:10.1016/j.semcdb.2016.07.029
23. Guglielmi G, Barry J, Huber W, De Renzis S. An optogenetic method to modulate cell contractility during tissue morphogenesis. Dev Cel (2015) 35:646–60. doi:10.1016/j.devcel.2015.10.020
24. Guo H, Swan M, He B. Optogenetic inhibition of actomyosin reveals mechanical bistability of the mesoderm epithelium during Drosophila mesoderm invagination. eLife (2022) 11:e69082. doi:10.7554/eLife.69082
25. Colombelli J, Solon J. Force communication in multicellular tissues addressed by laser nanosurgery. Cell Tissue Res (2013) 352:133–47. doi:10.1007/s00441-012-1445-1
26. Shivakumar P, Lenne PF. Laser ablation to probe the epithelial mechanics in Drosophila. In: C Dahmann, editor. Methods in molecular biology. New York, NY: Humana Press (2016). p. 241–51.
27. Agero U, Glazier JA, Hosek M. Bulk elastic properties of chicken embryos during somitogenesis. Biomed Eng Online (2010) 9:19. doi:10.1186/1475-925x-9-19
28. Garcia KE, Okamoto RJ, Bayly PV, Taber LA. Contraction and stress-dependent growth shape the forebrain of the early chicken embryo. J Mech Behav Biomed Mater (2017) 65:383–97. doi:10.1016/j.jmbbm.2016.08.010
29. Mongera A, Rowghanian P, Gustafson HJ, Shelton E, Kealhofer DA, Carn EK, et al. A fluid-to-solid jamming transition underlies vertebrate body axis elongation. Nature (2018) 561:401–5. doi:10.1038/s41586-018-0479-2
30. Das D, Julich D, Schwendinger-Schreck J, Guillon E, Lawton AK, Dray N, et al. Organization of embryonic morphogenesis via mechanical information. Dev Cel (2019) 49:829–39.e5. doi:10.1016/j.devcel.2019.05.014
31. Hiramatsu R, Matsuoka T, Kimura-Yoshida C, Han SW, Mochida K, Adachi T, et al. External mechanical cues trigger the establishment of the anterior-posterior axis in early mouse embryos. Dev Cel (2013) 27:131–44. doi:10.1016/j.devcel.2013.09.026
32. Ciarletta P, Ben Amar M, Labouesse M. Continuum model of epithelial morphogenesis during Caenorhabditis elegans embryonic elongation. Phil Trans R Soc A (2009) 367:3379–400. doi:10.1098/rsta.2009.0088
33. Mammoto T, Ingber D. Mechanical control of tissue and organ development. Development (2010) 137:1407–20. doi:10.1242/dev.024166
34. Zhang H, Labouesse M. Signalling through mechanical inputs—A coordinated process. J Cel Sci (2012) 125:3039–49. doi:10.1242/jcs.093666
35. Miller C, Davidson L. The interplay between cell signalling and mechanics in developmental processes. Nat Rev Genet (2013) 14:733–44. doi:10.1038/nrg3513
36. Chanet S, Martin A. Mechanical force sensing in tissues. In: AJ Engler, and S Kumar, editors. Mechanotransduction (elsevier), progress in molecular biology and translational science (2014). p. 317–52.
37. Heer N, Martin A. Tension, contraction and tissue morphogenesis. Development (2017) 144:4249–60. doi:10.1242/dev.151282
38. Gilmour D, Rembold M, Leptin M. From morphogen to morphogenesis and back. Nature (2017) 541:311–20. doi:10.1038/nature21348
39. Ladoux B, Mége R. Mechanobiology of collective cell behaviours. Nat Rev Mol Cel Biol (2017) 18:743–57. doi:10.1038/nrm.2017.98
40. Bailles A, Collinet C, Philippe JM, Lenne PF, Munro E, Lecuit T. Genetic induction and mechanochemical propagation of a morphogenetic wave. Nature (2019) 572:467–73. doi:10.1038/s41586-019-1492-9
41. Farge E. Mechanical induction of Twist in the Drosophila foregut/stomodeal primordium. Curr Biol (2003) 13:1365–77. doi:10.1016/s0960-9822(03)00576-1
42. Brouzés E, Farge E. Interplay of mechanical deformation and patterned gene expression in developing embryos. Curr Opin Genet Dev (2004) 14:367–74. doi:10.1016/j.gde.2004.06.005
43. Pouille PA, Ahmadi P, Brunet AC, Farge E. Mechanical signals trigger myosin II redistribution and mesoderm invagination in Drosophila embryos. Sci Signal (2009) 2:ra16. doi:10.1126/scisignal.2000098
44. Leptin M, Grunewald B. Cell-shape changes during gastrulation in Drosophila. Development (1990) 110:73–84. doi:10.1242/dev.110.1.73
45. Leptin M. twist and snail as positive and negative regulators during Drosophila mesoderm development. Genes Dev (1991) 5:1568–76. doi:10.1101/gad.5.9.1568
46. Seher T, Narasimha M, Vogelsang E, Leptin M. Analysis and reconstitution of the genetic cascade controlling early mesoderm morphogenesis in the Drosophila embryo. Mech Dev (2007) 124:167–79. doi:10.1016/j.mod.2006.12.004
47. Sweeton D, Parks S, Costa M, Wieschaus E. Gastrulation in Drosophila: the formation of the ventral furrow and posterior midgut invaginations. Development (1991) 112:775–89. doi:10.1242/dev.112.3.775
48. Ip Y, Maggert K, Levine M. Uncoupling gastrulation and mesoderm differentiation in the Drosophila embryo. EMBO J (1994) 13:5826–34. doi:10.1002/j.1460-2075.1994.tb06926.x
49. Martin A, Kaschube M, Wieschaus E. Pulsed contractions of an actin-myosin network drive apical constriction. Nature (2009) 457:495–9. doi:10.1038/nature07522
50. Kam Z, Minden J, Agard D, Sedat J, Leptin M. Drosophila gastrulation: Analysis of cell shape changes in living embryos by three-dimensional fluorescence microscopy. Development (1991) 112:365–70. doi:10.1242/dev.112.2.365
51. Polyakov O, He B, Swan M, Shaevitz J, Kaschube M, Wieschaus E. Passive mechanical forces control cell-shape change during Drosophila ventral furrow formation. Biophys J (2014) 107:998–1010. doi:10.1016/j.bpj.2014.07.013
52. Costa M, Wilson E, Wieschaus E. A putative cell signal encoded by the folded gastrulation gene coordinates cell-shape changes during Drosophila gastrulation. Cell (1994) 76:1075–89. doi:10.1016/0092-8674(94)90384-0
53. Morize P, Christiansen A, Costa M, Parks S, Wieschaus E. Hyperactivation of the folded gastrulation pathway induces specific cell shape changes. Development (1998) 125:589–97. doi:10.1242/dev.125.4.589
54. Dawes-Hoang R, Parmar K, Christiansen A, Phelps C, Brand A, Wieschaus E. Folded gastrulation, cell shape change and the control of myosin localization. Development (2005) 132:4165–78. doi:10.1242/dev.01938
55. Martin A, Gelbart M, Fernandez-Gonzalez R, Kaschube M, Wieschaus E. Integration of contractile forces during tissue invagination. J Cel Biol (2010) 188:735–49. doi:10.1083/jcb.200910099
56. Xie S, Martin A. Intracellular signalling and intercellular coupling coordinate heterogeneous contractile events to facilitate tissue folding. Nat Commun (2015) 6:7161. doi:10.1038/ncomms8161
57. Holcomb MC, Gao GJJ, Servati M, Schneider D, McNeely PK, Thomas JH, et al. Data from: Mechanical feedback and robustness of apical constrictions in Drosophila embryo ventral furrow formation (2021). Dryad Dataset (2021) 1:1. [Dataset]. doi:10.5061/dryad.m7q37nv
58. Gelbart M, He B, Martin A, Thiberge S, Wieschaus E, Kaschube M. Volume conservation principle involved in cell lengthening and nucleus movement during tissue morphogenesis. Proc Natl Acad Sci U S A (2012) 109:19298–303. doi:10.1073/pnas.1205258109
59. Howell D, Behringer R, Veje C. Fluctuations in granular media. Chaos (1999) 9:559–72. doi:10.1063/1.166430
60. Behringer R, Howell D, Kondic L, Tennakoon S, Veje C. Predictability and granular materials. Physica D: Nonlinear Phenomena (1999) 133:1–17. doi:10.1016/s0167-2789(99)00094-9
61. Van Liedekerke P, Palm MM, Jagiella N, Drasdo D. Simulating tissue mechanics with agent-based models: Concepts, perspectives and some novel results. Comput Part Mech (2015) 2:401–44. doi:10.1007/s40571-015-0082-3
62. Spahn P, Reuter R. A vertex model of Drosophila ventral furrow formation. PLOS One (2013) 8:e75051. doi:10.1371/journal.pone.0075051
63. Okabe A, Boots B, Sugihara K, Chiu S. Spatial tessellations: Concepts and applications of Voronoi diagrams. 2nd ed. New Jersey, NJ: Wiley (2000).
65. Mason F, Xie S, Vasquez C, Tworoger M, Martin A. RhoA GTPase inhibition organizes contraction during epithelial morphogenesis. J Cel Biol (2016) 214:603–17. doi:10.1083/jcb.201603077
66. Gao GJ, Blawzdziewicz J, O’Hern C. Frequency distribution of mechanically stable disk packings. Phys Rev E (2006) 74:061304. doi:10.1103/physreve.74.061304
67. Conte V, Muñoz J, Midownik M. A 3D finite element model of ventral furrow invagination in the Drosophila melanogaster embryo. J Mech Behav Biomed Mater (2008) 1:188–98. doi:10.1016/j.jmbbm.2007.10.002
68. Conte V, Ulrich F, Baum B, Muñoz J, Veldhuis J, Brodland W, et al. A biomechanical analysis of ventral furrow formation in the Drosophila melanogaster embryo. PLoS ONE (2012) 7:e34473. doi:10.1371/journal.pone.0034473
69. Guo H, Huang S, He B. Evidence for a role of the lateral ectoderm in Drosophila mesoderm invagination. Front Cel Dev Biol (2022) 10:867438. doi:10.3389/fcell.2022.867438
70. Fierling J, John A, Delorme B, Torzynski A, Blanchard G, Lye C, et al. Embryo-scale epithelial buckling forms a propagating furrow that initiates gastrulation. Nat Commun (2022) 13:3348. doi:10.1038/s41467-022-30493-3
71. Yevick H, Pearson W, Dunkel J, Martin A. Structural redundancy in supracellular actomyosin networks enables robust tissue folding. Dev Cel (2019) 50:586–98. E3. doi:10.1016/j.devcel.2019.06.015
72. Holcomb MC. Coordination of ventral furrow formation during Drosophila gastrulation through mechanical stress feedback. Lubbock, TX: Texas Tech University (2019). PhD Thesis.
73. Spencer AK, Siddiqui BA, Thomas JH. Cell shape change and invagination of the cephalic furrow involves reorganization of F-actin. Dev Biol (N Y 1985) (2015) 402:192–207. doi:10.1016/j.ydbio.2015.03.022
74. Eritano AS, Bromley CL, Albero AB, Utz LS, Wen FL, Takeda M, et al. Tissue-scale mechanical coupling reduces morphogenetic noise to ensure precision during epithelial folding. Dev Cel (2020) 53:212–28.e12. doi:10.1016/j.devcel.2020.02.012
75. Desprat N, Supatto W, Pouille PA, Beaurepaire E, Farge E. Tissue deformation modulates Twist expression to determine anterior midgut differentiation in Drosophila embryos. Dev Cel (2008) 15:470–7. doi:10.1016/j.devcel.2008.07.009
Keywords: Drosophila, embryo, morphogenesis, ventral furrow formation, cellular constrictions, mechanical feedback, constriction chains, Markov chain Monte Carlo (MCMC)
Citation: Gao G–JJ, Holcomb MC, Thomas JH and Blawzdziewicz J (2022) A Markov chain Monte Carlo model of mechanical-feedback-driven progressive apical constrictions captures the fluctuating collective cell dynamics in the Drosophila embryo. Front. Phys. 10:971112. doi: 10.3389/fphy.2022.971112
Received: 16 June 2022; Accepted: 07 October 2022;
Published: 31 October 2022.
Edited by:
Alberto Fernandez-Nieves, Catalan Institution for Research and Advanced Studies (ICREA), SpainReviewed by:
Dipjyoti Das, Indian Institute of Science Education and Research Kolkata, IndiaCopyright © 2022 Gao, Holcomb, Thomas and Blawzdziewicz. This is an open-access article distributed under the terms of the Creative Commons Attribution License (CC BY). The use, distribution or reproduction in other forums is permitted, provided the original author(s) and the copyright owner(s) are credited and that the original publication in this journal is cited, in accordance with accepted academic practice. No use, distribution or reproduction is permitted which does not comply with these terms.
*Correspondence: Jerzy Blawzdziewicz, amVyenkuYmxhd3pkemlld2ljekB0dHUuZWR1
Disclaimer: All claims expressed in this article are solely those of the authors and do not necessarily represent those of their affiliated organizations, or those of the publisher, the editors and the reviewers. Any product that may be evaluated in this article or claim that may be made by its manufacturer is not guaranteed or endorsed by the publisher.
Research integrity at Frontiers

Learn more about the work of our research integrity team to safeguard the quality of each article we publish.