 Ying Wang1
 Anmin Chen
95% of researchers rate our articles as excellent or good
Learn more about the work of our research integrity team to safeguard the quality of each article we publish.
Find out more
ORIGINAL RESEARCH article
Front. Phys. , 14 July 2022
Sec. Optics and Photonics
Volume 10 - 2022 | https://doi.org/10.3389/fphy.2022.964140
This article is part of the Research Topic State-of-the-Art Laser Spectroscopy and its Applications : Volume II View all 51 articles
Increasing the emission intensity of laser-induced breakdown spectroscopy (LIBS) is an effective way to improve the sensitivity of LIBS technology to elements analysis in liquid samples. In this work, the influence of the distance from lens to sample surface (DFLS) on the spectral emission of femtosecond laser-induced plasma of NaCl water film was studied by measuring Na atomic line. The results showed that the emission intensity of the spectral line presented the phenomenon of double peaks with an increase in the DFLS. The position for the highest spectral intensity was not geometric focal point of focusing lens, but was located in front of the geometric focal point. In addition, we carried out quantitative analysis on Na element with different concentrations, showing a calibration curve of Na element, and calculating limit of detection (LOD) and relative standard deviation (RSD) for different DFLSs. Subsequently, the changes in the LOD and RSD with the DFLS are discussed. With the increase of the DFLS, the LOD and RSD were greatly reduced. At the DFLS of 99.0 mm, the line intensity was highest, and the LOD and RSD were better. Therefore, it can be confirmed that femtosecond LIBS of water film can be optimized by changing the DFLS, the experiment shows great potential in real-time water quality monitoring.
Laser-induced breakdown spectroscopy (LIBS) is an analysis technique based on atomic emission spectroscopy of laser-induced plasma [1–5]. After decades of development, LIBS technology has become a very popular and effective element analysis method [6–8]. However, this technology is mainly for solid samples and gas samples, while the analysis of liquid samples is still rarely reported. In recent years, the LIBS technology is extensively used to the rapid chemical element analysis of liquids, which has many potential application prospects, including water quality monitoring [9, 10], environmental monitoring [11, 12], food industry quality monitoring [13–15], medical monitoring [16–18], etc. But, the use of LBS technology to detect liquid samples faces a series of problems, for example, dissolved gas, particulate material and bubbles generated by previous laser pulse can cause the laser beam to fail to be focused; the liquid evaporation causes the loss of laser energy, which reduces the availability of plasma excitation energy; high local density in the liquid leads to rapid quenching, which prohibits time-selective detection, etc. Due to the inherent problems mentioned above, LIBS technology has not fully developed its potential in the field of liquid sample analysis. In order to overcome these drawbacks, researchers are trying to find appropriate experimental methods and sample preparation methods to improve the stability and analytical sensitivity of liquid sample.
Enhanced laser-induced plasma emission intensity is the main way to make up for these disadvantages of LIBS technology. Based on solid samples, researchers believe that many methods, including double-pulse [19], spatial confinement [20–22], magnetic confinement [23], spark discharge enhancement [24–27], increasing sample temperature [28–31], changing the distance from lens to sample surface (DFLS) [32–34], can improve the stability and analytical sensitivity of liquid samples. Among them, the double-pulse method is frequently applied to the detection of liquid samples. Virendra et al reported that the characteristic spectral line intensity of double-pulse excitation was enhanced by at least 6 times compared with single pulse LIBS for liquid samples [35]. Kheireddine et al explored the basic characteristics of plasma generated by double-pulse lasers [10], and the enhancement mechanism of double-pulse LIBS was due to the prolongation of the plasma lifetime. They found that the application of the double-pulse method in the liquid samples had achieved significant results. In addition to the double-pulse method, spatial confinement, and magnetic confinement methods are great tools to improve the detection sensitivity of samples. However, in view of the instability of liquid samples, these methods are more difficult to implement. In view of this, the change in the DFLS is flexible and controllable method to improve the spectral intensity of laser-induced plasma, and is almost not limited by the instability of liquid samples. Changing the DFLS can result in a difference in the laser fluence, which has the great impacts on the properties and morphologies of the plasma, and further affecting the plasma emission [36]. In summary, the influence of the DFLS on the analysis of elements in the liquid samples is still a hot topic that worthy of further study and discussion.
For liquid samples, liquid splashes and ripples formed by laser ablation hinder the effective detection of plasma emission. Moreover, the optical components used in the experiment are contaminated by the splashes, which affect the reliability of the LIBS detection results. In order to overcome these problems, some researchers have proposed the following methods: laser ablation of laminar flow with sheath or carrier gas [16, 37], laser ablation droplets [38], laser ablation aerosol [39], laser ablation liquid jet [40–42], convert liquid phase to solid phase [43]. Among these sampling methods, the laminar flow technique of sheath or carrier gas has the higher measurement accuracy, but the operation is more difficult. In contrast, the liquid jet method shows some advantages, viz. simple operation and good measurement accuracy. Some research groups have proved that the use of jet technology could improve the sensitivity of LIBS technology to detect elements in liquids. For example, Yaroshchyk et al compared the laser-induced breakdown spectra of liquid jets and stationary liquid surfaces [44]. Under the same conditions, the limit of detection obtained by the jet method was 4 times lower than that obtained by a static liquid. Nevertheless, we considered that the volume of the interaction between the laser and the liquid substrate was a key factor affecting detection sensitivity. The use of a thinner liquid film can reduce the generation of droplets at the plasma emission site and further improve the detection sensitivity of LIBS.
In the above-discussed reports on liquid samples, nanosecond lasers are usually used as the main laser light source, but another way to improve sensitivity is to use femtosecond laser pulses to excite the plasma on the sample surface [45–47]. In contrast, the mechanical and thermodynamic parameters of femtosecond laser breakdown plasma are very different from those of nanosecond laser, which is why femtosecond LIBS has higher sensitivity [48, 49]. So far, the investigations on the femtosecond LIBS technology of liquid sample in film form are relatively lacking. In this paper, we investigated the influence of the DFLS on the spectral emission of NaCl plasma of femtosecond laser excitation in the atmosphere, and the variation of spectral line intensity with the DFLS for different NaCl concentrations was discussed. The trend in the limit of detection (LOD) and relative standard deviation (RSD) with the DFLS were obtained by measuring Na (I) spectral line. Based on these results, it is concludes that there is an appropriate DFLS that can help to improve the detection sensitivity of LIBS technology for quantitative analysis of specific elements in the liquid samples for femtosecond LIBS.
For the detection of liquid samples by LIBS technology, the sampling methods for obtaining spectral information mainly include static liquid, flowing droplets, and conversion of liquid to solid samples. The liquid jet method stands out from the above methods by reducing surface fluctuations and increasing the repetition rate, but the jet method still has the disadvantage, that is, the laser focus point cannot be determined on the liquid surface. Hence, we improved the liquid sampling method, and customized the water film forming device based on the liquid jet. Place two aluminum wires with a diameter of 0.2 mm and set an interval of 4.0 mm on both sides of the water nozzle, adjust the water flow rate to 40 ml/min, and let the NaCl solution form a stable flowing water film with thickness of about 0.2 mm under the action of gravity and surface tension. We adjust the distance between the laser focus point and the nozzle to be 2/3 of the length of the water film, which ensures the stability of the laser penetrating the water film. Adopting this sampling method can greatly reduce liquid splashing, avoid splashing droplets from polluting the optical lens, and ensure the high stability of the spectrum. However, it must be pointed out that the ablated plasma vaporizes the liquid and generates mist or droplets when the laser excited water film. Only after a small amount of splashing, the generated mist or droplets will cause more intense plasma emission [50].
The principle diagram of the experimental device is shown in Figure 1. The LIBS system was mainly composed of a laser and a spectrometer. In detail, an one-box ultrafast Ti:Sapphire amplifier (Coherent Libra) was used as laser light source to generate plasma. The output pulse wavelength of the femtosecond laser system was 800 nm, the pulse width was 50 fs, the laser energy was 2.9 mJ, and the maximum pulse repetition frequency was 1 kHz. The laser pulse was first transferred to the direction perpendicular to the sample through two mirrors, and then a quartz lens with a focal length of 100 mm was used to focus the beam onto the sample surface. In the experiment, the samples were NaCl solutions with different concentrations, and the concentrations were shown in Table 1. A plano-convex lens used to focus the beam was placed on a one-dimensional motorized translation stage (Zolix Instruments) to change the DFLS. The optical emission of the plasma generated by the laser focusing sample was collected by a lens (75 mm focal length and 50 mm diameter) that was 45° with the laser beam, and was focused into an optical fiber. The optical signal was transmitted to a spectrometer (Spectra Pro 500i, PI Acton) with three gratings (150, 1,200, and 2,400 line per mm) through the optical fiber, the grating used in the experiment was 1,200 line per mm, in which the spectral resolution was 0.04 nm. An intensified charge-coupled device (ICCD, PI-MAX4, Princeton Instruments) with 1,024 × 1,024 pixels was used to detect the dispersed light by the spectrometer. The ICCD chip was “KAI 1024 × 1,024” from Eastman Kodak Company. The ICCD worked in gate mode. Before the experiment, the ICCD chip was cooled to −20°C. The synchronization delay generator of the femtosecond laser triggered the ICCD to synchronize the delay between the laser pulse and the spectral signal. In order to reduce the interference of background emission, the delay time of ICCD was set to 0.5 μs and the gate width was fixed as 5 µs. The working mode of the femtosecond laser system was divided into single-shot and continuous-shot modes. In the current experiment, the single-shot working mode was adopted. The data output by ICCD was recorded by a computer. Each data was a result of 10 laser cumulative emission, 20 spectra were collected with each solution concentration. The whole experiment was carried out in a standard atmospheric pressure environment with an ambient temperature of 22°C and an air humidity of 40%.
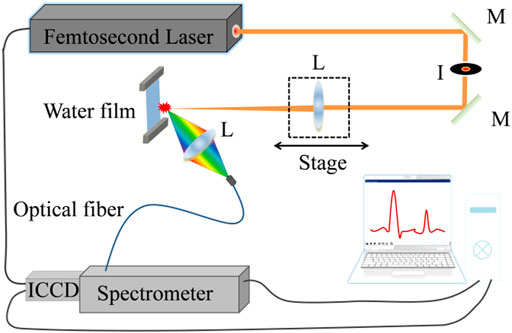
FIGURE 1. Experimental setup including mirror (M), iris (I), lens (L), and intensified CCD (ICCD).

TABLE 1. Concentration of Na element in NaCl solution.
In the beginning, adjusting the delay time and pulse width of the ICCD, it is expected to collect characteristic spectrum. When the NaCl film is at the focal point and the solution concentration is 4.00 μg/ml, the emission of Na atomic line generated by femtosecond laser will be detected and recorded. In order to increase the detection sensitivity and reduce the standard deviation, we collected 10 spectrums of water film plasma and averaged them, as shown in Figure 2. It can be seen from Figure 2 that there are two obvious peaks in the wavelength range from 588.5 to 590.0 nm, namely Na (I) 589.0 nm and Na (I) 589.6 nm. According to the NIST atomic spectra database, the spectral lines of these two wavelengths are produced by 2p63s (2S)→2p63p (2P0) transitions. The same element corresponds to different center wavelengths, and the difference is mainly due to the difference in the angular momentum of the upper and lower electron orbits and the difference in excited state energy levels during the transition.
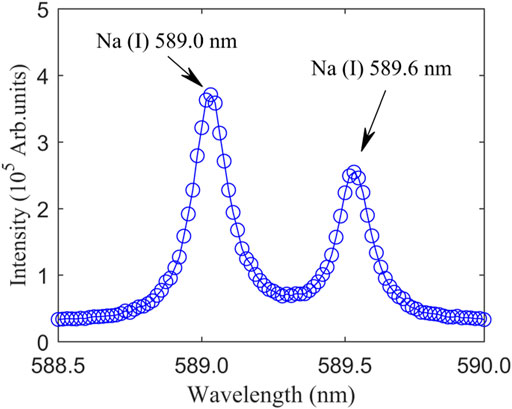
FIGURE 2. Typical emission spectrum of NaCl water solution plasma. The NaCl concentration is 4.00 μg/ml. The NaCl film is located at the focal point (DFLS = 100 mm).
We measured the emission line intensity of Na (I) in NaCl salt solution with different Na Cl concentrations (see Table 1), and obtained the dependence of spectral intensity on the concentration of NaCl solution, as shown in Figure 3. The DFLS was fixed at 100 mm (the sample film was at the focal point of the focusing lens). It can be observed from Figure 3 that the spectral line intensities of the Na (I) 589.0 nm and Na (I) 589.6 nm increase with increasing the concentration of NaCl. When the concentration is 0.25 μg/ml, the spectral line intensity of the element is weakest, and the signal-to-background ratio has a low value. The laser pulse power density must exceed the breakdown threshold of the sample before the laser interacts with the sample, while the plasma characteristics and laser energy breakdown threshold depend on the mass of the solute in the solution [51]. In the current experiment, when a high-power laser is focused on the surface of high-concentration NaCl water film, the sample is more likely to release a large number of atoms, ions and electrons. At this time, free electrons in the reverse bremsstrahlung emission greatly increase the energy of the absorbed photons themselves, resulting in an increase in the breakdown of the liquid sample, so the higher NaCl concentration will emit the stronger characteristic spectrum.
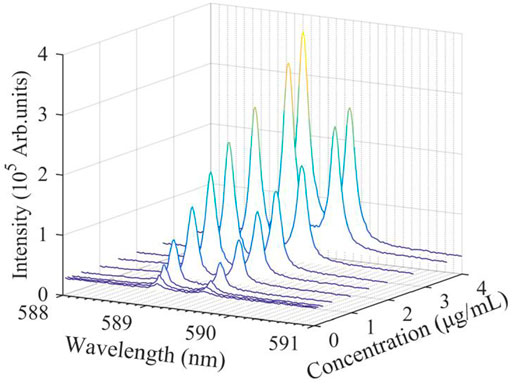
FIGURE 3. Evolution of Na atomic lines from laser-induced plasma with NaCl concentration of. The NaCl film is located at the focal point plane (DFLS = 100 mm).
The laser is focused on the surface of the liquid sample, forming plasma plume. A small change in the DFLS will cause the absolute emission intensity of the plasma to change. In many published papers [52, 53], the DFLS was usually selected to be shorter than the focal length of focusing lens, which can effectively avoid air breakdown before the laser pulse reaches the sample surface. The concentration of NaCl solution was fixed at 4.00 μg/ml to ensure that the maximum content of Na in the plasma, which is convenient for exploring the influence of the DFLS on the spectral intensity of the liquid plasma. It can be clearly observed from Figure 4 that the intensity of the spectral line increases with the increase of the DFLS, and along the direction of the femtosecond laser, the maximum value of emission intensity appears before the focus point, approximately at 99.0 mm. When the DFLS continues to increase to about 101.0 mm, another peak of emission intensity appears, but it is lower than the peak intensity before the focal point. In essence, the laser spot on the sample surface depends on the change in the DFLS. The size of the laser spot directly affects the laser fluence on the sample surface, and controls the coupling between laser and sample, resulting in a change in the emission intensity of laser-induced plasma [54]. In the experiment, as the DFLS increases from 97.0 to 99.0 mm, the laser spot gradually decreases and the laser fluence gradually increases, resulting in a significant increase in the spectral intensity of Na (I). The influence of the DFLS on the spectral intensity at different NaCl concentrations is discussed in detail below.
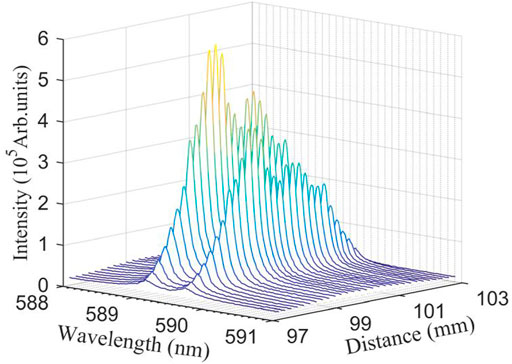
FIGURE 4. Evolution of spectral emission from laser-induced plasma with NaCl water film with DFLS. The NaCl concentration is 4.00 μg/ml.
In order to study whether the influence of the DFLS on the plasma spectral intensity at low NaCl concentration is consistent with that at high NaCl concentration, we discussed the evolution of Na (I) 589.0 and 589.6 nm line intensities with the DFLS at different NaCl concentrations, as shown in Figure 5. For any NaCl concentration, the influence of the DFLS on the intensity of the characteristic spectral line is consistent. Moreover, it can be seen more intuitively from Figure 5 that, with the increase of the DFLS, the spectral intensity presents a double emission peaks. The two peaks of laser-induced plasma intensity can be obtained when the DFLS are 99.0 and 100.6 mm but the peak intensity value is not the same. This phenomenon is different from nanosecond LIBS. For nanosecond LIBS, the spectra before and after the focal point show a symmetrical distribution [55]. There is another phenomenon: when the sample surface is at the geometric focal point, the intensity of the spectral line is not maximum value. The main reason is the plasma shielding effect [54]. Different from nanosecond LIBS, the laser excitation source used in the experiment was femtosecond laser, and its nonlinear effect cannot be ignored. The nonlinear effect of ultra-short pulses will produce self-focusing, self-defocusing and re-focusing. The paper by Li et al stated that the focal length of the focusing lens may be shortened by the optical Kerr self-focusing effect [56]. Therefore, the first laser focusing position appeared in front of the focal point and generated stronger laser-induced plasma emission. As the DFLS increased, the plasma self-defocusing effect generated by tunneling or multi-photon ionization caused the plasma emission to decrease. Continue to increase the DFLS, the optical Kerr effect was still stronger than the defocusing effect of the plasma, so the re-focusing effect occurred, which is the reason for another peak intensity after the geometric focal point.
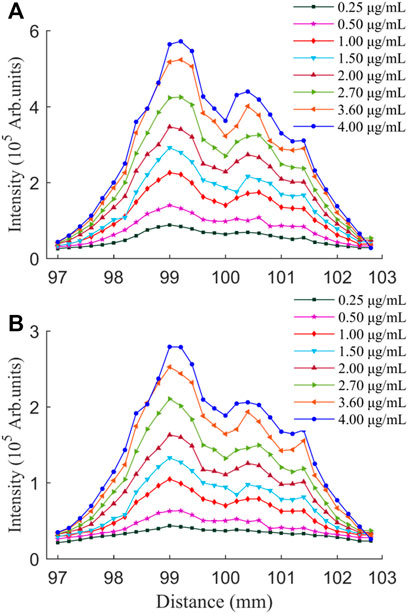
FIGURE 5. Evolution of emission peak intensities for Na (Ι) 589.0 nm (A) and 589.6 nm (B) with DFLS for different NaCl concentrations.
Like most analytical methods, the quantitative analysis of LIBS is inseparable from the use of calibration curves. Before calibrating the element to be measured, it is assumed that the concentration of the element to be measured in the plasma is consistent with the element concentration in the corresponding sample. During the calibration and detection process, the calibration of Na element is achieved, when all parameters that affect the plasma characteristics are constant. For the purpose of increase the credibility of the calibration method, each data point collected was a result of 10 laser accumulations, and 25 spectra were collected at each NaCl concentration. Therefore, the calibration curve shown in Figure 6 is an average of multiple repeated tests. The figure shows the calibration curves of Na (Ι) at different DFLSs, three typical DFLSs are 99.0 mm (a and b), 100.0 mm (c and d), and 100.6 mm (e and f), respectively. And Figure 6 (a, c, and e) show the calibration curve of Na (Ι) 589.0 nm, and Figure 6 (b, d, and f) show the calibration curve of Na (Ι) 589.6 nm. In Figure 6, the linear correlation coefficient (R2) of Na (Ι) 589.0 nm is greater than 0.98, and the R2 of Na (Ι) 589.6 nm is greater than 0.99. Theoretically, if the measured spectral intensity is stable, the linear correlation coefficient between its intensity and concentration is close to 1. It indicates that the experimental method of femtosecond laser-excited NaCl thin film has a better stability in detecting the content of Na element for aqueous solution.
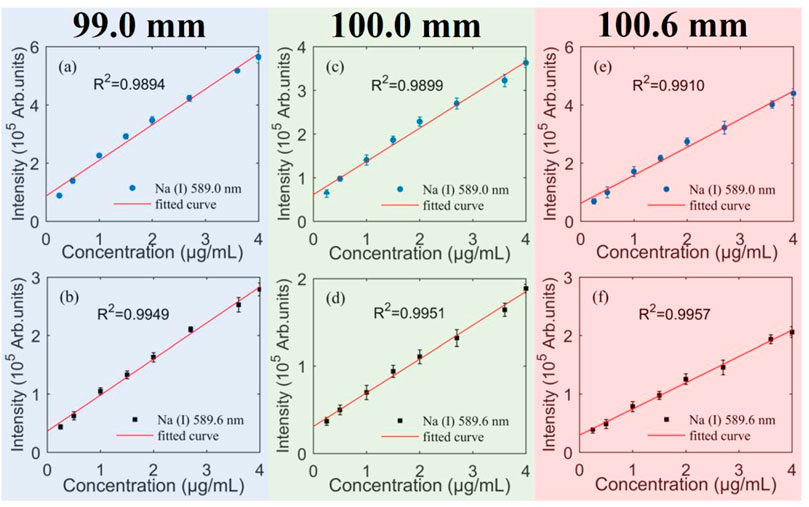
FIGURE 6. Calibration curves for Na (Ι) 589.0 nm (a, c, and e) and Na (Ι) 589.6 nm (b, d, and f) for three DFLSs. The DFLSs are 99.0 mm (A,B), 100.0 mm (C,D), and 100.6 mm (E,F), respectively.
In the following content, we discussed the key indicators for the quantitative analysis of LIBS technology: LOD of element, which is usually calculated from the data extracted from the calibration curve. The LOD represents the lowest concentration of an element detected in the experiment. According to 3σ-IUPAC, the LOD of a certain element is the concentration for three times of the background standard deviation of the line intensity σ: LOD = 3σ/S, here S is the slope of the calibration curve of a characteristic atomic line. Figure 7 shows the evolution of the LOD of Na (I) with the DFLS. It is obvious from figure that the change in the DFLS has a positive effect on the reduction in the LOD. With the increase of the DFLS, the LOD decreased significantly. The LOD of Na (I) has a lower value in the range of the DFLS from 99.0 to 101.0 mm. At 99.0 mm, the LOD has the lowest value. Referring to the evolution of emission intensity with the DFLS in Figure 5, the maximum plasma emission intensity can be obtained at 99.0 mm, and the corresponding LOD has the minimum value. The reduction in the LOD further proves that selecting a optimized DFLS is an effective way to improve detection sensitivity.
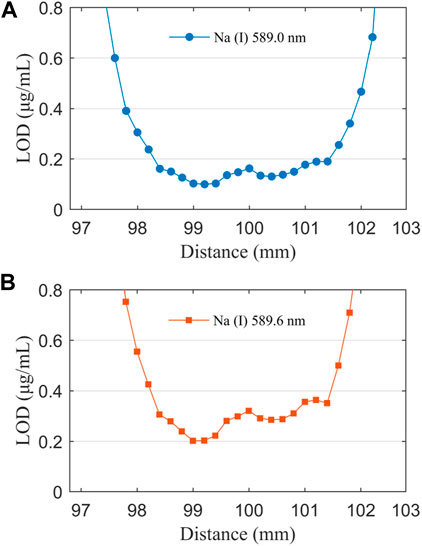
FIGURE 7. Evolution of LOD of Na (Ι) 589.0 nm (A) and Na (Ι) 589.6 nm (B) with DFLS.
Apart from this, the signal stability is an important parameter that affects the reliability of LIBS in detecting element concentrations in liquid samples. It is actually related to the RSD of a characteristic spectral line in repeated measurement spectra [57]. Laser-induced plasma is used as a pulse excitation source to atomize and ablate the sample. The instability between different excitation points as well as the instability of repeated laser pulses will limit the repeatability of detection [58]. Therefore, understanding the influence of the DFLS on signal stability is necessary to know the accuracy of the experiment. At a solute concentration of 4.00 μg/ml, the RSD as a function of the DFLS is presented in Figure 8. Similar to the change in the LOD, the RSD shows a trend that first decreases, stabilizes, and finally increases with the increase of the DFLS. In the range of the DFLS from 99.0 to 101.0 mm, the RSD is low, and fluctuating between 2.5 and 5.0%. In this study, the lower RSD further proves that the experimental method of femtosecond laser-induced NaCl thin film has better spectral stability at appropriate DFLS.
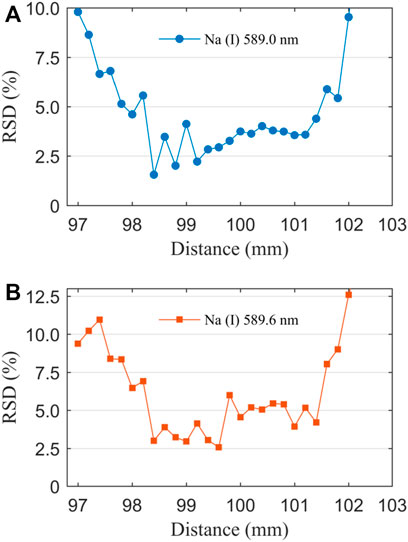
FIGURE 8. Evolution of RSD with DFLS for Na (Ι) 589.0 nm (A) and 589.6 nm (B), the solute concentration is 4.00 μg/ml.
In this work, femtosecond LIBS had been used to detect specific element in aqueous solution. To date, the main difficulties affecting the application of LIBS technology in liquid samples are liquid splashing and low signal stability. In order to overcome this problem, we used femtosecond laser excitation source and changed the sampling method of the liquid sample. We customized the water film based on the liquid jet. The purpose is to make the sample form a stable flowing film, stabilizing the liquid; and femtosecond laser may minimize liquid splashing. Moreover, we studied the influence of the DFLS on the detection ability for NaCl aqueous solution. The focal length of the focusing lens was 100 mm. With the increase of the DFLS, the plasma emission presented double emission peak intensities. Before the geometric focal point of the focusing lens, the maximum line intensity of Na (I) lines was obtained. Essentially, the results were due to the nonlinear effect of femtosecond laser propagation in air. Subsequently, the different concentrations of Na element are quantitatively analyzed, plotting the calibration curve of Na element. In the three selected DFLSs, the R2 of Na (Ι) 589.0 nm was greater than 0.98, and the R2 of Na (Ι) 589.6 nm was greater than 0.99. According to the calibration curve, the LODs and RSDs at different DFLSs were obtained. As the DFLS increased, the LOD and RSD first decreased, and then increased. In the range of the DFLS from 99.0 to 101.0 mm, the two parameters had lower values. From the above discussion, it can be concluded that the combination of femtosecond laser and water film can significantly improve the analysis stability of liquid samples by optimized the DFLS.
The raw data supporting the conclusions of this article will be made available by the authors, without undue reservation.
YW: writing—original draft and editing. HG: investigation. YH: investigation. DZ: investigation, methodology, and conceptualization. AC: investigation, methodology, and conceptualization. MJ: investigation.
We acknowledge the support by National Natural Science Foundation of China (Nos. 11674128, 11674124 and 11974138), and the Jilin Province Scientific and Technological Development Program, China (No. 20170101063JC).
The authors declare that the research was conducted in the absence of any commercial or financial relationships that could be construed as a potential conflict of interest.
All claims expressed in this article are solely those of the authors and do not necessarily represent those of their affiliated organizations, or those of the publisher, the editors and the reviewers. Any product that may be evaluated in this article, or claim that may be made by its manufacturer, is not guaranteed or endorsed by the publisher.
1. Singh JP, Almirall JR, Sabsabi M, Miziolek AW. Laser-induced breakdown spectroscopy (LIBS). Anal Bioanal Chem (2011) 400(10):3191–2. doi:10.1007/s00216-011-5073-5
2. Hou Z, Jeong S, Deguchi Y, Wang Z. Way-out for laser-induced breakdown spectroscopy. Plasma Sci Technol (2020) 22(7):070101. doi:10.1088/2058-6272/ab95f7
3. Wang Z, Dong F, Zhou W. A rising force for the world-wide development of laser-induced breakdown spectroscopy. Plasma Sci Technol (2015) 17(8):617–20. doi:10.1088/1009-0630/17/8/01
4. Chen A, Li S, Qi H, Jiang Y, Hu Z, Huang X, et al. Elongation of plasma channel generated by temporally shaped femtosecond laser pulse. Opt Commun (2017) 383:144–7. doi:10.1016/j.optcom.2016.08.079
5. Zhang N, Ou T, Wang M, Lin Z, Lv C, Qin Y, et al. A brief review of calibration-free laser-induced breakdown spectroscopy Front Phys (2022) 10:887171. doi:10.3389/fphy.2022.887171
6. Ma Y, Feng W, Qiao S, Zhao Z, Gao S, Wang Y, et al. Hollow-core anti-resonant fiber based light-induced thermoelastic spectroscopy for gas sensing Opt Express (2022) 30(11):18836. doi:10.1364/oe.460134
7. Ma Y, He Y, Tong Y, Yu X, Tittel FK. Quartz-tuning-fork enhanced photothermal spectroscopy for ultra-high sensitive trace gas detection. Opt Express (2018) 26(24):32103. doi:10.1364/oe.26.032103
8. Ma Y, Lewicki R, Razeghi M, Tittel FK. QEPAS based ppb-level detection of CO and N_2O using a high power CW DFB-QCL. Opt Express (2013) 21(1):1008. doi:10.1364/oe.21.001008
9. Yao M, Lin J, Liu M, Xu Y. Detection of chromium in wastewater from refuse incineration power plant near Poyang Lake by laser induced breakdown spectroscopy. Appl Opt (2012) 51(10):1552. doi:10.1364/ao.51.001552
10. Rifai K, Laville S, Vidal F, Sabsabi M, Chaker M. Quantitative analysis of metallic traces in water-based liquids by UV-IR double-pulse laser-induced breakdown spectroscopy. J Anal Spectrom (2012) 27(2):276–83. doi:10.1039/c1ja10178a
11. Wang Q, Ge T, Liu Y, Jiang L, Chen A, Han J, et al. Highly sensitive analysis of trace elements in aqueous solutions using surface-enhanced and discharge-assisted laser-induced breakdown spectroscopy. J Anal Spectrom (2022) 37(2):233–9. doi:10.1039/d1ja00415h
12. Zhang D, Chen A, Chen Y, Wang Q, Li S, Jiang Y, et al. Influence of substrate temperature on the detection sensitivity of surface-enhanced LIBS for analysis of heavy metal elements in water. J Anal Spectrom (2021) 36(6):1280–6. doi:10.1039/d1ja00003a
13. St-Onge L, Kwong E, Sabsabi M, Vadas EB. Rapid analysis of liquid formulations containing sodium chloride using laser-induced breakdown spectroscopy. J Pharm Biomed Anal (2005) 36(2):277–84. doi:10.1016/j.jpba.2004.06.004
14. Kongbonga YGM, Ghalila H, Onana MB, Lakhdar ZB. Classification of vegetable oils based on their concentration of saturated fatty acids using laser induced breakdown spectroscopy (LIBS). Food Chem (2014) 147:327–31. doi:10.1016/j.foodchem.2013.09.145
15. Abdel-Salam Z, Al Sharnoubi J, Harith MA. Qualitative evaluation of maternal milk and commercial infant formulas via LIBS. Talanta (2013) 115:422–6. doi:10.1016/j.talanta.2013.06.003
16. Cheung NH, Yeung ES. Distribution of sodium and potassium within individual human erythrocytes by pulsed-laser vaporization in a sheath flow. Anal Chem (1994) 66(7):929–36. doi:10.1021/ac00079a003
17. Khan MN, Wang Q, Idrees BS, Xiangli W, Teng G, Cui X, et al. A review on laser-induced breakdown spectroscopy in different cancers diagnosis and classification. Front Phys (2022) 10:821057. doi:10.3389/fphy.2022.821057
18. Xu F, Ma S, Zhao C, Dong D. Application of molecular emissions in laser-induced breakdown spectroscopy: A review. Front Phys (2022) 10:821528. doi:10.3389/fphy.2022.821528
19. Chen A, Li S, Li S, Jiang Y, Shao J, Wang T, et al. Optimally enhanced optical emission in laser-induced air plasma by femtosecond double-pulse. Phys Plasmas (2013) 20(10):103110. doi:10.1063/1.4825346
20. Shen X, Sun J, Ling H, Lu Y. Spectroscopic study of laser-induced Al plasmas with cylindrical confinement. J Appl Phys (2007) 102(9):093301. doi:10.1063/1.2801405
21. Li C, Guo L, He X, Hao Z, Li X, Shen M, et al. Element dependence of enhancement in optics emission from laser-induced plasma under spatial confinement. J Anal Spectrom (2014) 29(4):638. doi:10.1039/c3ja50368b
22. Wang X, Chen A, Wang Y, Zhang D, Sui L, Ke D, et al. Spatial confinement effect on femtosecond laser-induced Cu plasma spectroscopy. Phys Plasmas (2017) 24(10):103305. doi:10.1063/1.4986027
23. Lu Y, Zhou YS, Qiu W, Huang X, Liu L, Jiang L, et al. Magnetic field enhancement for femtosecond-laser-ablation mass spectrometry in ambient environments. J Anal Spectrom (2015) 30(11):2303–6. doi:10.1039/c5ja00225g
24. He X, Chen B, Chen Y, Li R, Wang F. Femtosecond laser-ablation spark-induced breakdown spectroscopy and its application to the elemental analysis of aluminum alloys. J Anal Spectrom (2018) 33(12):2203–9. doi:10.1039/c8ja00261d
25. Li K, Zhou W, Shen Q, Ren Z, Peng B. Laser ablation assisted spark induced breakdown spectroscopy on soil samples. J Anal Spectrom (2010) 25(9):1475. doi:10.1039/b922187e
26. Wang Q, Chen A, Xu W, Zhang D, Wang Y, Li S, et al. Time-resolved spectroscopy of femtosecond laser-induced Cu plasma with spark discharge. Plasma Sci Technol (2019) 21:065504. doi:10.1088/2058-6272/ab0fa6
27. Li Q, Chen A, Zhang D, Wang Q, Xu W, Qi Y, et al. Time-resolved electron temperature and density of spark discharge assisted femtosecond laser-induced breakdown spectroscopy. Optik (2021) 225:165812. doi:10.1016/j.ijleo.2020.165812
28. Wang Y, Chen A, Jiang Y, Sui L, Wang X, Zhang D, et al. Temperature effect on femtosecond laser-induced breakdown spectroscopy of glass sample. Phys Plasmas (2017) 24(1):013301. doi:10.1063/1.4973658
29. Wang Y, Chen A, Wang Q, Zhang D, Sui L, Li S, et al. Enhancement of optical emission generated from femtosecond double-pulse laser-induced glass plasma at different sample temperatures in air. Plasma Sci Technol (2019) 21(3):034013. doi:10.1088/2058-6272/aaefa1
30. Liu Y, Tong Y, Wang Y, Zhang D, Li S, Jiang Y, et al. Influence of sample temperature on the expansion dynamics of laser-induced germanium plasma. Plasma Sci Technol (2017) 19(12):125501. doi:10.1088/2058-6272/aa8acc
31. Yang X, Li S, Jiang Y, Chen A, Jin M Influence of distance between focusing lens and sample surface on laser-induced breakdown spectroscopy of brass at different sample temperatures. Acta Phys Sin (2019) 68(6):065201. doi:10.7498/aps.68.20182198
32. Wang Y, Chen A, Wang Q, Sui L, Ke D, Cao S, et al. Influence of distance between focusing lens and target surface on laser-induced Cu plasma temperature. Phys Plasmas (2018) 25(3):033302. doi:10.1063/1.5010076
33. Guo J, Shao J, Wang T, Zheng C, Chen A, Jin M. Optimization of distances between the target surface and focal point on spatially confined laser-induced breakdown spectroscopy with a cylindrical cavity. J Anal Spectrom (2017) 32(2):367–72. doi:10.1039/c6ja00396f
34. Zhang D, Chen A, Wang Q, Wang Y, Li S, Jiang Y, et al. Effect of lens focusing distance on laser-induced silicon plasmas at different sample temperatures. Plasma Sci Technol (2019) 21(3):034009. doi:10.1088/2058-6272/aaec9b
35. Rai VN, Yueh F-Y, Singh JP. Study of laser-induced breakdown emission from liquid under double-pulse excitation. Appl Opt (2003) 42(12):2094. doi:10.1364/ao.42.002094
36. Wang Q, Ge T, Liu Y, Chen A, Li S, Jin M, et al. Effect of the lens-to-target distance on the determination of Cr in water by the electro-deposition method and laser-induced breakdown spectroscopy. J Anal Spectrom (2021) 36(12):2675–83. doi:10.1039/d1ja00275a
37. Yoshiro I, Osamu U, Suaumu N. Determination of colloidal iron in water by laser-induced breakdown spectroscopy. Analytica Chim Acta (1995) 299:401–5. doi:10.1016/0003-2670(94)00313-b
38. Archontaki HA, Crouch SR. Evaluation of an isolated droplet sample introduction system for laser-induced breakdown spectroscopy. Appl Spectrosc (1988) 42(5):741–6. doi:10.1366/0003702884429049
39. Ng KC, Ayala NL, Srmeonsson JB, Winefordner JD. Laser-induced plasma atomic emission spectrometry in liquid aerosols. Analytica Chim Acta (1992) 269(1):123–8. doi:10.1016/0003-2670(92)85141-r
40. Samek O, Beddows DCS, Kaiser J, Kukhlevsky SV, Liska M, Telle HH, et al. Application of laser-induced breakdown spectroscopy to in situ analysis of liquid samples. Opt Eng (2000) 39(8):2248. doi:10.1117/1.1304855
41. Yaroshchyk P, Morrison RJS, Body D, Chadwick BL. Theoretical modeling of optimal focusing conditions using laser-induced breakdown spectroscopy in liquid jets. Appl Spectrosc (2004) 58(11):1353–9. doi:10.1366/0003702042475592
42. Kuwako A, Uchida Y, Maeda K. Supersensitive detection of sodium in water with use of dual-pulse laser-induced breakdown spectroscopy. Appl Opt (2003) 42(30):6052. doi:10.1364/ao.42.006052
43. Sarkar A, Alamelu D, Aggarwal SK. Determination of thorium and uranium in solution by laser-induced breakdown spectrometry. Appl Opt (2008) 47(31):G58. doi:10.1364/ao.47.000g58
44. Yaroshchyk P, Morrison RJS, Body D, Chadwick BL. Quantitative determination of wear metals in engine oils using laser-induced breakdown spectroscopy: A comparison between liquid jets and static liquids. Spectrochimica Acta B: At Spectrosc (2005) 60(7-8):986–92. doi:10.1016/j.sab.2005.03.011
45. Wang Y, Chen A, Wang Q, Zhang D, Li S, Jiang Y, et al. Study of signal enhancement in collinear femtosecond-nanosecond double-pulse laser-induced breakdown spectroscopy. Opt Laser Tech (2020) 122:105887. doi:10.1016/j.optlastec.2019.105887
46. Wang Q, Chen A, Xu W, Zhang D, Wang Y, Li S, et al. Effect of lens focusing distance on AlO molecular emission from femtosecond laser-induced aluminum plasma in air. Opt Laser Tech (2020) 122:105862. doi:10.1016/j.optlastec.2019.105862
47. Wang Q, Chen A, Qi H, Li S, Jiang Y, Jin M, et al. Femtosecond laser-induced breakdown spectroscopy of a preheated Cu target. Opt Laser Tech (2020) 121:105773. doi:10.1016/j.optlastec.2019.105773
48. Zhang D, Chen A, Wang X, Li S, Wang Y, Sui L, et al. Enhancement mechanism of femtosecond double-pulse laser-induced Cu plasma spectroscopy Opt Laser Technol (2017) 96:117–22. doi:10.1016/j.optlastec.2017.05.010
49. Yang F, Jiang L, Wang S, Cao Z, Liu L, Wang M, et al. Emission enhancement of femtosecond laser-induced breakdown spectroscopy by combining nanoparticle and dual-pulse on crystal SiO2. Opt Laser Technol (2017) 93:194–200. doi:10.1016/j.optlastec.2017.03.016
50. Knopp R, Scherbaum FJ, Kim JI. Laser induced breakdown spectroscopy (LIBS) as an analytical tool for the detection of metal ions in aqueous solutions. Fresenius J Anal Chem (1996) 355(1):16–20. doi:10.1007/s0021663550016
51. Sacchi CA. Laser-induced electric breakdown in water. J Opt Soc Am B (1991) 8(2):337. doi:10.1364/josab.8.000337
52. Shao J, Guo J, Wang Q, Chen A, Jin M. Influence of distance between focusing lens and sample surface on femtosecond laser-induced Cu plasma. Optik (2020) 220:165137. doi:10.1016/j.ijleo.2020.165137
53. Xu W, Chen A, Wang Q, Zhang D, Wang Y, Li S, et al. Generation of high-temperature and low-density plasma with strong spectral intensity by changing the distance between the focusing lens and target surface in femtosecond laser-induced breakdown spectroscopy. J Anal Spectrom (2019) 34(5):1018–25. doi:10.1039/c8ja00359a
54. Li X, Wei W, Wu J, Jia S, Qiu A. The Influence of spot size on the expansion dynamics of nanosecond-laser-produced copper plasmas in atmosphere. J Appl Phys (2013) 113(24):243304. doi:10.1063/1.4812580
55. Wang Y, Chen A, Li S, Ke D, Wang X, Zhang D, et al. Influence of distance between sample surface and focal point on spectral intensity of nanosecond laser-induced silicon plasma in air. AIP Adv (2017) 7(9):095204. doi:10.1063/1.4994983
56. Li SY, Guo FM, Song Y, Chen AM, Yang YJ, Jin MX, et al. Influence of group-velocity-dispersion effects on the propagation of femtosecond laser pulses in air at different pressures. Phys Rev A (Coll Park) (2014) 89(2):023809. doi:10.1103/physreva.89.023809
57. Popov AM, Drozdova AN, Zaytsev SM, Biryukova DI, Zorov NB, Labutin TA, et al. Rapid, direct determination of strontium in natural waters by laser-induced breakdown spectroscopy. J Anal Spectrom (2016) 31(5):1123–30. doi:10.1039/c5ja00468c
Keywords: laser-induced breakdown spectroscopy, femtosecond laser, distance from lens to sample surface, water film, NaCl
Citation: Wang Y, Gao H, Hong Y, Zhang D, Chen A and Jin M (2022) Influence of distance from lens to sample surface on spectral sensitivity of femtosecond laser-induced breakdown spectroscopy with NaCl water film. Front. Phys. 10:964140. doi: 10.3389/fphy.2022.964140
Received: 08 June 2022; Accepted: 28 June 2022;
Published: 14 July 2022.
Edited by:
Yufei Ma, Harbin Institute of Technology, ChinaReviewed by:
James Barefield, Los Alamos National Laboratory (DOE), United StatesCopyright © 2022 Wang, Gao, Hong, Zhang, Chen and Jin. This is an open-access article distributed under the terms of the Creative Commons Attribution License (CC BY). The use, distribution or reproduction in other forums is permitted, provided the original author(s) and the copyright owner(s) are credited and that the original publication in this journal is cited, in accordance with accepted academic practice. No use, distribution or reproduction is permitted which does not comply with these terms.
*Correspondence: Dan Zhang, ZGFuemhhbmcxOUBtYWlscy5qbHUuZWR1LmNu; Anmin Chen, YW1jaGVuQGpsdS5lZHUuY24=
Disclaimer: All claims expressed in this article are solely those of the authors and do not necessarily represent those of their affiliated organizations, or those of the publisher, the editors and the reviewers. Any product that may be evaluated in this article or claim that may be made by its manufacturer is not guaranteed or endorsed by the publisher.
Research integrity at Frontiers
Learn more about the work of our research integrity team to safeguard the quality of each article we publish.