 Liewang Qiu1
 Liangfu Xie
- 1College of Civil Engineering and Architecture, Xinjiang University, Urumqi, China
- 2Xinjiang Civil Engineering Technology Research Center, Urumqi, China
- 3Xinjiang Academy of Architectural Science (Limited Liability Company), Urumqi, China
- 4School of Civil Engineering, Qingdao University of Technology, Qingdao, China
For deep resource exploitation and engineering construction, the mechanical properties of soft and hard interbedded rock masses are important factors impacting engineering stability. Simultaneously, the influence of temperature on the strength of deep rock masses poses a significant obstacle to the exploitation of deep resources and the utilization of underground space. In this paper, the particle flow code (PFC2D) is utilized to establish the thermal-mechanical coupling numerical model of soft and hard interbedded rock masses, and then the uniaxial compression response of soft and hard interbedded rock masses following thermal damage is studied. The displacement and contact force produced by applying temperature, as well as the failure strength, strain, and crack development of the specimen after uniaxial compression is analyzed. The findings reveal that: 1) The peak displacement caused by applied temperature increases first and subsequently decreases with the increase of soft rock thickness ratio (Hs/H), whereas the peak displacement increases linearly with increasing temperature. The peak contact force varies in two stages with the increase of the soft rock thickness ratio (Hs/H), and with the same trends. 2) As the soft rock thickness ratio increases (Hs/H), the number of cracks decreases steadily. When the soft rock thickness ratio Hs/H < 0.5, the relationship curve between vertical strain and crack changes in two stages: the stage of crack development along with the stage of vertical strain gradually increases with crack development. When the thickness ratio of soft rock Hs/H > 0.5, the relationship curve changes in three stages: crack development stage, vertical strain increase stage, and vertical strain increase stage with crack development. 3) When the soft rock thickness ratio Hs/H < 0.5, the failure strength gradually decreases as soft rock thickness increases at T = 100°C, 200°C. The failure strength gradually increases as the soft rock thickness increases in general at T = 400°C. Soft rock thickness ratio Hs/H > 0.5, the failure strength increases with the increase of soft rock thickness at T = 300°C, 400°C. At T = 100°C, 200°C, the tendency of the failure strength changes less.
1 Introduction
Under high temperatures, the strength of deep rock masses is influenced by joints, cracks, and stratification of the rock mass. Temperature is also considered a crucial factor. Scholars at home and abroad have thoroughly studied the influence of temperature on the strength characteristics of various types of rock masses, and theoretical methods and related conclusions have been put forward. A novel double damage thermodynamic model was defined by Liu et al. [1] Changes in thermal properties and mechanical properties of rock during heat treatment were analyzed in terms of thermal conduction, thermal induced deformation, rock mechanical deformation and rock damage. The strength and total loss rate of stone building materials following long-term freezing and thawing have been investigated and analyzed by several scholars [2, 3]. Guo et al. [4] designed a general micromechanical framework. The effective thermoelastic properties of heterogeneous cement-based materials with different saturation are predicted from the aspects of elastic modulus, thermal conductivity and thermal expansion coefficient. Li et al. [5] proposed a numerical model of thermo-hydromechanical coupling failure (THMD) during rock failure that takes into account the mechanical deformation of the rock under a thermo-hydromechanical load, integrating the theory of elastic failure, thermo-elasticity, and seepage mechanics. Gong et al. [6] used discrete element method and double probability Brownian motion simulation to design a thermal conductivity calculation model. The calculation model can accurately and efficiently predict the effective heat conductivity of particle materials composed of homogeneous matrix and conductive interphase around elliptic particles. Vorobiev et al. [7] applied experimental data from both quasi-static and dynamic tests to construct and calibrate a novel thermodynamic model for granite, which was also utilized to assess the influences of both in situ stress and temperature on the extent of damage around subsurface explosions. Khanlari et al. [8, 9] used wet-dry, freeze-thaw, and hot-cold cycle tests to investigate and analyze the various characteristics and strength characteristics of red sandstone under different conditions, and the findings indicated that pore size plays a key role in the resistance of sandstone to freeze-thaw cycling. Through physical experiments and numerical simulations, Liu et al. [10] analyzed the mechanical properties of Strathbogie granite at high-temperature conditions. The results show that the higher the temperature, the lower the compressive strength, while the higher the quartz content, the lower the compressive strength and the stronger fracture. Wang et al. [11] studied the effect of slow and high-speed heating on the thermal cracking of granite by continuous numerical method. The thermal cracking and tensile strength changes of Eibenstock granite under high-speed heating conditions are studied based on laboratory tests. Jin et al. [12] researched the uniaxial strength characteristics and mechanical properties of red sandstone under freeze-thaw at various temperatures. Xu et al. [13, 14] designed a universal micromechanical framework to predict the effective elastic modulus of particle reinforced composites containing elliptic nanoparticles or particles. At the same time, the coupling model is established by the discrete element method and finite element method. The effects of particle and interface physical morphology on the mechanical properties of particle reinforced composites are studied by using this model. In studies on the Mode I and II fracture toughness of rock masses, some scholars have looked at the impact of the two modes on different temperature conditions [15, 16]. Some researchers have looked at how varying temperatures affect the friction angle, cohesiveness, and tensile strength of rock mass [17–20]. Different scholars have studied and analyzed the influence of temperature on geotechnical bodies from a variety of perspectives [21–23], and derived the deformation patterns and characteristics under different influencing factors. Yan et al. [24] combined the 2D discrete heat transfer model with the finite element discrete element method to establish a thermodynamic coupling model to simulate thermal cracking in brittle materials. It provides a powerful tool for solving the heat transfer problem of discontinuous media and the thermal cracking problem of brittle material. Wang et al. [25] used physical experiments and numerical simulations to study the effects of temperature up to 1,000°C on the physical, mechanical, thermal properties, and thermal-mechanical coupling behavior of Eibenstock granite. Weng et al. [26] studied the deterioration characteristics of heterogeneous rocks by thermodynamic coupling. At the same time, based on the combination of damage mechanics and plastic mechanics, a coupling material model is established which takes into account yield, plastic flow law, damage evolution, thermal effect and heterogeneity. Zhang et al. [27] based on meso-damage mechanics, elastic thermodynamics, and Biot seepage mechanics, proposed a mesoscopic thermo-hydro-mechanical-damage coupling model (THM-damage) to analyze the fracturing stimulation of HDR. Through this model, the influence of high temperature on the initial fracture pressure and rock failure pressure is analyzed.
Based on the above analysis, many scholars have studied and analyzed the effects of temperature on the mechanical properties of rocks and other materials from the aspects of theoretical analysis, physical experiment and numerical simulation. The proposed theoretical analysis method and research results provide some references for related engineering construction. Existing research focuses on the study of single rocks. However, there are few research results on the influence of temperature on deep interbedded rock masses, which leads to a lack of reference for related engineering construction. Therefore, it is necessary to conduct relevant research to make up for the deficiency of research on the mechanical properties of deep interbedded rocks at high temperatures. Based on the discrete element method (DEM) can better simulate the discontinuity between particles, joints and other structural characteristics. In this paper, a numerical calculation model of thermal-mechanical coupling is established by the discrete element method. The influence of temperature on the strength characteristics of soft and hard interbedded rock masses is analyzed from the aspects of displacement, contact force, crack development, and failure strength.
2 Discrete element thermodynamic calculation theory
2.1 Control equations
In the thermal calculation module of particle flow code (PFC2D), the calculation method of continuous medium heat conduction is adopted. In deriving the heat transfer equation, the effect of strain changes on temperature is assumed to be negligible. The equation for the thermal conductivity of the continuum is:
where,
where,
2.2 Thermal contact
The linear parallel bond model takes into account the thermal properties of bond contact between particles in the particle flow code (PFC2D). When considering the thermal effect, it is assumed that the temperature change is
where,
Meanwhile, in the calculation of mechanical contact mechanics considering thermal contact, assuming that the particle material has only normal bonding force
where,
2.3 Numerical solution theory
The thermal calculation module represents a network of particle thermal materials for heat storage and thermal contact in the Particle Flow Code (PFC2D). Activated thermal contact conduction generates heat flow, and each particle material serves as a heat reservoir. Each heat source is associated with parameters such as temperature, mass, volume, specific heat, and linear coefficient of thermal expansion of the granular material. The density, dimensions, and assumed shape of the particle material define the mass and volume. Each thermal contact is associated with two heat storage units, and the heat flow is transmitted between the particle materials. Moreover, associated with each thermal contact is the thermal energy and thermal contact model that is responsible for updating the thermal energy during contact based on the continuous calculation of temperature increments. The Particle Flow Code (PFC2D) provides two models of thermal exposure: the thermal null contact model which cannot be modified, and the thermal pipe contact model which can be utilized to generate heat. Three modifiable parameters are defined in the heat pipe contact model are thermal resistance
where,
3 Temperature loading and model verification
3.1 Verification model establishment and parameter selection
The numerical model presented in Figure 1 was established by particle flow code (PFC2D), and the linear parallel bond model is employed for the contact model. The calculation model is 76 mm × 38 mm. Sample particles are randomly generated by controlling the porosity of the sample. The max and min radius of the particles are 0.17 mm and 0.29 mm, respectively. The initial packing state will have a large significance on the subsequent deformation and strength [28–30]. Therefore, to eliminate the influence of the initial state of the model on the subsequent calculation results. In this paper, the non-equilibrium force calculation conditions are put forward to make the sample meet the initial equilibrium state and the specimen particles are evenly distributed. The displacement and contact forces produced by the initial equilibrium calculation stage are eliminated. Simultaneously, the computational model particles were divided into four groups, namely quartz, feldspar, plagioclase, and mica. The thermal expansion coefficients of different minerals are given in Table 1 [31]. The thermal resistance of the activated heat pipe is calculated by the heat conduction rate (Eq. 6). The heat conductivity K is 3.5 Wm−1K−1. And calculated model thermodynamic parameter specific heat of 1015 J kg−1K−1 [32].
where,
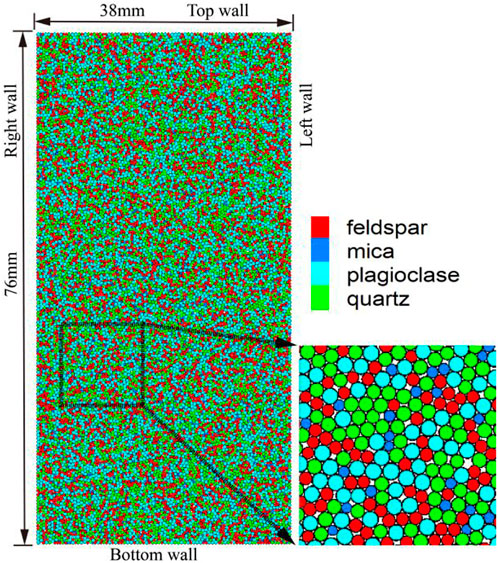
FIGURE 1. Thermal-mechanical coupling verification calculation model.
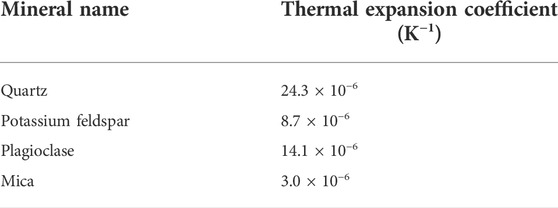
TABLE 1. Thermal expansion coefficient of different minerals.
3.2 Boundary setting and temperature loading method
In the thermal calculation stage, the model boundaries can either adopt a free boundary or a fixed boundary. The temperature can be applied to the specimen via model boundary wall or boundary particles as the heat source, or apply temperature directly to the specimen as a whole.
The wall is used as the heat source to apply temperature to the specimen in the numerical calculation. In this paper, 20°C is the initial temperature of the specimen and the walls. The wall temperature is raised after each temperature calculation equilibrium, and the calculation solution time is 20 s (solve thermal time 20). The numerical test procedure of Zhao et al [33] consists mainly of establishing the initial model, assigning parameters and calculating to reach the static equilibrium, the continuous application of temperature to specimens and the calculation of static equilibrium, as well as a uniaxial numerical test after the temperature loading has been completed. In this paper, to realize the temperature loading and uniaxial numerical test process. The calculation process is categorized into four main stages: establishing the initial model, setting up the contact model, applying temperature, and uniaxial compression, which is illustrated in Figure 2.
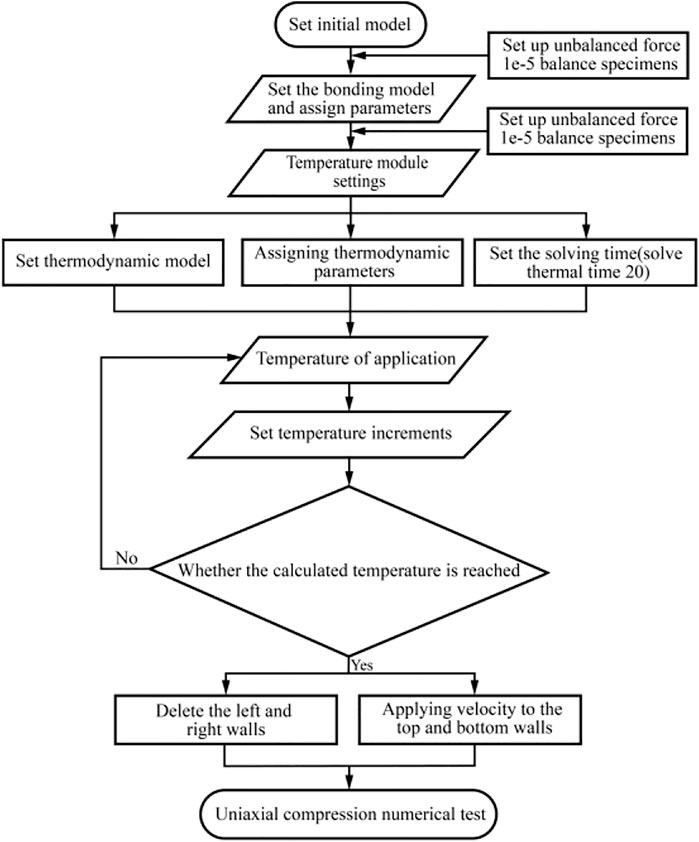
FIGURE 2. Numerical calculation process.
3.3 Model results validation
In the particle flow code (PFC2D), the volume fraction method is employed to generate particle samples with particle sizes ranging from 0.17 to 0.29 mm. The parallel bonding model is selected and the parameters are assigned. The heat source for temperature application is the boundary wall, and the calculation time for each applied temperature is set to 20 s. After the completion of temperature loading, the left and right walls of the sample are deleted, and the acceleration is applied to the top and bottom walls for the uniaxial compression test. Figure 2 depicts the numerical calculation method. Under the assumption that the model size, particle grouping, and rock mechanical properties are essentially the same, the peak strength of the specimen is derived in this paper as shown in Figure 3. The error percentages of failure strength for the four temperature conditions are 3.03%, 9.50%, 13.22% and 5.92% respectively. The changing trend of peak strength obtained in this paper is essentially consistent with that obtained by Zhao et al [33], demonstrating the rationality of the temperature loading method adopted in this paper.
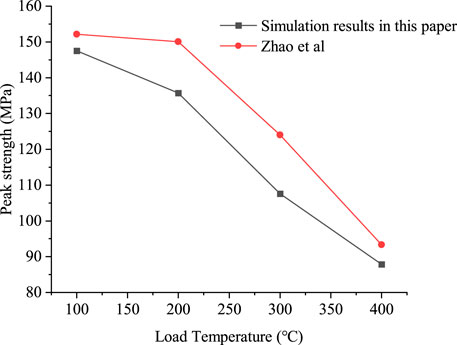
FIGURE 3. Comparison of numerical simulation in this paper with the numerical results of Zhao et al. [33].
4 Working conditions setting and temperature result analysis
The strength of rock is influenced by many factors under the actual formation conditions. The influence of high temperature on deep rock masses will alter its strength characteristics, and the existence of multiple strata will also have an impact on the engineering stability. On this basis, this paper presents a numerical analysis of the strength properties of rock masses with different soft and hard rock thicknesses as well as temperature conditions.
4.1 Simulation condition settings
The strength characteristics of rock masses are investigated under different soft and hard rock thicknesses and different temperatures. In this paper, numerical experiments are performed on sandstone (hard rock) and limestone (soft rock) under different working conditions. Laboratory tests and related numerical tests of sandstone are conducted by Wei Yuan et al., and the experimental results are good. Therefore, this paper makes use of the microscopic parameters of sandstone obtained by Wei Yuan et al. [34], as exhibited in Table 2. Xie et al. [35] experimented with uniaxial and biaxial compression using PFC2D, and accurately calibrated the microscopic parameters of limestone through numerical tests (Table 2). Hence, this group of parameters was used as soft rock (limestone) parameters.
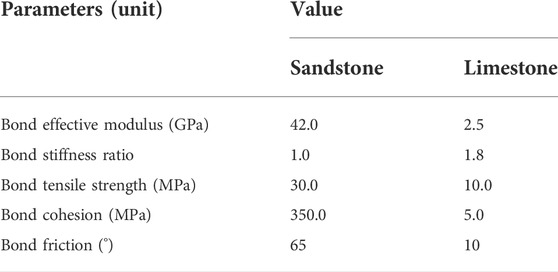
TABLE 2. Different rock microscopic parameters.
The size of the established numerical test model for soft and hard rocks is the same as that of the uniaxial strength model under the verification temperature above, with the size of 76 mm × 38 mm. In the contact model, the linear parallel bond model was used. In order to eliminate the influence of the initial packing state of the specimen on the subsequent calculation results, the specimen was treated as described in the previous section. The specific distribution conditions of soft rock layer thickness (Hs) and hard rock layer thickness (Hh) are illustrated in Table 3. In this paper, the loading temperatures are 100°C, 200°C, 300°C, and 400°C. The boundary conditions are set in the same way as they were before. The left and right walls were employed as heat sources to apply temperature to the sample while maintaining the initial temperature of the top and bottom walls unchanged [36]. The temperature was applied by continuous loading. Each temperature increment was 10°C, and the temperature loading ended when the boundary temperature reached the calculated temperature.
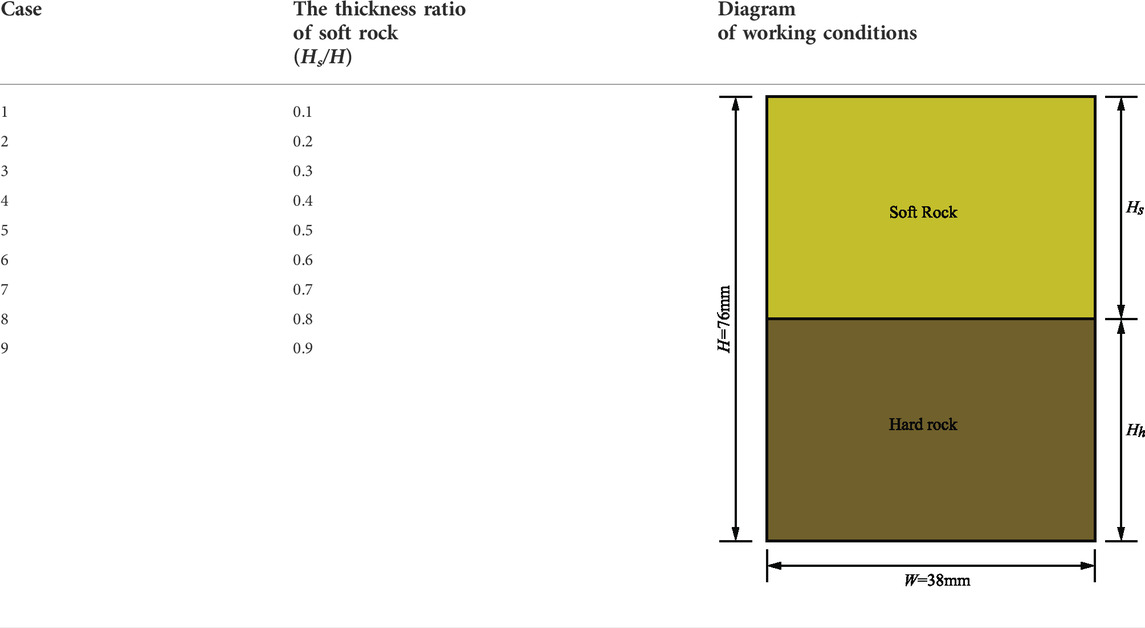
TABLE 3. Working conditions setting of soft and hard rock stratum.
4.2 Analysis of displacement caused by applied temperature
The applied temperature is transmitted through the contact between the walls and particles, as well as between particles. The heat transfer is impacted by the contact thermal resistance between the walls and particles, along with between particles. The displacement of the sample particles is non-uniform due to the change of thermal expansion coefficients of the particles. The peak displacement variation curves generated under different soft rock thicknesses and different temperature conditions are shown in Figure 4.
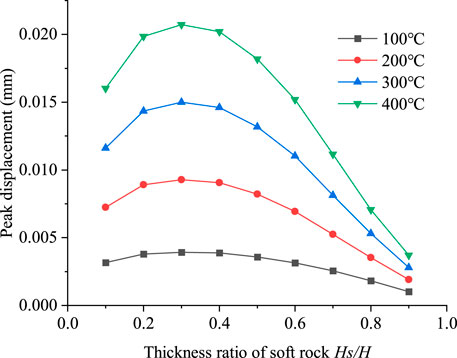
FIGURE 4. Curve of peak displacement and soft rock thickness ratio (Hs/H) under different temperature conditions.
As can be observed from Figure 4, the peak displacement caused by the applied temperature increases first, followed by decreasing with the increase of the thickness ratio of soft rock (Hs/H). As the temperature rises, the changing trend is gradually significant. When the thickness ratio of soft rock is Hs/H = 0.3, the peak displacement has the maximum value under all temperature conditions. When the thickness ratio of soft rock Hs/H < 0.3, the peak displacement increases gradually as the soft rock thickness increases. When the soft rock thickness ratio Hs/H > 0.3, the peak displacement reduces progressively as the soft rock thickness increases. The decrease of peak displacement becomes increasingly significant with the temperature rise. Because of the different thermal expansion properties of the two kinds of rocks, the sample particles will produce different thermal expansions when heated. Therefore, under different soft rock thicknesses conditions, the contact characteristics of particles are different. At the same time, due to the influence of the structural plane, the curve of peak displacement and thickness ratio of soft rock shows a quadratic function. That is, the specimen is less affected by temperature when the thickness of the soft rock is greater, resulting in a smaller change in peak displacement.
The relation curve between peak displacement and loading temperature under different soft rock thickness ratios (Hs/H) is exhibited in Figure 5.
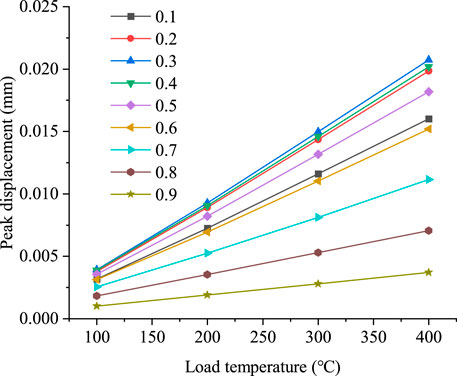
FIGURE 5. The relationship curve between peak displacement and loading temperature under different thickness ratios of soft rock (Hs/H).
As can be seen from Figure 5, the relationship curve between peak displacement and loading temperature changes linearly under the same soft rock thickness ratio. With the rising temperature, the peak displacement increases steadily. When the thickness ratio of soft rock Hs/H < 0.5 (the thickness of soft rock is less than that of hard rock), the linear increase trend of the curve is considerable. That is, when the thickness of hard rock is large, the specimen is greatly influenced by the temperature. The swelling of specimen particles results in increasing displacement of the sample. At the same time, due to the influence of the structural plane on particle expansion, when the thickness of hard rock is larger, the displacement value will be larger.
4.3 Analysis of contact force caused by temperature application
Formula (4) indicates that the normal bonding force between particle materials will be changed towing to the temperature difference. The variation relationship between peak contact force and soft rock thickness ratio (Hs/H) at various temperatures is shown in Figure 6.
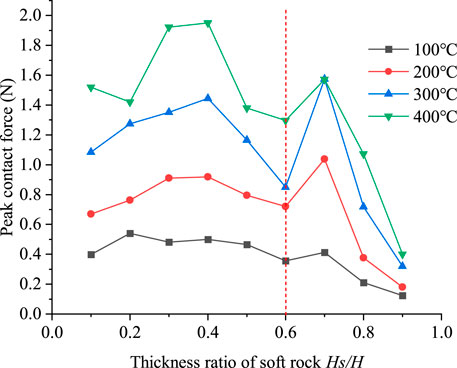
FIGURE 6. Peak contact force versus soft rock thickness ratio (Hs/H) under different temperature conditions.
As can be observed from Figure 6, the peak contact force versus soft rock thickness ratio (Hs/H) curve shows a two-stage variation under different temperature conditions. In the soft rock thickness ratio Hs/H < 0.6, the peak contact force showed an increasing trend and then decreased. When the soft rock thickness ratio Hs/H > 0.6, the peak contact force increases and subsequently drops as soft rock thickness increases. The downward trend is more pronounced at high temperatures. Because of the thermal expansion of particles, the contact force between the sample particles increases with the increase of temperature. The higher the temperature, the higher the contact force of the specimen. Because of the difference in thermal expansion between soft and hard rock, and the influence of structural surface. The peak contact force presents two-stage changes under different conditions.
5 Rock strength analysis
5.1 Cracking and contact force analysis
The temperature has an impact on the specimen because it changes the adhesion of the particle material during the application temperature. This leads to different numbers of cracks and shows different development trends. The crack development trend of the specimen under different failure conditions is shown in Figure 7.
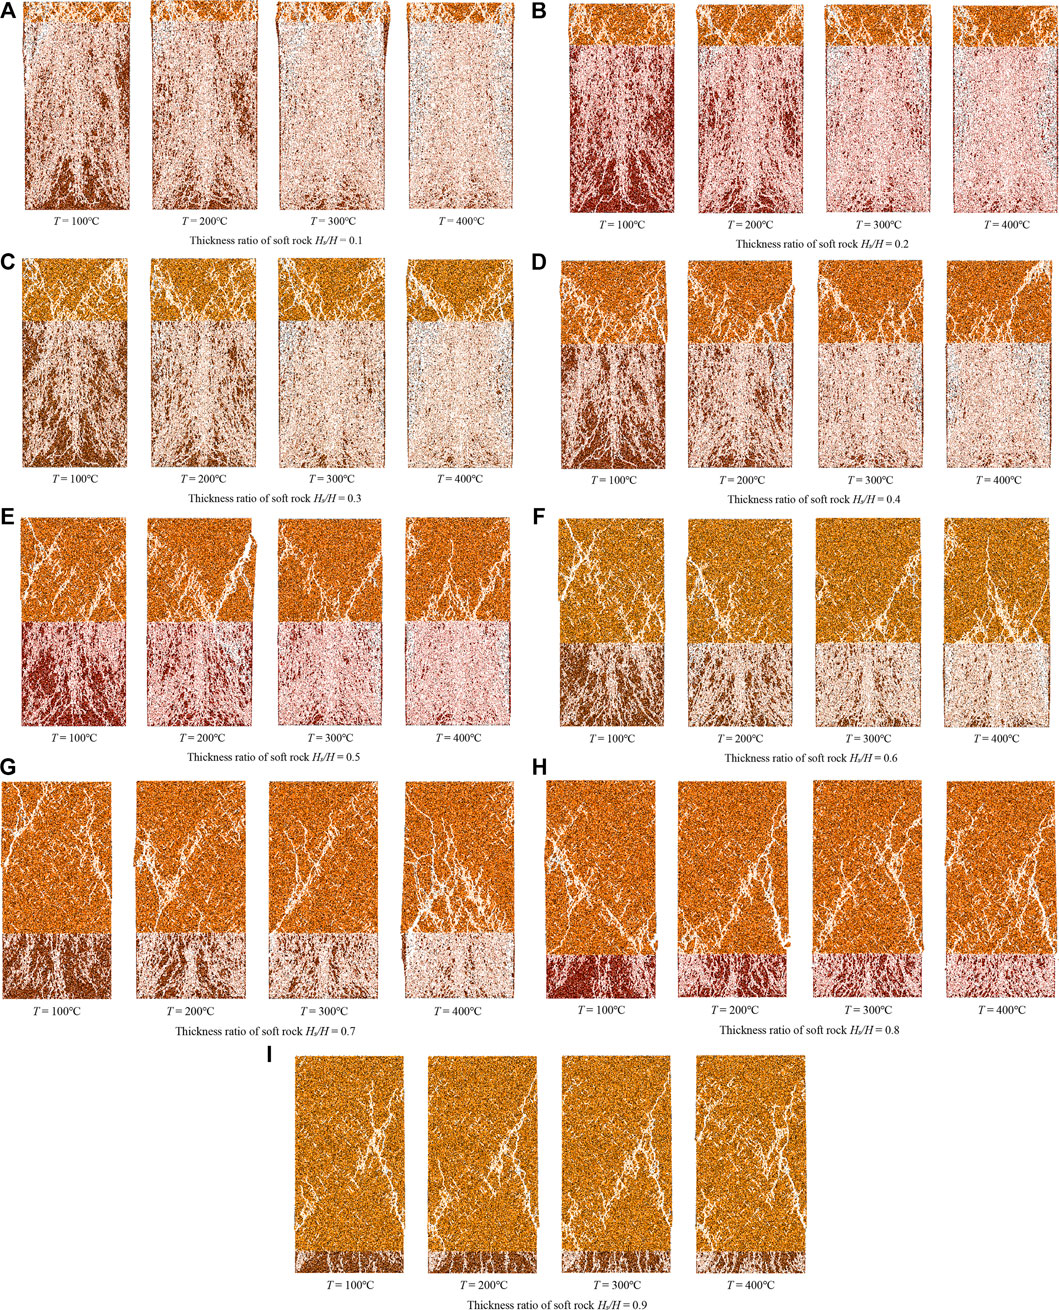
FIGURE 7. Crack development under different working conditions.
According to the above results, the contact characteristics between hard rock particles are greatly affected by temperature, while the contact characteristics between soft rock particles are less affected by temperature. As can be seen from Figure 7 that the number of cracks in the hard rock region gradually increases with the rise of temperature at the same soft-rock thickness ratio. In the process of specimen failure, the crack develops from the structural plane to the soft rock region. The crack develops substantially when the thickness ratio of soft rock is within the range of 0.2–0.8.
Figure 8 depicts the relationship between the number of cracks and the thickness ratio of soft rock (Hs/H).
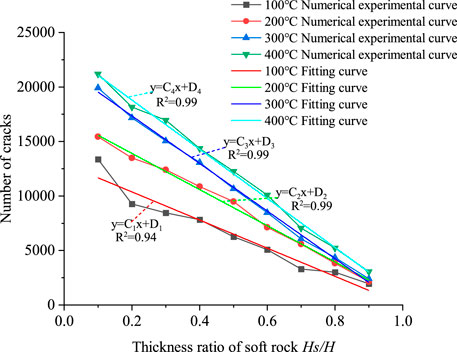
FIGURE 8. Relationship curve between crack number and thickness ratio of soft rock (Hs/H) under different loading temperatures.
As can be seen from Figure 8, the relationship curve between the number of cracks and the soft rock thickness ratio (Hs/H) varies linearly under the same temperature condition. The number of cracks after compression damage of specimens decreases gradually with the rise of the soft rock thickness ratio (Hs/H). And the decreasing trend is evident as the temperature increases. Under different temperature conditions, the number of cracks gradually decreases with the increase of soft rock thickness ratio, which indicates that temperature has the most minimal influence on soft rock. The number of cracks increases with the increase of temperature under the same thickness ratio of soft rock (Hs/H). When the thickness ratio of soft rock is Hs/H = 0.9, the number of cracks is the least, with the smallest difference between the number of cracks. When the thickness of soft rock is much greater in comparison to that of hard rock, the damage degree of the sample is primarily dependent on the strength of soft rock and is less influenced by temperature. According to the previous analysis, the mechanical properties of hard rock are greatly affected by temperature, and more cracks appear in the compressed hard rock area. The number of cracks decreases with the increase of soft rock thickness.
Fitting the numerical test results yields the following relationship between the number of cracks and the thickness ratio of soft rock (Hs/H) after sample failure:
where, the fitting curve parameters of crack number and soft rock thickness ratio (Hs/H) are shown in Table 4. The curve fitting parameters are acquired through approximate calculation under different temperature conditions, and the relationship between the number of cracks and the thickness of soft rock under other temperature conditions is approximately obtained.
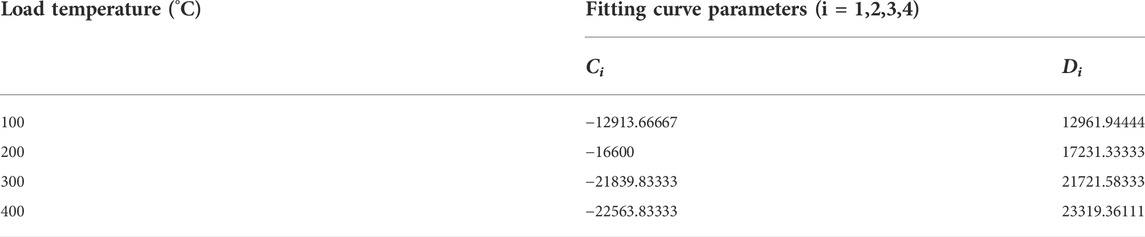
TABLE 4. Fitting curve parameters of number of cracks and soft rock thickness ratio under different temperatures.
The contact force generated under different working conditions varies greatly due to the large difference between soft and hard rock mass affected by temperature. The contact force chains generated after specimen failure are presented in Figure 9.
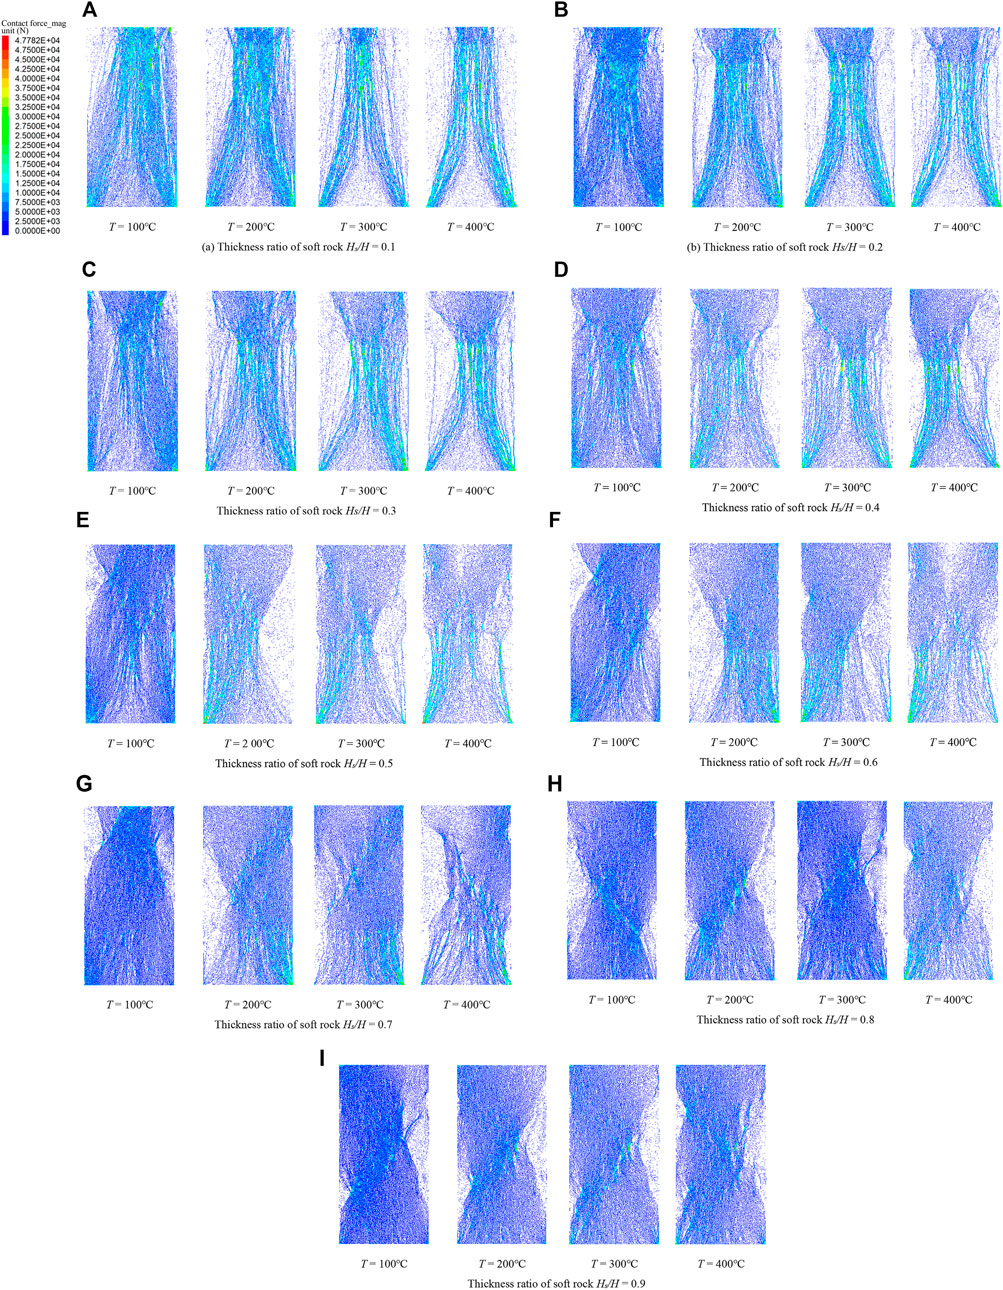
FIGURE 9. Contact force chain after specimen failure under different working conditions.
It can be seen from Figure 9 that the large contact force following specimen failure is primarily concentrated in the crack development area. The temperature has a great influence on the mechanical properties of hard rock particles, and there are many cracks in the initial stage of compression. With the compression, the friction between particles in the crack development area increases, resulting in greater contact force in the hard rock crack zone. Because of the mechanical properties of soft rock, the temperature has little influence on particles. Therefore, with the increase of soft rock thickness, the contact force of the hard rock area gradually weakens.
5.2 Strain analysis
Figure 10 shows that with the same soft-rock thickness ratio, the vertical strain of the specimen decreases gradually with the increase of temperature. When the soft rock thickness ratio Hs/H > 0.5, the slope of vertical strain at each temperature condition falls as the thickness of the soft rock increases. It can be seen from the above that high temperature has a great impact on the mechanical properties of hard rock and reduces the adhesion between particles. Therefore, in the initial stage of compression, the crack develops faster and the vertical strain is smaller. At the same time, the temperature has little effect on the mechanical properties of soft rock. As a result, the relationship curve between vertical strain and crack number under four temperature conditions gradually shows a three-stage change trend with the increase of soft rock thickness.
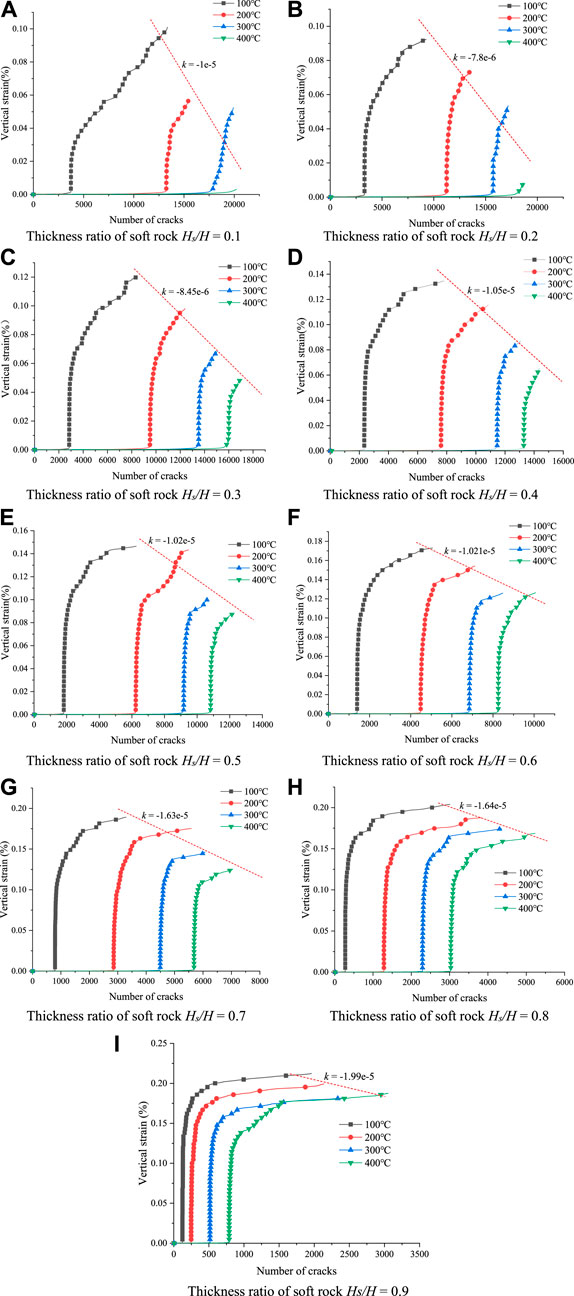
FIGURE 10. Relationship curve between vertical strain and crack number under different thickness ratios of soft rock.
As can be noticed from the relationship between vertical strain and the number of cracks that when the soft rock thickness ratio Hs/H < 0.5 (soft rock thickness is less in contrast to hard rock thickness), the relationship curve follows a two-stage trend. The first stage is the crack development stage. Because the temperature causes the bond between hard rock particles to decrease. The initial compression stage produces a lot of cracks, the vertical strain is small. The second stage is the compression damage stage, in which the vertical strain increases sharply in a short period during the compression of the specimen while a small number of cracks occur.
When the thickness ratio of soft rock Hs/H > 0.5 (the thickness of soft rock is greater in comparison to that of hard rock), the relationship curve presents three-stage changes. The crack development stage is the first stage. At the beginning of compression, because of the thermal effect decreases the bond between hard rock particles, resulting in a large number of cracks with low vertical strain. The second stage is the stage of a sharp increase in vertical strain, where the hard rock begins damaging first during the compression, and the vertical strain increases sharply in a short period with less crack generation. It is accompanied by the formation of cracks in the soft rock region. The third stage is the period of soft rock failure, and the vertical strain increases with the number of cracks until the specimen is destroyed as a whole. When the thickness of soft rock exceeds the thickness of hard rock, the soft rock dominates the specimen’s damage.
5.3 Failure strength analysis
Under the influence of various factors, the strength of the sample changed. The relationship between the failure strength of the specimen and the thickness of the soft rock at different loading temperatures is depicted in Figure 11.
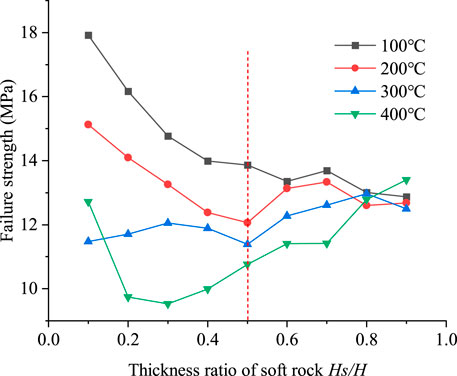
FIGURE 11. The relationship curve between failure strength and soft rock thickness ratio (Hs/H) under different loading temperature.
As can be seen from Figure 11, the failure strength of samples has significant differences with the increase of soft rock thickness under the four temperature conditions. When the soft rock thickness ratio Hs/H < 0.5 (soft rock thickness is less than hard rock thickness), the sample’s failure strength progressively falls as soft rock thickness increases at the loading temperature T = 100°C, 200°C. When the loading temperature is T = 300°C, the failure strength of the sample increases first followed by decreasing with the increase of the soft rock thickness ratio (Hs/H), with the changing trend being small. When the loading temperature is T = 400°C, the failure strength of the sample decreases first and then increases as the soft rock thickness increases. When the soft rock thickness ratio Hs/H > 0.5 (soft rock thickness is greater than hard rock thickness), the failure strength of the specimen progressively decreases with the increase of the soft rock thickness ratio (Hs/H) under the loading temperature T = 100°C, with the decreasing trend being smaller. When the loading temperature is T = 200°C, the failure strength of the specimens displayed a trend of increasing followed by decreasing as the thickness of soft rock increases, and with a small change in the trend. When the loading temperature is T = 300°C and 400°C, the failure strength of the sample increases gradually with the increase of the soft rock thickness ratio (Hs/H).
From the previous analysis, it can be seen that high temperature has a greater impact on the mechanical properties of hard rock, while the mechanical properties of the soft rock are less affected by temperature. Moreover, the high temperature strengthens the mechanical properties of the soft rock particles. As a result, the failure strength gradually decreases between T = 100°C and 200°Cunder the condition of soft rock thickness ratio Hs/H < 0.5. The failure strength of samples increases gradually under different soft rock thicknesses at T = 300°C and 400°C. The higher the temperature, the greater the mechanical reinforcement effect between soft rock particles.
6 Discussion
According to this paper, the analysis is carried out in terms of displacement and contact force changes generated during the application of temperature, as well as strain, crack development, and breaking strength during uniaxial compression. From the findings of the analysis, it is evident that the temperature has a crucial effect on the strength characteristics of the specimens with various soft and hard rock thicknesses.
1) Because the particles in different rock samples have thermal expansion. The higher the temperature, the greater the thermal expansion. The interaction of sample particles at high-temperature conditions is more obvious. Therefore, the peak displacement increases linearly with the increase in temperature. At the same time, the thermal expansion coefficient of different rock samples is different, influenced by the structural surface of soft rock and hard rock. As a result, the relationship curve between peak displacement and soft rock thickness ratio shows a quadratic function. Peak displacement indicates an increasing trend first then decreasing with the increase of soft rock thickness ratio (Hs/H). Due to the enhanced interaction between the particles of the specimen when they are expanded by heat. Resulting in a greater contact force between the specimen particles. At the same time, it is also affected by structural surface and soft rock thickness. With the increase of the soft-rock thickness ratio (Hs/H), the peak contact force changes in two stages, both of which increase and then decrease under four temperature conditions.
2) The number of cracks produced following the specimen damage was linearly related to the thickness of soft rock at four temperature conditions, and the number of cracks gradually decreased. High temperature has a great influence on the bond between hard rock particles, which can lead to cracks in the hard rock region. Under continuous loading, cracks develop into soft rock areas through structural surfaces. Because the initial compression period produces cracks in the hard rock area, there will be more friction during compression. Because of the crack in the hard rock area during the initial compression period, there is more friction in the compression process, which results in a larger contact force in the hard rock area. When the soft rock thickness ratio Hs/H < 0.5, high temperature has a great influence on the adhesion between hard rock particles. As a result, the relationship curve between vertical strain and crack number mainly shows a two-stage trend. When the soft rock thickness ratio Hs/H > 0.5, because the thickness of soft rock is large, the temperature has little effect on the bonding performance between soft rock particles. Therefore, the relationship curve between vertical strain and the number of cracks mainly shows a three-stage trend under diverse temperature conditions.
3) When the thickness ratio of soft rock Hs/H < 0.5, because of the large thickness of hard rock, high temperature weakens the bonding property between hard rock particles. As a result, the failure strength of the sample reduces with the increase in soft rock thickness ratio (Hs/H) at the loading temperature T = 100°C and 200°C. When the loading temperature is T = 300°C and 400°C, the adhesion between soft rock particles is strengthened because of the high temperature. Failure strength of the specimens depicts an increasing trend followed by decreasing with the increase of the soft rock thickness ratio (Hs/H) at T = 300°C. The failure strength shows an overall increasing trend as the soft rock thickness increases at T = 400°C. When the soft rock thickness ratio Hs/H > 0.5, The higher the temperature, the higher the strengthening effect on the bonding properties between soft rock particles. As a result, the failure strength of the specimen gradually increases at T = 300°Cand 400°C.
4) In this paper, the influence of temperature on the strength of soft and hard rock mass with different thicknesses is taken into account. The strength of real strata is affected by several factors. For instance, the influence of weak interlayer, crack and other factors, or the joint action of various influencing factors will have serious effects on the strength of rock mass. In the later stage, further research and analysis will be conducted for different influencing factors.
7 Conclusion
In this paper, the particle flow code (PFC2D) is utilized to establish the uniaxial compression numerical model that takes into account the temperature effect, and the rationality of the uniaxial numerical model is verified. On this basis, different thickness conditions of hard and soft rock are set. The changes of displacement and contact force caused by applied temperature are analyzed, as well as the damage strength, strain and crack number caused by uniaxial compression. The following are the main conclusions:
1) Under varied soft rock thickness ratios (Hs/H), the curve of the relationship between peak displacement and temperature is linear. The peak displacement increases as the temperature rises. In addition, under different temperature conditions, the relationship curve between peak displacement and soft rock thickness ratio (Hs/H) is a quadratic function. The peak displacement first increases followed by decreasing with the increase of soft rock thickness ratio (Hs/H). When the thickness ratio of soft rock Hs/H > 0.5, the peak displacement decreases with increasing temperature. The peak contact force varies in two stages with the increase of soft rock thickness ratio (Hs/H).
2) The relationship curve between the number of cracks and the soft rock thickness ratio (Hs/H) was linear at the same temperature. The number of cracks decreases gradually as the soft rock thickness ratio (Hs/H) increases. The cracks initially appear in the hard rock area. When the thickness of soft rock is greater than that of hard rock, the damage degree of the specimen depends on the strength of soft rock. Furthermore, the functional relationship between the number of cracks and the thickness ratio of soft rock is obtained. The contact force generated after the failure of the sample mainly occurs in the crack development zone of hard rock, and decreases gradually with the increase contact force of soft rock thickness.
3) Under different soft-rock thickness ratios (Hs/H), the vertical strain is small and the number of cracks increases due to thermal effect at the initial stage of the compression test. When the soft rock thickness ratio Hs/H < 0.5, the relationship curve between the vertical strain and crack number shows two stages under the four temperature conditions: the rapid development of cracks in the initial stage and the increasing of vertical strain with the increase of crack number. When the thickness ratio of soft rock Hs/H > 0.5, The relationship curve between the vertical strain and crack number varies in three stages. At the beginning of the compression stage, the number of cracks is larger and the vertical strain is smaller. The vertical strain increases gradually with the increase of cracks. The number of cracks increases rapidly until the specimen is destroyed.
4) When the thickness ratio of soft rock Hs/H < 0.5, the failure strength gradually decreases with the increase of the thickness of soft rock at T = 100°C and 200°C. When the loading temperature is T = 300°C, the sample’s failure strength increases at first, then decreases as the thickness ratio of soft rock increases. The failure strength of the sample decreases first, followed by increasing as the thickness ratio of soft rock increases at T = 400°C. When the thickness ratio of soft rock Hs/H > 0.5, the failure strength of the sample changes little at T = 100°C and 200°C. The sample’s failure strength increases gradually as the thickness ratio of soft rock increases at T = 300°C and 400°C.
Data availability statement
The original contributions presented in the study are included in the article/supplementary material, further inquiries can be directed to the corresponding author.
Author contributions
LQ and LX contributed to conception and design of the study. YQ organized the database. XL and GY performed the statistical analysis. LQ wrote the first draft of the manuscript. LX and YQ wrote sections of the manuscript. All authors contributed to manuscript revision, read, and approved the submitted version.
Funding
This project was supported by the National Natural Science Foundation of China (52068066), Science and technology research and development project of CSCEC (CSCEC-2020-Z-56).
Conflict of interest
LX, XL, was empolyed by Xinjiang Academy of Architectural Science (Limited Liability Company).
The remaining authors declare that the research was conducted in the absence of any commercial or financial relationships that could be construed as a potential conflict of interest.
Publisher’s note
All claims expressed in this article are solely those of the authors and do not necessarily represent those of their affiliated organizations, or those of the publisher, the editors and the reviewers. Any product that may be evaluated in this article, or claim that may be made by its manufacturer, is not guaranteed or endorsed by the publisher.
References
1. Liu L, Ji H, Elsworth D, Zhi S, Lv X, Wang T. Dual-damage constitutive model to define thermal damage in rock. Int J Rock Mech Mining Sci (2020) 126:104185. doi:10.1016/j.ijrmms.2019.104185
2. Jamshidi A, Nikudel MR, Khamehchiyan M. Predicting the long-term durability of building stones against freeze–thaw using a decay function model. Cold Reg Sci Technol (2013) 92:29–36. doi:10.1016/j.coldregions.2013.03.007
3. Ghobadi MH, Babazadeh R. Experimental studies on the effects of cyclic freezing–thawing, salt crystallization, and thermal shock on the physical and mechanical characteristics of selected sandstones. Rock Mech Rock Eng (2015) 48(3):1001–16. doi:10.1007/s00603-014-0609-6
4. Guo W, Han F, Jiang J, Xu W. A micromechanical framework for thermo-elastic properties of multiphase cementitious composites with different saturation. Int J Mech Sci (2022) 224:107313. doi:10.1016/j.ijmecsci.2022.107313
5. Li L, Tang C, Wang S, Yu J. A coupled thermo-hydrologic-mechanical damage model and associated application in a stability analysis on a rock pillar. Tunnelling Underground Space Tech (2013) 34:38–53. doi:10.1016/j.tust.2012.10.003
6. Gong Z, Wu Y, Zhu Z, Wang Y, Liu Z, Xu W. DEM and dual-probability-Brownian motion scheme for thermal conductivity of multiphase granular materials with densely packed non-spherical particles and soft interphase networks. Comp Methods Appl Mech Eng (2020) 372:113372. doi:10.1016/j.cma.2020.113372
7. Vorobiev OY, Morris JP. Modeling dynamic fracture in granite under in situ conditions at high temperatures and pressures. Int J Rock Mech Mining Sci (2019) 113:241–54. doi:10.1016/j.ijrmms.2018.11.007
8. Gholamreza G. K., Sahamieh RZ, Abdilor Y. The effect of freeze–thaw cycles on physical and mechanical properties of Upper Red Formation sandstones, central part of Iran. Arab J Geosci (2015) 8:5991–6001. doi:10.1007/s12517-014-1653-y
9. Khanlari G, Abdilor Y. Influence of wet–dry, freeze–thaw, and heat–cool cycles on the physical and mechanical properties of Upper Red sandstones in central Iran. Bull Eng Geol Environ (2015) 74(4):1287–300. doi:10.1007/s10064-014-0691-8
10. Liu H, Zhang K, Shao S, Ranjith PG. Numerical investigation on the cooling-related mechanical properties of heated Australian Strathbogie granite using Discrete Element Method. Eng Geology (2020) 264:105371. doi:10.1016/j.enggeo.2019.105371
11. Wang F, Konietzky H. Thermal damage evolution of granite under slow and high-speed heating conditions. Comput Geotechnics (2020) 123:103590. doi:10.1016/j.compgeo.2020.103590
12. Jin YU, Chen X, Li H, Zhou J, Cai Y. Effect of freeze-thaw cycles on mechanical properties and permeability of red sandstone under triaxial compression. J Mt Sci (2015) 12(1):218–31. doi:10.1007/s11629-013-2946-4
13. Xu W, Wu F, Jiao Y, Liu M. A general micromechanical framework of effective moduli for the design of nonspherical nano- and micro-particle reinforced composites with interface properties. Mater Des (2017) 127:162–72. doi:10.1016/j.matdes.2017.04.075
14. Xu W, Xu B, Guo F. Elastic properties of particle-reinforced composites containing nonspherical particles of high packing density and interphase: DEM–FEM simulation and micromechanical theory. Comp Methods Appl Mech Eng (2017) 326:122–43. doi:10.1016/j.cma.2017.08.010
15. Abdolghanizadeh K, Hosseini M, Saghafiyazdi M. Effect of freezing temperature and number of freeze–thaw cycles on mode I and mode II fracture toughness of sandstone. Theor Appl Fracture Mech (2020) 105:102428. doi:10.1016/j.tafmec.2019.102428
16. Deng Z, Zhan X, Zeng W, Yang S, Wu J. A degradation model of mode-I fracture toughness of rock under freeze-thaw cycles. Theor Appl Fracture Mech (2021) 115:103073. doi:10.1016/j.tafmec.2021.103073
17. Mu JQ, Pei X, Huang R, Rengers N, Zou X. Degradation characteristics of shear strength of joints in three rock types due to cyclic freezing and thawing. Cold Regions Sci Tech (2017) 138:91–7. doi:10.1016/j.coldregions.2017.03.011
18. Yanlong C, Wu P, Yu Q, Xu G. Effects of freezing and thawing cycle on mechanical properties and stability of soft rock slope. Adv Mater Sci Eng (2017) 2017:1–10. doi:10.1155/2017/3173659
19. Wang L, Ning L, Jilin Q, Yanzhe T, Shuanhai X. A study on the physical index change and triaxial compression test of intact hard rock subjected to freeze-thaw cycles. Cold Regions Sci Tech (2019) 160:39–47. doi:10.1016/j.coldregions.2019.01.001
20. Zhang J, Fu H, Huang Z, Wu Y, Chen W, Shi Y. Experimental study on the tensile strength and failure characteristics of transversely isotropic rocks after freeze-thaw cycles. Cold Regions Sci Tech (2019) 163:68–77. doi:10.1016/j.coldregions.2019.04.006
21. Al-Omari A, Beck K, Brunetaud X, Torok A, Al-Mukhtar M. Critical degree of saturation: A control factor of freeze–thaw damage of porous limestones at castle of chambord, France. Eng Geology (2015) 185:71–80. doi:10.1016/j.enggeo.2014.11.018
22. Huang S, Liu Q, Cheng A, Liu Y. A statistical damage constitutive model under freeze-thaw and loading for rock and its engineering application. Cold Regions Sci Tech (2018) 145:142–50. doi:10.1016/j.coldregions.2017.10.015
23. Zhan J, Wang Q, Zhang W, Shangguan Y, Song S, Chen J. Soil-engineering properties and failure mechanisms of shallow landslides in soft-rock materials. CATENA (2019) 181:104093. doi:10.1016/j.catena.2019.104093
24. Yan C, Jiao Y. A 2D discrete heat transfer model considering the thermal resistance effect of fractures for simulating the thermal cracking of brittle materials. Acta Geotech (2020) 15(5):1303–19. doi:10.1007/s11440-019-00821-x
25. Wang F, Konietzky H, Fruhwirt T, Dai Y. Laboratory testing and numerical simulation of properties and thermal-induced cracking of Eibenstock granite at elevated temperatures. Acta Geotech (2020) 15(8):2259–75. doi:10.1007/s11440-020-00926-8
26. Weng L, Wu Z, Liu Q. Numerical analysis of degradation characteristics for heterogeneous rock under coupled thermomechanical conditions. Int J Geomech (2019) 19(10):04019111. doi:10.1061/(ASCE)GM.1943-5622.0001492
27. Zhang W, Guo T, Qu Z, Wang Z. Research of fracture initiation and propagation in HDR fracturing under thermal stress from meso-damage perspective. Energy (2019) 178:508–21. doi:10.1016/j.energy.2019.04.131
28. Xu W, Wu Y, Gou X. Effective elastic moduli of nonspherical particle-reinforced composites with inhomogeneous interphase considering graded evolutions of elastic modulus and porosity. Comp Methods Appl Mech Eng (2019) 350:535–53. doi:10.1016/j.cma.2019.03.021
29. Ma H, Xu W, Li Y. Random aggregate model for mesoscopic structures and mechanical analysis of fully-graded concrete. Comput Structures (2016) 177:103–13. doi:10.1016/j.compstruc.2016.09.005
30. Zhao J, Li S, Jin W, Zhou X. Shape effects on the random-packing density of tetrahedral particles. Phys Rev E (2012) 86(3):031307. doi:10.1103/PhysRevE.86.031307
31. Fei Y, Ahrens TJ. Thermal expansion. Mineral Physics Crystallography: A Handbook Physical Constants (1995) 2:29–44. doi:10.1029/RF002p0029
32. Wanne TS, Young RP. Bonded-particle modeling of thermally fractured granite. Int J Rock Mech Min Sci (1997) (2008) 45(5):789–99. doi:10.1016/j.ijrmms.2007.09.004
33. Zhao Z. Thermal influence on mechanical properties of granite: A microcracking perspective. Rock Mech Rock Eng (2016) 49(3):747–62. doi:10.1007/s00603-015-0767-1
34. Yuan W, Wang W, Su X, Li J, Li Z, Wen L, et al. Numerical study of the impact mechanism of decoupling charge on blasting-enhanced permeability in low-permeability sandstones. Int J Rock Mech Mining Sci (2018) 106:300–10. doi:10.1016/j.ijrmms.2018.04.029
35. Xie L, Zhu Q, Qin Y, Wang J, Qian J. Study on evolutionary characteristics of toppling deformation of anti-dip bank slope based on energy field. Sustainability (2020) 12(18):7544. doi:10.3390/su12187544
Keywords: Soft and hard interbedded rock masses, thermal-mechanical coupling, failure strength, crack, strain
Citation: Qiu L, Xie L, Qin Y, Liu X and Yu G (2022) Study on strength characteristics of soft and hard rock masses based on thermal-mechanical coupling. Front. Phys. 10:963434. doi: 10.3389/fphy.2022.963434
Received: 12 June 2022; Accepted: 01 August 2022;
Published: 05 September 2022.
Edited by:
Wenxiang Xu, Hohai University, ChinaCopyright © 2022 Qiu, Xie, Qin, Liu and Yu. This is an open-access article distributed under the terms of the Creative Commons Attribution License (CC BY). The use, distribution or reproduction in other forums is permitted, provided the original author(s) and the copyright owner(s) are credited and that the original publication in this journal is cited, in accordance with accepted academic practice. No use, distribution or reproduction is permitted which does not comply with these terms.
*Correspondence: Liangfu Xie, eGllbGlhbmdmdUBvdXRsb29rLmNvbQ==