 Jin-Long Wang1*Xiao-Guang Wu1Zuo-Feng Li2Shu-Qing Xie2Da-Qian Hei3Zi-Hao Zhao1Andrii Rusanov4Yun Zheng1Cong-Bo Li1Tian-Xiao Li1Min Zheng1Xiao-Dong Wang5Da-Jun Ding5Huo-Sheng Ruan5
- 1Department of Nuclear Physics, China Institute of Atomic Energy, Beijing, China
- 2Department of Radiotherapy, Guangzhou Concord Cancer Center, Guangzhou, China
- 3School of Nuclear Science and Technology, Lanzhou University, Lanzhou, China
- 4System Physics, Elekta Limited, Crawley, United Kingdom
- 5Heyou Proton and Heavy Ion Center, Heyou International Hospital, Foshan, China
Prompt gamma ray in proton therapy is the product of a nuclear reaction between a proton and a target. The characteristic energies and intensities of prompt gamma lines can be used to determine the types of elements and their amounts in the target. In several previous experiments, it was demonstrated that no matter how complex the reaction cross-section is, once the energy of the incident proton and the irradiated element are determined, there is a definite linear relationship between the element concentration and the number of gamma-ray photons. However, this linear relationship is difficult to apply to medical imaging, and the nonlinear behavior of hydrogen has not been investigated so far. In this study, this linear relationship is extended to mixed elemental materials including a nonlinear case such as hydrogen, and a universal mathematical form, which is referred to as the prompt gamma spectroscopy retrieval algorithm (PGSRA), is developed. The basic assumption of the PGSRA is that the PGS of the sample material has a relationship with the molar gamma lines of the elements. For carbon and oxygen, this relationship is linear, while for hydrogen, this relationship is nonlinear. As the 2.23 MeV gamma line originates from neutron absorption radiation, the behavior of hydrogen is carefully investigated. The linear and nonlinear relationships are verified using Monte Carlo simulations with different combinations of carbon, oxygen, and hydrogen, such as PMMA, pentanediol, and ethanediol. The PGSRA developed in this work could be the first bridge between PGS and medical imaging.
1 Introduction
Prompt gamma (PG) is being widely investigated in proton and carbon ion therapy because it is a promising solution for online range verification [1, 2]. Different kinds of PG cameras were developed for 1D range measurement [3–6] and 3D image measurement [7–9]. Some of these cameras have already been tested in clinical trials [10, 11]. New PG timing systems, such as fast detectors based on CeBr3 [12] and LaBr3 [13], have been developed in recent years. Zhang et al. developed a new multi-slit PG imaging system based on BGO + SiPM [14, 15].
Monte Carlo code, such as FLUKA [16–18] and Geant4 [19, 20], are powerful tools for particle research. Some new ideas or new designs can be checked by conducting simulations on MC platforms; for example, the time-of-flight (TOF) method was adopted to study PG imaging using Geant4 [21, 22], and a new pixelated PG detector configuration was investigated using FLUKA [23]. Different configurations, such as multi-slit and knife-edge configurations, were compared using Geant4 [24]. Changran et al. investigated the Doppler shift effect for range verification using Geant4 [25, 26]. Recently, a new method for spatiotemporal emission reconstruction PG timing (SER-PGT) was developed and verified by FLUKA [27].
Protons deposit energy in matter through interactions when protons get into tissues during proton therapy. Proton–nuclear interactions involve both elastic and inelastic processes, including nuclear capture and nuclear scattering. For many scattering processes, the tissue nuclei remain intact and are left in an excited energy state. The decay of these excited nuclei typically produces a gamma ray with an energy ranging from 0 MeV to 11 MeV within a few nanoseconds of the proton–nucleus interaction, known as PG emission. The energy spectra of this PG emission depend on the specific nuclear energy states of the excited elemental nuclei, resulting in each element producing a unique spectrum, known as PG spectroscopy. Thus, tissues composed of different elements and elemental concentrations will produce different emission spectra during irradiation [28]. At present, prompt gamma spectroscopy (PGS) can be used to measure the beam range with high resolution [29–31]. In addition, Joost M. Verburg et al. investigated gamma lines and developed a novel optimization algorithm to determine the absolute range with a mean statistical precision of 1.1 mm [5, 11].
Range assessment is not the only capability of PGS. Similar to prompt gamma-ray neutron activation analysis (PGNAA) [32–35], the characteristic energies and intensities of gamma lines can be used to determine the types of elements and their amounts [36, 37]. The major difference between PGS and PGNAA is the kind of particle that initiates the nuclear reaction in the material. Verburg et al. assessed the complex cross-section and total photon yield for different incident proton energies on different target materials [35]. Polf et al. characterized how PG emission from tissue changes as a function of carbon and oxygen concentrations [38, 39]. Paulo Martins et al. demonstrated a feasible technique for proton and ion beam spectroscopy (PIBS) that was capable of determining the elemental concentrations of irradiated tissues during particle therapy [40]. In the experiments of Polf et al. and Paulo Martins et al., a linear relationship was demonstrated between the concentration of irradiated oxygen in tissue-equivalent samples and the total emission of PG radiation during irradiation by fixed energy protons.
Their experimental work demonstrated that no matter how complex the reaction cross-section is, once the energy of the incident proton and the irradiated element are determined, there is a definite relationship between the element content and the number of gamma-ray photons. However, this linear relationship is difficult to apply to medical imaging. These works did not extend the mathematical form of the linear relationship to more than one element. Our goal is to develop an algorithm that could be used to determine the content of multiple elements in the target, not just the concentration, from the PGS data obtained during irradiation. Additionally, a discussion on how to calculate the hydrogen amount as
In the present study, the nonlinear behavior of the
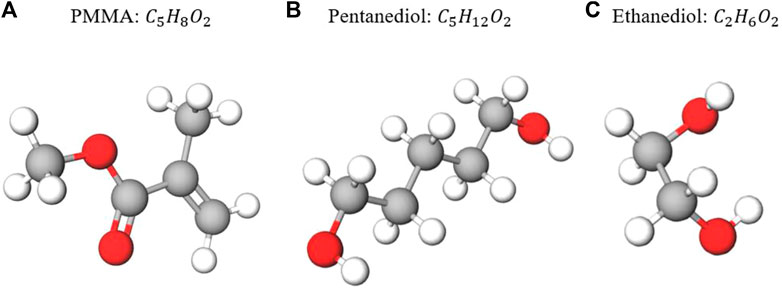
FIGURE 1. Chemical formulas and basic molecular structures of the three targets investigated in our feasibility study. The white spheres represent hydrogen atoms, the red spheres represent oxygen atoms, and the gray spheres represent carbon atoms. From (A–C): PMMA (
2 Materials and methods
2.1 Basic assumptions
From an ideal simulation shown in Figure 2, we used a proton beam to irradiate a PMMA molecule, which yields gamma-ray spectroscopy
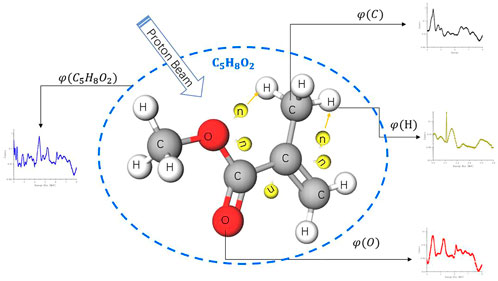
FIGURE 2.
Normally, the unit of
As experiments from Polf et al. and Paulo Martins et al. proved that there is a definite relationship between the element content and the number of gamma-ray photons, we formalize a mathematical model from a phase-only perspective which could be solved by the numerical method in later sections. Thus, we assume a simple relationship, as in Eq. 2.
The spectroscopy of a target molecule is a sum of the spectroscopy from elemental carbon, oxygen, and hydrogen with corresponding weight ratios:
The first two terms of Eq. 3 are the same as Eq. 2, as neutrons for the absorption reaction come from the interaction of
In Eq. 4, the dominant parameter is the number of hydrogen atoms
In Section 3, we will illustrate that for hydrogen, there is only one peak at 2.23 MeV in its PGS, and it does not contribute to the other characteristic gamma lines in the carbon and oxygen spectra. Thus, for an unknown material
In this article, we use
2.2 PGS retrieval algorithm
In a real experiment, one cannot shoot a single molecule target with a single proton. If the target phantom has
The total PG count from a phantom is
where
In fact,
Here,
After both sides of Eq. 4 and Eq. 5 are multiplied by
As shown in Figure 3, the dark curve is the MC simulated PGS from 150 MeV proton beam, which irradiate a PMMA cylinder, and the red points are the peaks in the PGS spectrum. For example, the count at 2 MeV results from the contribution of 4 reactions; the first three reactions come from oxygen and the last one comes from carbon [44]. The count at 4.44 MeV also results from a contribution of both carbon and oxygen. The count at 5.25 MeV only comes from oxygen.
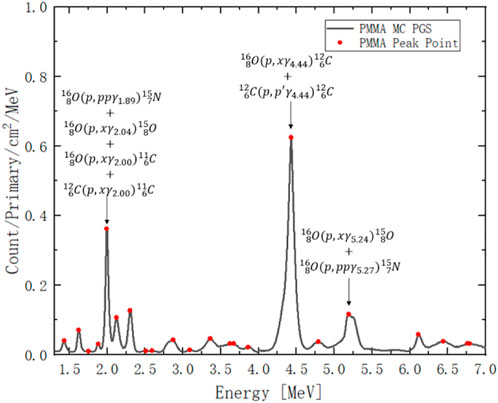
FIGURE 3. PGS spectrum from 150 MeV proton irradiation on PMMA. The red points are peak counts at a given gamma energy. The x-axis is gamma-ray energy channel from 1.3 MeV to 7 MeV. The y-axis is gamma-ray count per incident proton (primary) per unit cylinder surface area per MeV.
There are only two unknown variables
Low: low-energy peaks from 1.5 to 4 MeV.
High: high-energy peaks from 4 to 7 MeV.
Medium-high: peaks from medium energy 2 MeV to high energy 7 MeV.
To obtain a numerical solution, we discretize Eq. 7a:
where matrix
The last step is to solve Eq. 7b and bring coefficients
Now, only
where
Finally, the target elements’ molar amounts
where
This mathematical algorithm is not limited to hydrogen, oxygen, and carbon. It can be extended to sulfur, nitrogen, or any other element. As a feasibility study, the focus of this study is hydrogen, oxygen, and carbon. We attempt to verify this algorithm on three molecules: PMMA (
2.3 Cloud computing
To improve the statistics, the run primary number is
2.4 Neutron distribution
As Eq. 13 described, neutron distribution is the key to the nonlinear solution of PGSRA. First, we must figure out where the neutrons are generated and where the capture reactions take place. We do not consider the hydrogen atoms that are far away from the beam path in lateral direction as they can reduce the accuracy of the algorithm, and nowadays pencil beams are adopted in most proton therapy centers. In practice, we are not likely to put a detector in the target to measure the locations of the
A water phantom with 7 layers ranging from a radii of 2 cm to 14 cm was irradiated by 150 MeV protons, as shown in Figure 4. The USRYIELD card was adopted to score the neutron yield at different energies and time of flight for each radius. In this section, water is chosen as the material for calculation because the human body is mostly composed of water, which can be used as a rough estimation of the neutron distribution. All the calculation results in this section will finally give the recommended radius value of the phantom, which will be used in all the following simulations.
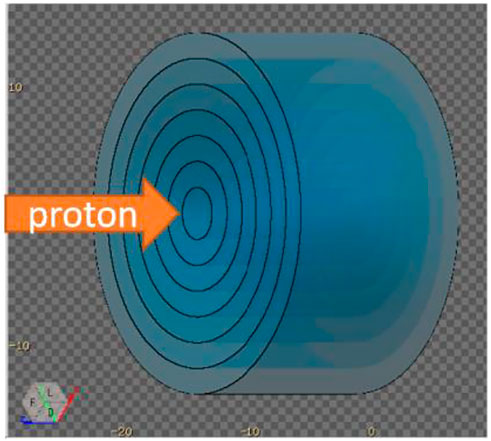
FIGURE 4. A water phantom with 7 layers ranging from a radii of 2 cm to 14 cm. The USRYIELD card was adopted to score the neutron yield between each layer.
For the R = 2 cm layer, we set two slow neutron energy groups: 0–1 eV and 0–1 keV and one fast neutron group: 1 keV–150 MeV. From Figure 5, we can see that high-energy neutrons are generated immediately after the protons reach the target, and the slow neutron (0–1 keV group) yield increases rapidly and peaks at approximately 50 ns. The amount of 0–1 eV neutrons is much smaller than that from 0 to 1 keV neutrons before 200 ns.
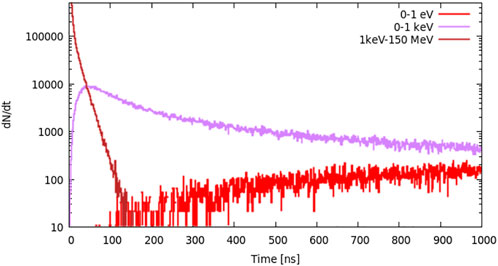
FIGURE 5. Neutron distribution in the layer where R = 2 cm; there are two slow neutron energy groups: 0–1 eV and 0–1 keV and one fast neutron group: 1 keV–150 MeV.
The neutron (0–100 keV group) time-of-flight (TOF) distribution from R = 2 cm to R = 14 cm is shown in Figure 6. The neutron yield increases gradually and peaks at approximately 5 ns when R = 2 cm. As neutrons travel to the outside layers, the peak time increases and the neutron yield decreases. Thus, we choose R = 2 cm as the target radius for the absorption reaction region.
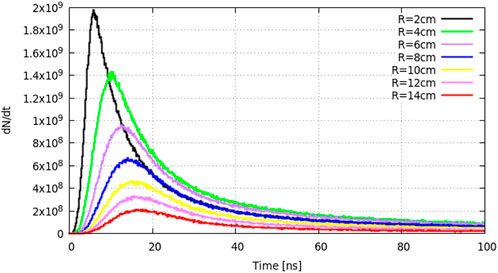
FIGURE 6. Neutron time-of-flight distribution from R = 2 cm to R = 14 cm for the 0–100 keV energy group.
Correspondingly, we score the TOF of gamma photons (0–10 MeV group) in each layer from R = 2 cm to R = 14 cm. As shown in Figure 7, most photons are generated in the center layer R = 2 cm from 0.1 ns to 1.4 ns. The outside layers will start generating photons slightly later, within 0.6 ns, as neutron and other secondary particles require a short time to travel in the lateral direction in the water phantom. Thus, we will set an R = 2 cm slender cylindrical target in the feasibility study in the following simulation work.

FIGURE 7. Time-of-flight distribution from R = 2 cm to R = 14 cm for the 0–10 MeV group.
2.5 MC simulations
To verify the retrieval algorithm in Section 2.2, a group of simulations are performed by using the FLUKA 4.0 code [16–18]. Figure 8 shows the basic simulation setup: one 150 MeV primary proton beam bombards a slender cylindrical target. The primary beam is Gaussian with FWHM = 5 mm and zero momentum spread. The radius of the target is 2 cm. The target length is larger than the beam range, as shown in columns 5 and 6 of Table 1. As the 150 MeV proton range in H0C is 17.98 cm, its length is set to 20 cm to cover a short neutron flight path. The lengths of H1C ∼ H20C and H0O ∼ H20O are set to 18 cm. There is a virtual gamma detector (FLUKA scorer) around the target surface, and all the photons from the target to the scorer are recorded by the USRBDX card in the range of 0–10 MeV with 1,000 energy bins. USRBDX is a virtual detector for a boundary crossing fluence or current estimator [16].
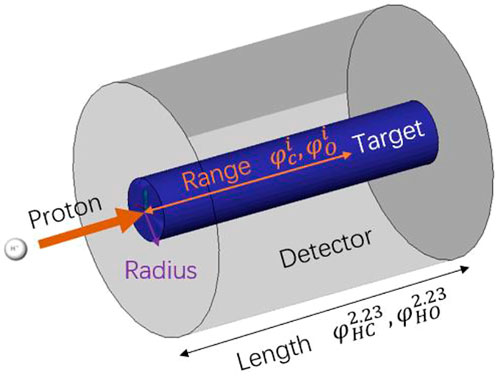
FIGURE 8. Basic simulation setup. A 150-MeV primary proton beam bombards a 2-cm slender blue cylindrical target. Those photons that pass through the interface between the target zone (blue) and detector zone (gray) are recorded by the USRBDX card. The PGS spectra of
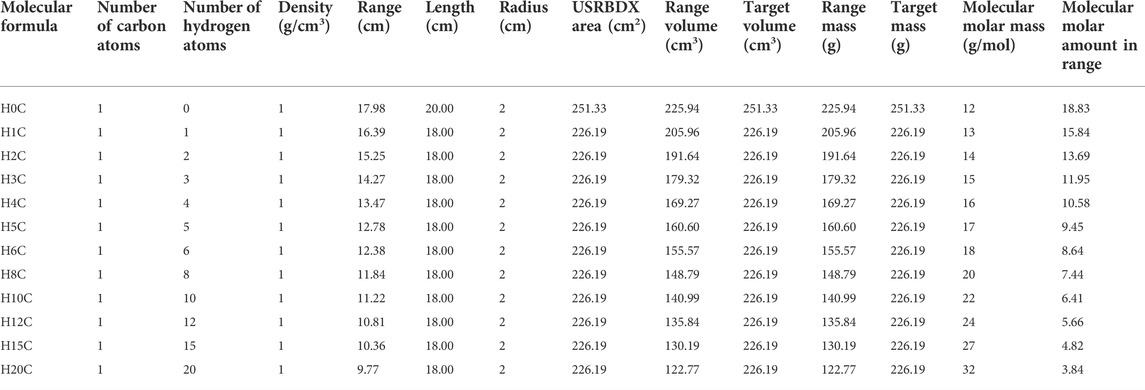
TABLE 1. Parameters for the MC simulation of combinations of carbon and hydrogen.
This setup means that we ignore the energy difference of proton travel through the target in the beam direction. In fact, the proton beam enters and loses energy as it travels. Nuclei near the front face of the target experience higher energy protons than those toward the back of the target. The reaction probabilities change as a function of energy, so different reactions dominate at different depths in the target. We divide the 20-cm water target into five layers and obtain the gamma spectra at different depths by using 5 USRBDXs, each of which is 4 cm. As shown in Figure 9, the characteristic gamma counts increase as protons travel along the target and suddenly decrease in layer 5. However, for this feasibility study, we only adopt one USRBDX to score spectra for the full length to simplify the calculation.
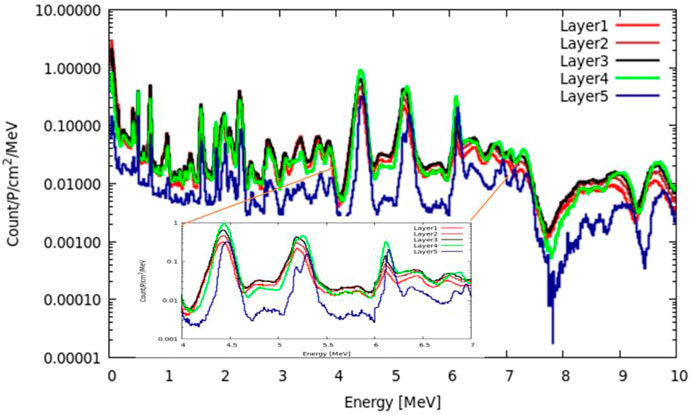
FIGURE 9. Gamma spectra at different depths.
2.5.1 FLUKA setup for elemental molar PGS
The first group of simulations is completed to obtain molar spectroscopy results for carbon, oxygen, and hydrogen. Thus, two series of sample materials are simulated with 150 MeV proton irradiation. One series is hydrocarbons:
As the focus of this study is not on range measurement, we measure the range by scoring proton fluence along the beam axis when 90% of the primary protons have stopped in the target. The USRBIN card, with a Cartesian grid of
Not all the material in the target can contribute to the PGS spectra scored by USRBDX. After all the protons stop in the target, there will be no gamma radiation directly induced by protons. However, after reaching the longitudinal depth of the proton range, there are still neutrons from previous reactions along the beam path that can produce 2.23 MeV gamma rays. Thus, to calculate the molar PGS values for carbon and oxygen, we should use the range mass; for hydrogen, we should use the target mass. All the discussed parameters are shown in Tables 1, 2.
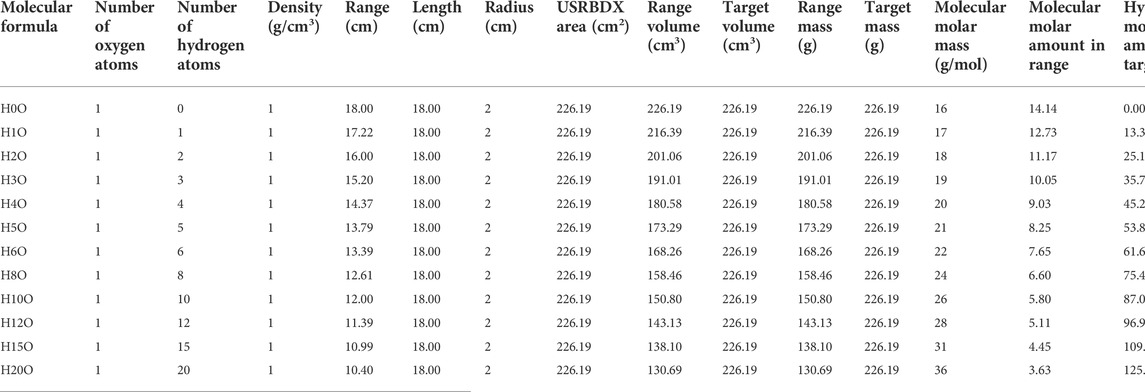
TABLE 2. Parameters for the MC simulation of combinations of oxygen and hydrogen.
2.5.2 FLUKA setup for PGS
The second group of simulations is completed to obtain full energy PGS spectra of PMMA, pentanediol, and ethanediol. The configuration is similar to that in Section 2.5.1. The only difference is that the COMPOUND card simultaneously contains carbon, oxygen, and hydrogen with different numbers of atoms. In addition, their densities are set to
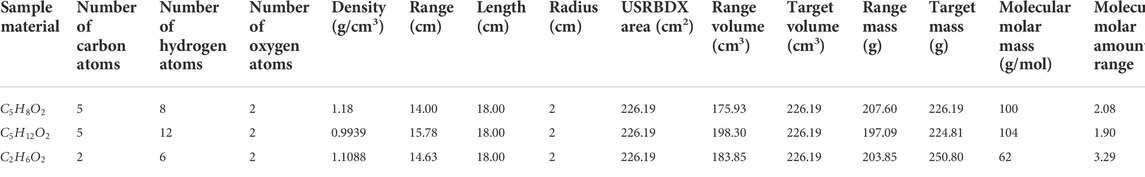
TABLE 3. Parameters for the MC simulation of the sample materials.
3 Results
3.1 Element molar PGS
The PGS spectra from combinations of carbon and hydrogen bombarded by 150 MeV protons are shown in Figure 10. Characteristic gamma lines from carbon decrease with an increasing number of hydrogen atoms, while 2.23 MeV gamma lines increase as the number of hydrogen atoms increases. This is consistent with our intuition that the carbon concentration is high in low hydrogen combinations and the opposite for hydrogen concentrations. In addition, 2.23 MeV lines from neutron absorption radiation will be investigated carefully later.
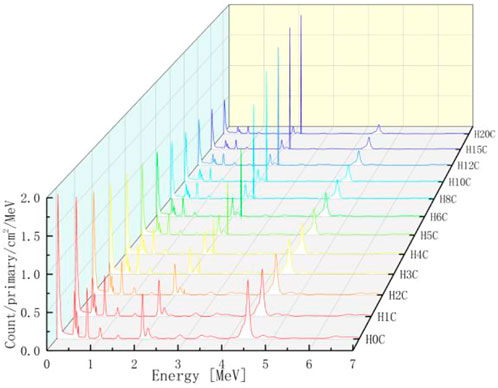
FIGURE 10. PGS spectra from combinations of carbon and hydrogen.
For every combination, the beam range, which decreases as the number of hydrogen atoms increases, is measured. As shown in Table 1, the range volume (column 9) and range mass (column 11) can be determined. Then, the PGS spectra are divided by the molecular molar amount in range, which is the molar PGS, as presented in Figure 11. The difference is that the characteristic gamma lines from carbon come to the same level in molar PGS except at an energy of approximately 2.23 MeV.
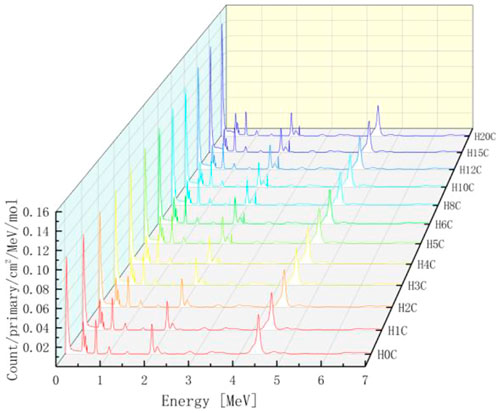
FIGURE 11. Molar PGS from combinations of carbon and hydrogen. The characteristic gamma lines from carbon come to the same level in molar PGS except at an energy of approximately 2.23 MeV.
We extract peak gamma lines (2.00 MeV, 2.23 MeV, 2.88 MeV, 4.44 MeV, and 6.12 MeV) from Figures 10, 11. As shown on the left of Figure 12, the 2.00 MeV, 2.88 MeV, 4.44 MeV, and 6.12 MeV counts have a linear relationship with carbon concentration, which has been confirmed by experiments [40]. As shown on the right of Figure 12, the molar count curves of these selected gamma lines are at the same level except for 2.23 MeV. Thus, the basic assumption of a linear carbon term in Eq. 2 is reasonable.
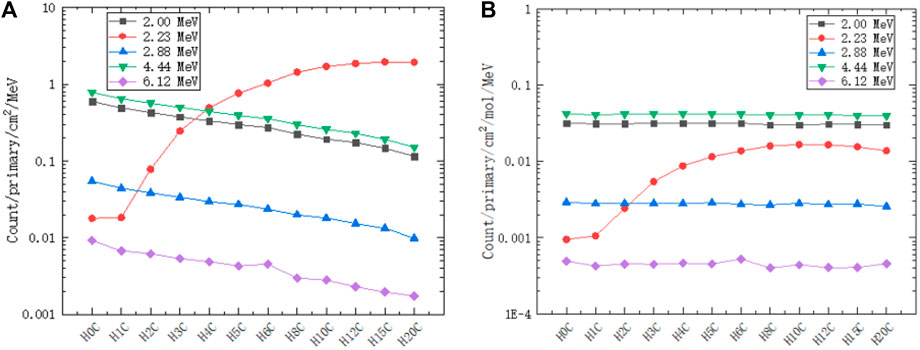
FIGURE 12. Counts of selected gamma lines from PGS in different hydrogen and carbon combinations: 2.00 MeV, 2.23 MeV, 2.88 MeV, 4.44 MeV, and 6.12 MeV. (A) The counts of 2.00 MeV, 2.88 MeV, 4.44 MeV, and 6.12 MeV have a linear relationship with the carbon concentration. (B) The molar count curves of these selected gamma lines are at the same level except for 2.23 MeV.
The molar count standard errors are
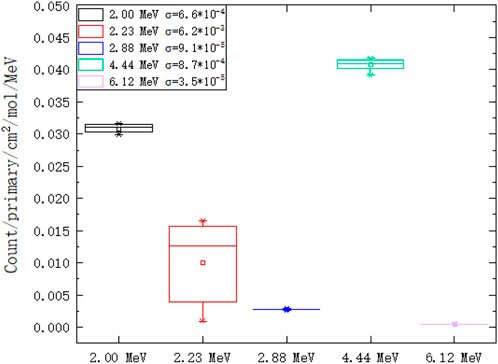
FIGURE 13. Count standard error for different gamma lines.
The PGS spectra from combinations of oxygen and hydrogen bombarded by 150 MeV protons are analyzed by the same pattern as carbon in the supplementary material. While their behavior is similar to those from the combinations of carbon and hydrogen, their characteristic gamma lines are more abundant.
Thus, matrix
3.2 Molar PG count for hydrogen
We extract the 2.23 MeV gamma count from the PGS spectrum described in Section 3.1. Additionally, we obtain a nonlinear PG count per mol hydrogen with its number of atoms, as the dotted lines show in Figure 14. The count increases when the number of hydrogen atoms is 1–12 and then decreases. The reason is that the more hydrogens there are in a molecule, the higher the neutron absorption probability. However, the presence of too many hydrogens will stop neutrons from going further to the next molecule as energy is lost in the collision of neutrons and hydrogen nuclei. Thus, hydrogen appears to be an enhancer in low hydrogen combinations. The ratio term
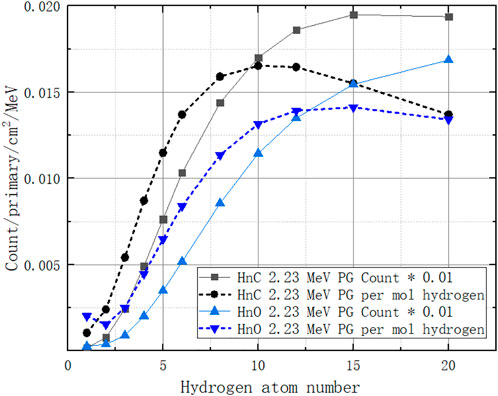
FIGURE 14. Nonlinear PG count per mol hydrogen in different combinations.
Here, we must choose a molar PG count values to assign
3.3 Element amount measurement by PGSRA
Figure 15 shows the full energy PGS spectra of PMMA, pentanediol, and ethanediol detected by the USRBDX card during the virtual MC simulations described in Section 2.5.2. To solve Eq. 10, we select the peak points to assign matrix
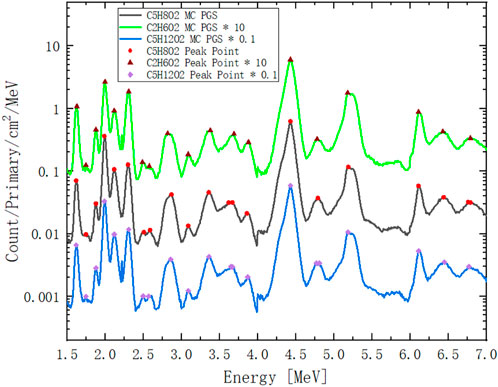
FIGURE 15. Full energy PGS spectra of PMMA (
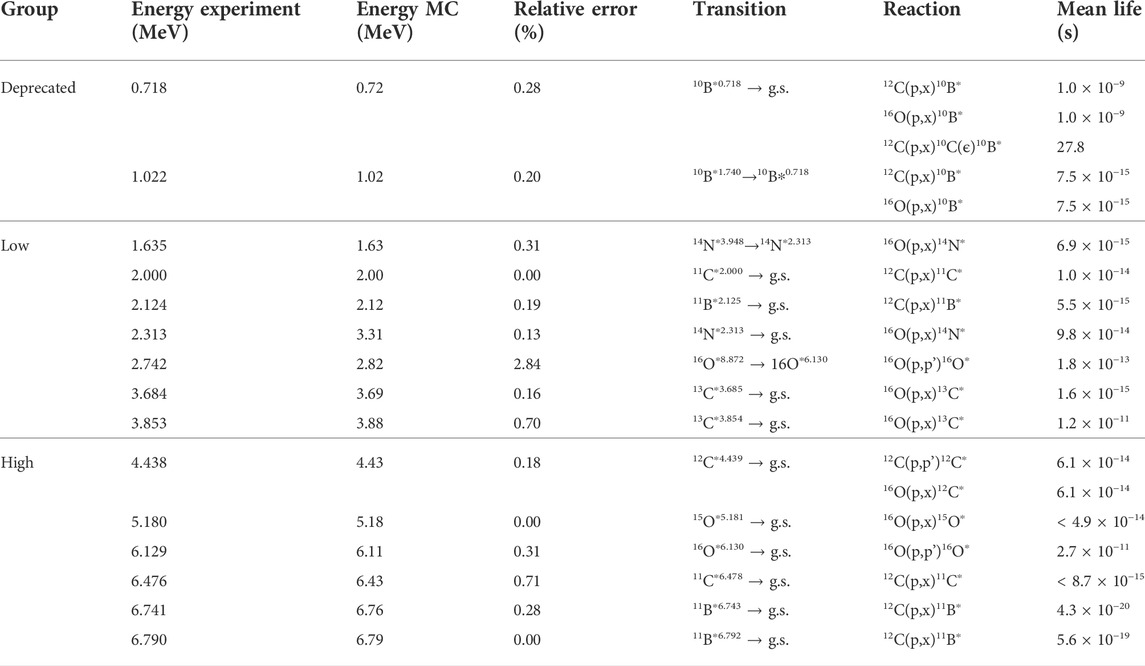
TABLE 4. Gamma lines from proton reactions with oxygen and carbon. Experimental energy data, transition, reaction, and mean life from accelerated particle interactions [50].
These points are sorted into different groups:
All: All peaks from 1.5 to 7 MeV; energies lower than 1.5 MeV are not chosen in this algorithm, as some of these energies are not generated from pure (p,γ) channels. These gamma lines are not as distinct as those from Compton scattering.
Low: Low-energy peaks from 1.5 to 4 MeV.
High: High-energy peaks from 4 to 7 MeV.
Medium-high: Peaks of medium energy 2 MeV to high energy 7 MeV.
Every group will include at least 3 points, and thus, the numerical solution of the element molar amount matrix
Table 5 lists the numerical solutions of
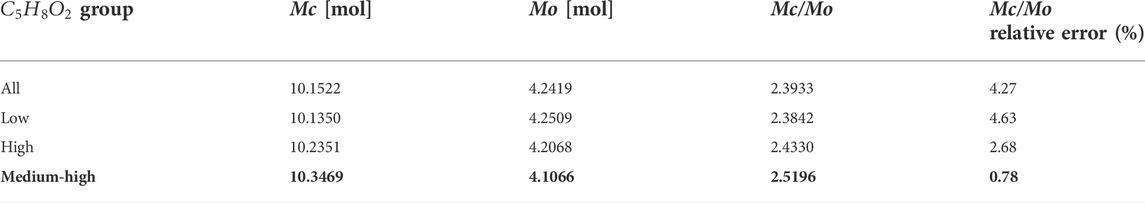
TABLE 5. Numeric solution of PMMA.
For pentanediol, the best solution is the high-energy group, as shown in Table 6 with bold number.

TABLE 6. Numeric solution of pentanediol.
For ethanediol, the best solution is the high-energy group, as shown in Table 7 with bold number.
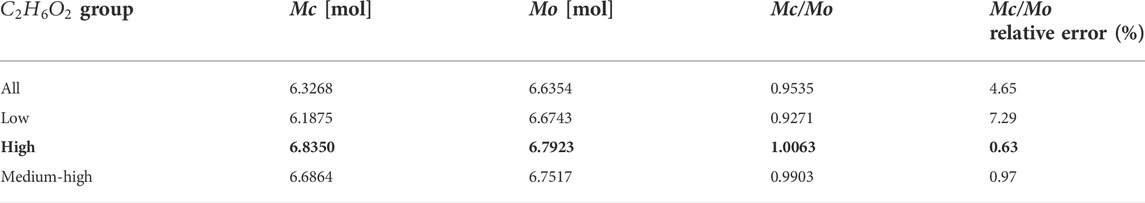
TABLE 7. Numeric solution of ethanediol.
Medium- and high-energy points are preferred for the numerical solution as these characteristic gamma lines are more distinct. Now,
The results are summarized in Table 8 and compared with the MC setup values from Table 3. The relative errors of the hydrogen molar amount are approximately 10% for PMMA and pentanediol. However, their densities are consistent with the setup values, and the relative errors are smaller than 2%. On the contrary, for ethanediol, the hydrogen amount relative error is only 0.87%, and the density relative error is 3.31%. This is because although there is a high atom number of hydrogen, it has much lower weight than carbon and oxygen in materials. Thus, density error is dominated by carbon and oxygen.
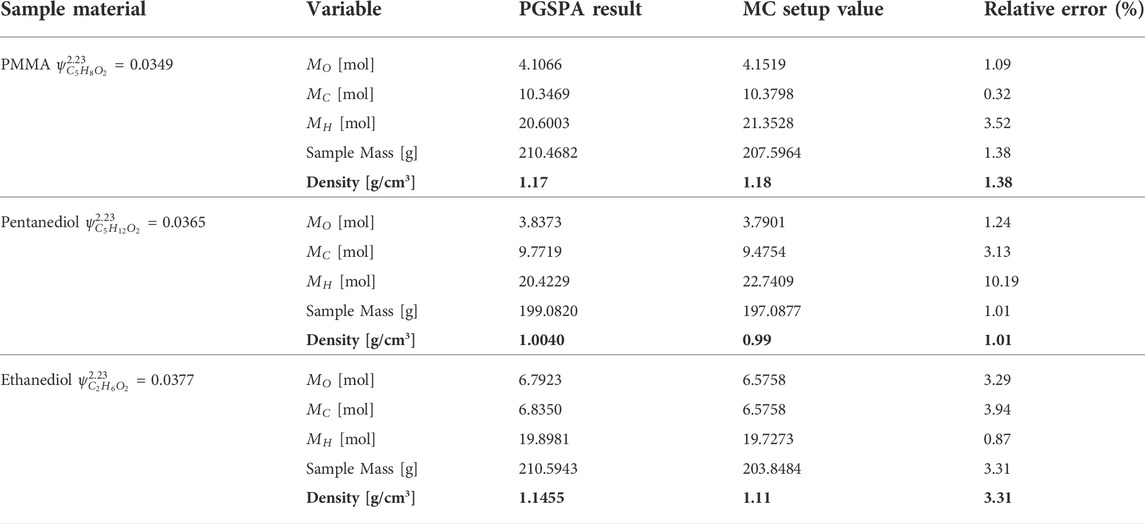
TABLE 8. Numeric solutions of
Finally, we can recalculate the PMMA PGS spectra by using our retrieval algorithm, as shown in Figure 16. In the 0–4 MeV range, all peaks are consistent with the MC curve. In the 4–7 MeV range, only the peak at 6.1 MeV shows a small deviation from the MC curve. The retrieved PGSs of pentanediol and ethanediol are in supplementary material.
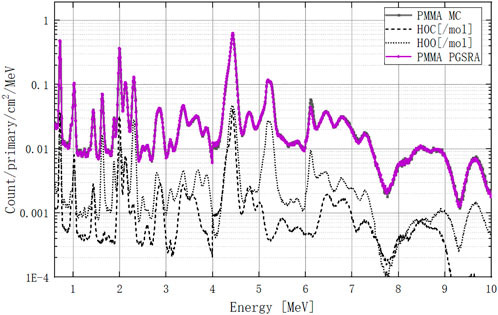
FIGURE 16. PMMA PGS spectrum at 0–10 MeV calculated by the retrieval algorithm. The dark curve is the MC-calculated PGS spectrum, and the purple curve is the PGSRA-calculated PGS spectrum. The carbon and oxygen molar PGS spectra are dashed lines.
4 Discussion and conclusion
Based on 3 basic assumptions: 1) the sample material has a relationship with its element molar gamma lines in PG spectroscopy, 2) for carbon and oxygen, this relationship is linear, and 3) for hydrogen, this relationship is nonlinear and is based on a neutron absorption reaction; an element retrieval algorithm is developed in the present study. The challenge is how to carefully deal with the nonlinear hydrogen 2.23 MeV gamma count. A series of simulations confirm that these assumptions are reasonable. The mathematical formulas of the PGSRA theoretically explain the linear relationship of the gamma count and element concentration detected by Polf et al. [38, 39] and Paulo et al. [40].
The element amount has been successfully calculated by the PGSRA for the following three sample materials: PMMA, pentanediol, and ethanediol. The relative errors of carbon and oxygen are smaller than 4% for all the sample materials. The relative error of hydrogen, based on its nonlinear behavior, is approximately 10%. In addition, the relative errors of the sample density are smaller than 3.5% for all the sample materials. This new retrieval algorithm is valid for predicting the element amount and density in an unknown material. It may be the first bridge between PGS and medical imaging.
Data availability statement
The original contributions presented in the study are included in the article. PGS spectra from combinations of oxygen and hydrogen, retrieval pentanediol PGS and ethanediol PGS are in the Supplementary Material, and further inquiries can be directed to the corresponding author.
Author contributions
J-L Wang: theoretical model, FLUKA simulation, and manuscript. X-GW: physics, prompt gamma analysis, and review. Z-FL: medical physics, proton therapy, and review. S-QX: data analysis. Z-HZ: detector. D-QH: neutron adsorption. AR: cloud computing. YZ: detector and physics. CL: nuclear reaction. T-XL: detector and physics. MZ: gamma detector. D-JD: data process. X-DW: data process. H-SR: data process.
Funding
This work was supported by the National Natural Science Foundation of China (U1932209, 11975315, U1867210, and 11905134), the Leading Innovation Project under Grant (LC192209000701 and LC202309000201), and the Continuous Basic Scientific Research Project (BJ20002501 and WDJC-2019-13).
Acknowledgments
We sincerely thank Michael Lu from Mevion Medical Systems for many discussions about imaging devices in proton therapy. The authors also kindly acknowledge the great support from AWS engineers Yin-Xiang Li and Xiao-Chen Ye.
Conflict of interest
A Rusanov was employed by the company Elekta Limited.
The remaining authors declare that the research was conducted in the absence of any commercial or financial relationships that could be construed as a potential conflict of interest.
Publisher’s note
All claims expressed in this article are solely those of the authors and do not necessarily represent those of their affiliated organizations, or those of the publisher, the editors, and the reviewers. Any product that may be evaluated in this article, or claim that may be made by its manufacturer, is not guaranteed or endorsed by the publisher.
Supplementary material
The Supplementary Material for this article can be found online at: https://www.frontiersin.org/articles/10.3389/fphy.2022.961162/full#supplementary-material
References
1. MacKay RI. Image guidance for proton therapy. Clin Oncol (2018) 30(5):293–8. doi:10.1016/j.clon.2018.02.004
2. Knopf AC, Lomax A. In vivo proton range verification: A review. Phys Med Biol (2013) 58(15):R131–60. doi:10.1088/0031-9155/58/15/R131
3. Min CH, Kim CH, Youn MY, Kim JW. Prompt gamma measurements for locating the dose falloff region in the proton therapy. Appl Phys Lett (2006) 89(18):183517. doi:10.1063/1.2378561
4. Smeets J, Roellinghoff F, Prieels D, Stichelbaut F, Benilov A, Busca P, et al. Prompt gamma imaging with a slit camera for real-time range control in proton therapy. Phys Med Biol (2012) 57(11):3371–405. doi:10.1088/0031-9155/57/11/3371
5. Verburg JM, Seco J. Proton range verification through prompt gamma-ray spectroscopy. Phys Med Biol (2014) 59(23):7089–106. doi:10.1088/0031-9155/59/23/7089
6. Golnik C, Hueso-González F, Müller A, Dendooven P, Enghardt W, Fiedler F, et al. Range assessment in particle therapy based on prompt γ-ray timing measurements. Phys Med Biol (2014) 59(18):5399–422. doi:10.1088/0031-9155/59/18/5399
7. Draeger E, Mackin D, Peterson S, Chen H, Avery S, Beddar S, et al. 3D prompt gamma imaging for proton beam range verification. Phys Med Biol (2018) 63(3):035019. doi:10.1088/1361-6560/aaa203
8. Roellinghoff F, Richard MH, Chevallier M, Constanzo J, Dauvergne D, Freud N, et al. Design of a Compton camera for 3D prompt-γ imaging during ion beam therapy. Nucl Instr Methods Phys Res Section A: Acc Spectrometers Detectors Associated Equipment (2011) 648(Suppl. 1):20–3. doi:10.1016/j.nima.2011.01.069
9. Panaino CMV, Mackay RI, Kirkby KJ, Taylor MJ. A new method to reconstruct in 3D the emission position of the prompt gamma rays following proton beam irradiation. Sci Rep (2019) 9(1):18820–13. doi:10.1038/s41598-019-55349-7
10. Richter C, Pausch G, Barczyk S, Priegnitz M, Keitz I, Thiele J, et al. First clinical application of a prompt gamma based in vivo proton range verification system. Radiother Oncol (2016) 118(2):232–7. doi:10.1016/j.radonc.2016.01.004
11. Hueso-González F, Rabe M, Ruggieri TA, Bortfeld T, Verburg JM. A full-scale clinical prototype for proton range verification using prompt gamma-ray spectroscopy. Phys Med Biol (2018) 63(18):185019. doi:10.1088/1361-6560/aad513
12. Werner T, Berthold J, Hueso-González F, Koegler T, Petzoldt J, Roemer K, et al. Processing of prompt gamma-ray timing data for proton range measurements at a clinical beam delivery. Phys Med Biol (2019) 64(10):105023. doi:10.1088/1361-6560/ab176d
13. Marcatili S, Collot J, Curtoni S, Dauvergne D, Hostachy JY, Koumeir C, et al. Ultra-fast prompt gamma detection in single proton counting regime for range monitoring in particle therapy. Phys Med Biol (2020) 65(24):245033–17. doi:10.1088/1361-6560/ab7a6c
14. Zhang H, Fan P, Xu T, Wei Q, Ma T, Liu Y, et al. Scintillation detector design study for prompt gamma photon detection in proton therapy monitoring. In: 2017 IEEE Nucl Sci Symp Med Imaging Conf NSS/MIC 2017 - Conf Proc; 21-28 October 2017; Atlanta, GA, USA (2018). p. 7–10. doi:10.1109/NSSMIC.2017.8532768
15. Zhang H, Fan P, Wang S, Xia Y, Xu T, Wei Q, et al. Design and performance evaluation of a BGO + SiPM detector for high-energy prompt gamma imaging in proton therapy monitoring. IEEE Trans Radiat Plasma Med Sci (2020) 4(2):184–93. doi:10.1109/trpms.2020.2972594
16. Ferrari A, Sala PR, Fassò A, Ranft J. Fluka: A multi-particle transport code. MC-INFN (2005) 773. doi:10.2172/877507
17. Böhlen TT, Cerutti F, Chin MPW, Fasso A, Ferrari A, Ortega P, et al. The FLUKA Code: Developments and challenges for high energy and medical applications. Nucl Data Sheets (2014) 120:211–4. doi:10.1016/j.nds.2014.07.049
18. Kozłowska WS, Böhlen TT, Cuccagna C, Ferrari A, Fracchiolla F, Magro G, et al. FLUKA particle therapy tool for Monte Carlo independent calculation of scanned proton and carbon ion beam therapy. Phys Med Biol (2019) 64(7):075012. doi:10.1088/1361-6560/ab02cb
19. Agostinelli S, Allison J, Amako K, Apostolakis J, Araujo H, Arce P, et al. GEANT4 - a simulation toolkit. Nucl Instr Methods Phys Res Section A: Acc Spectrometers Detectors Associated Equipment (2003) 506(3):250–303. doi:10.1016/S0168-9002(03)01368-8
20. Cirrone GAP, Cuttone G, Di Rosa F, Mazzaglia SE, Romano F, Attili A, et al. Hadrontherapy: An open source, Geant4-based application for proton-ion therapy studies. In: IEEE Nuclear Science Symposium Conference Record; 24 October 2009 - 01 November 2009; Orlando, FL, USA (2009). p. 4186–9. doi:10.1109/NSSMIC.2009.5402279
21. Biegun AK, Seravalli E, Lopes PC, Rinaldi I, Pinto M, Oxley DC, et al. Time-of-flight neutron rejection to improve prompt gamma imaging for proton range verification: A simulation study. Phys Med Biol (2012) 57(20):6429–44. doi:10.1088/0031-9155/57/20/6429
22. Jacquet M, Marcatili S, Gallin-Martel ML, Bouly JL, Boursier Y, Dauvergne D, et al. A time-of-flight-based reconstruction for real-time prompt-gamma imaging in proton therapy. Phys Med Biol (2021) 66(13):135003–32. doi:10.1088/1361-6560/ac03ca
23. Wang JL, Cruz LA, Lu M. Pixelated prompt gamma imaging detector for online measurement of proton beam: Monte Carlo feasibility study by FLUKA. Radiat Detect Technol Methods (2018) 2(1):4. doi:10.1007/s41605-017-0032-0
24. Park JH, Kim SH, Ku Y, Lee HS, Kim CH, Shin DH, et al. Comparison of knife-edge and multi-slit camera for proton beam range verification by Monte Carlo simulation. Nucl Eng Technol (2019) 51(2):533–8. doi:10.1016/j.net.2018.10.002
25. Han Y, Tang X, Geng C, Shu D, Gong C, Zhang X, et al. Investigation of in vivo beam range verification in carbon ion therapy using the Doppler shift effect of prompt gamma: A Monte Carlo simulation study. Radiat Phys Chem Oxf Engl 1993 (2019) 162:72–81. doi:10.1016/j.radphyschem.2019.04.036
26. Geng C, Han Y, Tang X, Shu D, Gong C, Altieri S. Evaluation of using the Doppler shift effect of prompt gamma for measuring the carbon ion range in vivo for heterogeneous phantoms. Nucl Instr Methods Phys Res Section A: Acc Spectrometers Detectors Associated Equipment (2020) 959:163439. doi:10.1016/j.nima.2020.163439
27. Pennazio F, Ferrero V, D’Onghia G, Garbolino S, Fiorina E, Marti Villarreal OA, et al. Proton therapy monitoring: Spatiotemporal emission reconstruction with prompt gamma timing and implementation with PET detectors. Phys Med Biol (2022) 67(6):065005. doi:10.1088/1361-6560/ac5765
28. Polf JC, Peterson S, Ciangaru G, Gillin M, Beddar S. Prompt gamma-ray emission from biological tissues during proton irradiation: A preliminary study. Phys Med Biol (2009) 54(3):731–43. doi:10.1088/0031-9155/54/3/017
29. Testa M, Bajard M, Chevallier M, Dauvergne D, Freud N, Henriquet P, et al. Real-time monitoring of the Bragg-peak position in ion therapy by means of single photon detection. Radiat Environ Biophys (2010) 49(3):337–43. doi:10.1007/s00411-010-0276-2
30. Pausch G, Petzoldt J, Berthel M, Enghardt W, Fiedler F, Golnik C, et al. Scintillator-based high-throughput fast timing spectroscopy for real-time range verification in particle therapy. IEEE Trans Nucl Sci (2016) 63(2):664–72. doi:10.1109/TNS.2016.2527822
31. Dal Bello R, Magalhaes Martins P, Brons S, Hermann G, Kihm T, Seimetz M, et al. Prompt gamma spectroscopy for absolute range verification of 12C ions at synchrotron-based facilities. Phys Med Biol (2020) 65(9):095010. doi:10.1088/1361-6560/ab7973
32. Idiri Z, Mazrou H, Amokrane A, Bedek S. Characterization of an Am-Be PGNAA set-up developed for in situ liquid analysis: Application to domestic waste water and industrial liquid effluents analysis. Nucl Instr Methods Phys Res Section B: Beam Interactions Mater Atoms (2010) 268(2):213–8. doi:10.1016/j.nimb.2009.10.185
33. Khelifi R, Amokrane A, Bode P. Detection limits of pollutants in water for PGNAA using Am-Be source. Nucl Instr Methods Phys Res Section B: Beam Interactions Mater Atoms (2007) 262(2):329–32. doi:10.1016/j.nimb.2007.06.003
34. Naqvi AA, Garwan MA, Nagadi MM, Maslehuddin M, Al-Amoudi OSB, Khateeb-ur-Rehman . Non-destructive analysis of chlorine in fly ash cement concrete. Nucl Instr Methods Phys Res Section A: Acc Spectrometers Detectors Associated Equipment (2009) 607(2):446–50. doi:10.1016/j.nima.2009.05.192
35. Naqvi AA, Al-Matouq FA, Khiari FZ, Khateeb-Ur-Rehman , Gondal MA, Isab AA. Optimization of a prompt gamma setup for analysis of environmental samples. J Radioanal Nucl Chem (2013) 296:215–21. doi:10.1007/s10967-012-2045-y
36. Jia W, Cheng C, Hei D, Ling Y, Wang H, Chen D. Method for correcting thermal neutron self-shielding effect for aqueous bulk sample analysis by PGNAA technique. J Radioanal Nucl Chem (2015) 304(3):1133–7. doi:10.1007/s10967-015-3962-3
37. Hei D, Jiang Z, Jia W, Cheng C, Wang H, Li J, et al. The background influence of cadmium detection in saline water using PGNAA technique. J Radioanal Nucl Chem (2016) 310(1):27–31. doi:10.1007/s10967-016-4767-8
38. Verburg JM, Shih HA, Seco J. Simulation of prompt gamma-ray emission during proton radiotherapy. Phys Med Biol (2012) 57(17):5459–72. doi:10.1088/0031-9155/57/17/5459
39. Polf JC, Panthi R, Mackin DS, McCleskey M, Saastamoinen A, Roeder BT, et al. Measurement of characteristic prompt gamma rays emitted from oxygen and carbon in tissue-equivalent samples during proton beam irradiation. Phys Med Biol (2013) 58(17):5821–31. doi:10.1088/0031-9155/58/17/5821
40. Magalhaes Martins P, Dal Bello R, Ackermann B, Brons S, Hermann G, Kihm T, et al. PIBS: Proton and ion beam spectroscopy for in vivo measurements of oxygen, carbon, and calcium concentrations in the human body. Sci Rep (2020) 10(1):7007–14. doi:10.1038/s41598-020-63215-0
41. Jia W, Cheng C, Shan Q, Hei D, Ling Y, Zhang Y, et al. Study on the elements detection and its correction in aqueous solution. Nucl Instr Methods Phys Res Section B: Beam Interactions Mater Atoms (2015) 342:240–3. doi:10.1016/j.nimb.2014.10.010
42. Jeyasugiththan J, Camero JN, Symons J, Jones P, Buffler A, Geduld D, et al. Measuring prompt gamma-ray emissions from elements found in tissue during passive-beam proton therapy. Biomed Phys Eng Express (2021) 7(2):025013. doi:10.1088/2057-1976/abe33d
43. Ahdida C, Bozzato D, Calzolari D, Cerutti F, Charitonidis N, Cimmino A, et al. New capabilities of the FLUKA multi-purpose code. Front Phys (2022) 9:1–14. doi:10.3389/fphy.2021.788253
44. Clegg AB, Foley KJ, Salmon GL, Segel RE. Gamma radiation from the medium energy proton bombardment of lithium, beryllium, boron, carbon and nitrogen. Proc Phys Soc (1961) 78(5):681–94. doi:10.1088/0370-1328/78/5/305
45. Lee HR, Kim SH, Park JH, Jung WG, Lim H, Kim CH. Prototype system for proton beam range measurement based on gamma electron vertex imaging. Nucl Instr Methods Phys Res Section A: Acc Spectrometers Detectors Associated Equipment (2017) 857:82–97. doi:10.1016/j.nima.2017.03.022
46. Park JH, Kim SH, Ku Y, Kim CH, Lee HR, Jeong JH, et al. Multi-slit prompt-gamma camera for locating of distal dose falloff in proton therapy. Nucl Eng Technol (2019) 51(5):1406–16. doi:10.1016/j.net.2019.03.008
47. Wang JL, Cruz LA, Wu QB, Wang Q, Wei Y, Wang HK. Radiation shielding design of a compact single-room proton therapy based on synchrotron. Nucl Sci Tech (2020) 31(1):1. doi:10.1007/s41365-019-0712-1
48. Otuka N, Dupont E, Semkova V, Pritychenko B, Blokhin AI, Aikawa M, et al. Toward more complete and accurate experimental nuclear reaction data library (EXFOR) - international collaboration between nuclear reaction data centres (NRDC). New York: Nuclear Data Sheets (2014). p. 8–11.
Keywords: proton therapy, prompt gamma spectroscopy retrieval algorithm, Monte Carlo, FLUKA, neutron absorption
Citation: Wang J-L, Wu X-G, Li Z-F, Xie S-Q, Hei D-Q, Zhao Z-H, Rusanov A, Zheng Y, Li C-B, Li T-X, Zheng M, Wang X-D, Ding D-J and Ruan H-S (2022) Prompt gamma spectroscopy retrieval algorithm for element and density measurements accelerated by cloud computing. Front. Phys. 10:961162. doi: 10.3389/fphy.2022.961162
Received: 04 June 2022; Accepted: 12 October 2022;
Published: 10 November 2022.
Edited by:
Angelo Schiavi, Sapienza University of Rome, ItalyReviewed by:
Elisa Fiorina, National Institute of Nuclear Physics of Turin, ItalyDominique Thers, IMT Atlantique Bretagne-Pays de la Loire, France
Copyright © 2022 Wang, Wu, Li, Xie, Hei, Zhao, Rusanov, Zheng, Li, Li, Zheng, Wang, Ding and Ruan. This is an open-access article distributed under the terms of the Creative Commons Attribution License (CC BY). The use, distribution or reproduction in other forums is permitted, provided the original author(s) and the copyright owner(s) are credited and that the original publication in this journal is cited, in accordance with accepted academic practice. No use, distribution or reproduction is permitted which does not comply with these terms.
*Correspondence: Jin-Long Wang, 1561103570@qq.com