 Diana Bachiller-Perea1,2*
 Mingming Zhang1,2
 Celeste Fleta3David Quirion3Daniela Bassignana3Faustino Gómez4Consuelo Guardiola3*
- 1Université Paris-Saclay, CNRS/IN2P3, IJCLab, Orsay, France
- 2Université Paris Cité, IJCLab, Orsay, France
- 3Centro Nacional de Microelectrónica (IMB-CNM, CSIC), Barcelona, Spain
- 4Departamento de Física de Partículas, Universidad de Santiago de Compostela, Santiago de Compostela, Spain
The present work shows the performance of two new large microdosimetry multi-array systems having two different configurations, namely, pixel and strip configurations. They cover radiation sensitive areas of 1.9 cm × 0.1 cm and 5.1 cm × 0.1 cm, respectively. The microdosimetry systems are based on arrays of 3D cylindrical silicon microdetectors. The 3D electrodes are etched inside the silicon and have a 25 μm diameter and a 20 μm depth. Each of these unit cells is completely isolated from the others and has a well defined 3D micrometric radiation sensitive volume. The pixel-type device consists of 25 × 5 independent silicon-based detectors (500 in total), each one connected to a readout channel, collecting information in 2D in the transverse planes to the particle beam direction. The distance between the individual detectors (pitch) is 200 μm in the horizontal axis and 250 μm in the vertical one. In the case of the strip-type system, we have 512 “columns” (or strips) of 10 detectors per column. Each strip is connected to a readout channel, giving us information in one dimension, but with better statistics than a single pixel. In this system, both the horizontal and vertical pitches are 100 μm.
Both systems have been tested under proton beam irradiations at different energies between 6 and 24 MeV to obtain the corresponding microdosimetry quantities along the Bragg peak and distal edge. The measurements were performed at the Accélérateur Linéaire et Tandem à Orsay (ALTO, France). The microdosimetry quantities were successfully obtained with spatial resolutions of 100–250 μm. Experimental results were compared to Monte Carlo simulations and an overall good agreement was found. Both microdetector systems showed a good microdosimetry performance under clinical-equivalent fluence rates along distances of several centimeters. This work demonstrates that the two new systems having different configurations can be clinically used as microdosimeters for measuring the lineal energy distributions in the context of proton therapy treatments. Additionally, they could be also used for beam monitoring.
1 Introduction
Proton therapy achieves very high dose conformity around the target due to its depth-dose distribution, allowing to focus more precisely on the tumor than with conventional radiotherapy and offering a better protection of the organs at risk. This is particularly critical for certain types of radio resistant tumors, such as hypoxic tumors, tumors localized near organs at risk or sensitive structures (e.g., the spinal cord), and pediatric cancers [1]. In proton therapy, the radiation biological effect (RBEf) depends on the microscopic pattern of the ionization density. This is measured in terms of the lineal energy (y), which is defined as the ratio between the deposited energy by a single event into a given microscopic volume and the corresponding mean chord length
Microdosimetry has been traditionally based on Tissue Equivalent Proportional Counters (TEPCs) [8]. However, they have some shortcomings, e.g., they are usually distorted by the detector wall effect, need bulky readout electronics, and require a gas and high-power supply. New mini-TEPCs have improved performance over the last few years [9], but they are still point-like and suffer pile-up effects under therapeutic fluence rates. Other alternatives are based on diamond detectors since they are close to tissue equivalent and exhibit radiation hardness [10, 11]. Finally, silicon-based radiation detectors have demonstrated their reliability over the last years by overcoming some of the aforementioned disadvantages. However, they have some limitations, e.g., they are not water equivalent, the micro technology processes associated with the manufacturing are complex, and their performance can be deteriorated due to radiation damage over time. Moreover, corrections considering both material conversion and charge collection efficiency are mandatory. Even so, they have contributed significantly to the microdosimetry characterization in the recent years. In particular, Rosenfeld et al. have created several generations of silicon microdosimeters and worked extensively in the field [12]. The first four generations of their microdetectors were based on planar PN junctions with implantations on the front face or with the silicon boundaries etched around those junctions to create well defined sensitive volumes [12]. These devices were tested in hadron therapy beams successfully [13–15]. A fifth generation of “mushroom” microdosimeters [15–17] was produced in 2018 at SINTEF (Norway) with a 3D SOI structure similar to the pioneered by the IMB-CNM group [18, 19]. Nevertheless, in the “mushroom” detector, the linear array of sensitive volumes are electrically connected in parallel and read out jointly, thus missing the transversal spatial resolution within the active area (
Taking into account the state of the art presented here, there is still room to create new microdosimeters aiming to work for quality assurance (QA), for example by 1) increasing the spatial resolution along the transverse plane relative to the beam direction for obtaining 2D LET maps, 2) tailoring readout electronics to deal with therapeutic fluence rates without saturation effects, 3) developing large microdosimeters (∼ centimeters) to assess the microdosimetry distributions in relevant clinical volumes and critical areas, e.g., organs-at-risk and penumbras, 4) performing acquisition tools for real-time analysis, etc. In response to these challenges and in pursuit of improving the existing silicon-based microdosimeters, we have already designed, manufactured and characterized the first microdosimeters facing some of these issues, namely an array and a multi-array covering 2 mm × 2 mm and 0.4 mm × 12 cm radiation sensitive areas, respectively [22]. They have allowed us to characterize the microdosimetric quantities in both transverse and longitudinal directions and thus evaluating the
On the other hand, a consequence of the spatial selectivity is the high accuracy that must be achieved in the delivered dose for appropriate beam commissioning and QA [31]. Errors in the beam delivery may severely impact the healthy tissues surrounding the target volume.
On the other hand, a high accuracy in the delivered dose must be achieved in proton therapy for appropriate beam commissioning and QA [31], since errors in the beam delivery may severely impact the healthy tissues surrounding the target volume. For that purpose, a suitable beam monitoring system has to be able to quantify the beam characteristics (e.g., position, beam profile in both axes, homogeneity), the beam flux (intensity), and the energy (or dose) delivered by the beam in real time. Beam monitoring devices are usually parallel-plate or pixelated detectors, which cause little scattering and beam energy loss. They count with one or several electrodes segmented in strips or pixels (to quantify the field lateral uniformity) with sub-millimeter position resolution, e.g., 70 μm both horizontally and vertically. However, they suffer from slow response time, reduced sensitivity at low fluxes, response dependence on beam energy, and require daily calibrations. Therefore, it is possible to improve current beam monitoring systems. In this line, new devices should introduce the minimum perturbation having small thicknesses to avoid beam degrading due to multiple Coulomb scattering, energy losses and intensity attenuation. The multi-arrays of thin (20 μm) 3D microdetectors presented herein could be an alternative (especially if the support wafer is etched in future systems) fulfilling, thus, a dual functionality.
The present paper reports on the comparison of two large multi-arrays of 3D microdetectors, having pixel and strip configurations and covering radiation sensitive area of 1.9 cm × 0.1 cm and 5.1 cm × 0.1 cm, respectively. This allows us to have 3D microdosimetry measurements, i.e., not only in the longitudinal plane relative to the beam direction (by using different thicknesses of PMMA that will be converted to water equivalent thicknesses to simulate different depths), but also in the transverse (orthogonal) ones. Tests were carried out at clinical-equivalent fluence rates (∼108 cm−2 s−1) with low-energy (6–24 MeV) proton beams. We performed the first microdosimetry tests with the highest spatial resolution in the transverse plane with respect to the beam direction so far (pitches of 200 μm in the horizontal axis and 250 μm in the vertical one for the pixel configuration and 100 μm for both horizontal and vertical axis for the strip configuration). The results showed that this 3D architecture can be used for microdosimetry characterization in proton therapy and opens the possibility of measuring large surfaces to assess the microdosimetry distributions in critical areas, e.g., organs-at-risk and penumbras, as well as out-of-field regions. Therefore, these devices could be used in proton therapy and commissioning under clinical conditions and also for beam monitoring under the corresponding adaptations depending on the final application.
2 Materials and methods
Two new multi-arrays, with pixel- and strip-type configurations, have been designed, fabricated and characterized. Both systems use the same internal 3D cylindrical architecture as radiation sensitive volume [19, 32]. This section describes: 1) both multi-arrays, 2) the experimental setup, and 3) the Monte Carlo simulations developed to crosscheck the experimental results.
2.1 Microdosimetry systems
The microdosimetry systems are based on arrays of individual 3D cylindrical silicon microdetectors having a diameter of 25 μm and a nominal thickness of 20 μm. Figure 1A, shows a scanning electron microscope (SEM) image of the cross section of an individual microdetector.
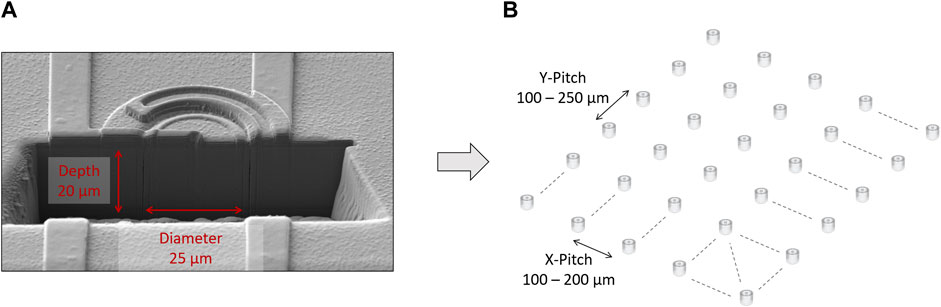
FIGURE 1. (A) SEM image of the cross section of an individual 3D cylindrical microdetector. (B) Sketch of pitch distributions of these microdetectors. This is a tunable parameter depending on the final application.
The microdetectors used in this work belong to the third improved microfabrication run [23] with respect to those studied previously [18, 19, 24, 26, 27, 33]. This is relevant for the accuracy of the microdosimetry measurements and the required CCE correction factor has been included after the Monte Carlo simulations to take this effect into account. This structure reduces the loss of charge carriers due to trapping effects, the charge collection time, and the voltage for full depletion, compared to planar silicon detectors [34]. The isolated radiation sensitive volume (SV) has been fabricated using MEMS technology optimized for years at IMB-CNM [35–38] and mimics the shapes and microscopic sizes of mammalian cells of few micrometers of diameter. More information about the fabrication process has already been reported [19, 26, 27, 39]. The final SV thickness was (19.86 ± 0.04) μm [23]. The microdetectors are independently arranged forming two dimensional arrays in which the distances between adjacent detectors (pitches) are of a few hundreds microns (Figure 1B).
The two systems studied here are based in two layouts of microdetectors (Figure 2), offering different possibilities in terms of spatial resolution and detection area depending on the required applications described above:
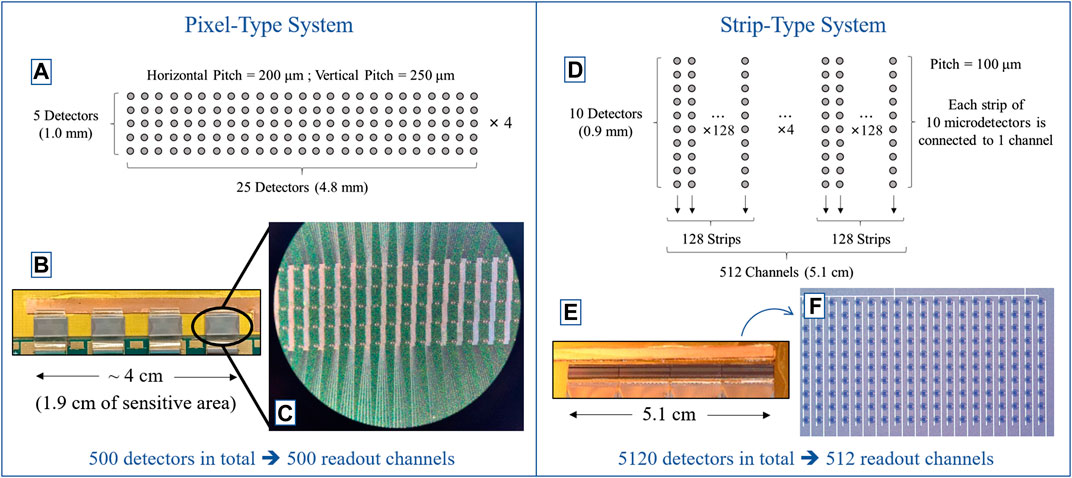
FIGURE 2. (A) Sketch of the 25 × 5 pixel-type layout. (B) Optical image of the four pixel-type arrays. (C) Detail of the array: each detector is connected to a ROC channel. (D) Sketch of the strip-type arrays. (E) Photograph of the 4 strip arrays stacked laterally covering a 5.1 cm length without gaps. The pitch-adapters connecting the individual strips with the corresponding ASICs are partially shown at the bottom. (F) Optical image of some of the 10 microdetector strips.
1. Pixel-type system (Figure 2, left): It consists of 4 arrays having each one 25 × 5 microdetectors. The horizontal pitch is 200 μm and the vertical is 250 μm. Therefore, each array covers an area of 4.8 mm × 1.0 mm and the four arrays cover 1.9 cm × 0.1 cm in total. In this particular case, there are gaps between arrays, but the entire area (∼ 4 cm) can be covered by scanning the gap zones with a micromanipulator stage that would move the detector board. Each individual microdetector (pixel) is connected directly and independently to a channel of a readout chip (ROC, or application-specific integrated circuit, ASIC) in order to analyze the signals individually (bottom of Figure 2B). Those interconnections are made by using the wire-bonding technique with aluminum micro-wires with an average wire length of less than 5 mm.
2. Strip-type system (Figure 2, right): This system consists of 4 arrays having each one 128 columns (strips) of 10 microdetectors per column, each array covers 1.28 cm × 0.9 mm. Each strip of 10 microdetectors is connected to a channel of the ROC. The pitch is 100 μm in both directions. To obtain a quasi-continuous sensor piece without gaps (Figure 2D), the opposite sides of each array were first diced with a diamond micro-saw keeping a distance of (50 ± 10) μm to its edge to manage a pitch of 100 μm between the last unit cell of one array and the first one of the adjacent array. Thus, the resulting stacked multi-array laterally covers a 5.1 cm × 0.9 mm radiation sensitive region without gaps. With this system, we have information in 1D with more accumulated statistics than with the pixel array given the same acquisition time, but with a lower spatial resolution in the Y-axis. A set of tailored pitch-adapters was designed and manufactured to connect the arrays with the respective ROC (bottom of Figure 2E) by using the same aluminum wire-bonding technique mentioned above. Likewise, larger areas can be equally covered by scanning them with a micromanipulator stage that would move the detector board.
A specific low-noise multichannel readout electronics has been customized, reaching threshold levels ≤ 2 keV/μm (in silicon). The readout electronics of each system consists of 1) a daughterboard that contains the ASICs and the microdetector multi-arrays and 2) a motherboard (the same for both systems) that includes the data-acquisition (DAQ) system (protected by a utility model). The boards are enclosed in tailored Faraday cages to reduce the pick-up noise. Windows with sides slightly wider than the sensor areas were etched on the respective cage caps containing the daughterboards. In this way, the radiation impinges on the sensors without interposed layers except for the beamline exit window and the air between the beamline and the sensors. Both boards are connected by a 50 cm I/O cable with dual ended connectors, which allows us to distance the motherboard of the main beam to avoid radiation damage. The DAQ is able to handle multiple ASICs, controls the acquisition, receives the data, and handles the trigger and the data monitoring. It is controlled by means of a graphical user interface (GUI) connected via Ethernet to a PC host where the acquired data are stored. The data analysis can be performed immediately after the irradiation by means of an in-house Python code that displays, among others, the energy spectra, the microdosimetry maps, and all the relevant microdosimetry quantities. Those parameters are calculated following the experimental methodology detailed by Knoll [40], as well as the microdosimetry principles described by Rossi and Zaider [41].
2.2 Irradiation setup
The irradiations were performed at the 14.5 MV tandem accelerator of the ALTO facility in Orsay, France. The sensors were placed in air at room temperature and atmospheric pressure (Figure 3) at a distance of (5.1 ± 0.1) cm from the beam exit, in which a window of 200 μm-thick kapton was used to extract the beam from the vacuum pipeline into the air. The beam direction was set as perpendicular as possible to the detector surface (Figure 3B). We used proton beams with energies ranging between 6 and 24 MeV. The beam currents were adjusted to have ion fluence rates of ∼108 cm−2 s−1, i.e., in the order of magnitude of those used in clinical treatments. The beam had a diameter of approximately 1 cm (obtained by defocusing the beam), therefore, several acquisitions were made for each energy shifting the position of the microdosimetry systems to cover the whole detection surface.
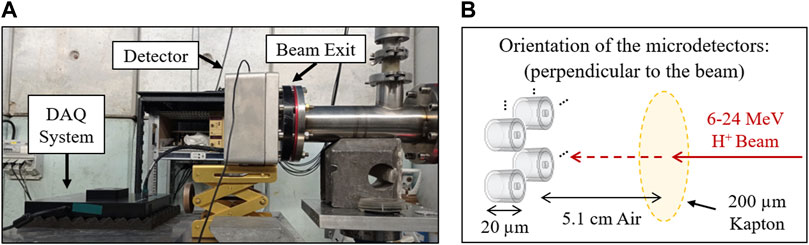
FIGURE 3. (A) Picture of the experimental setup at ALTO during the irradiations. (B) Sketch showing the orientation of the microdetectors with respect to the proton beam (not to scale).
2.3 Microdosimetry calculations
The main microdosimetry quantities studied in this work are summarized in this section, more details can be found in the literature [2].
The lineal energy y is a stochastic quantity that can be calculated as the ratio between the total energy deposited by the impinging particles in the SV of the microdetector (ϵ) divided by its mean chord length
Frequency-mean lineal energy
The lineal energy is a stochastic quantity with a frequency (or probability) distribution f(y). The expected value of this distribution is the frequency-mean lineal energy
In the case of our microdetector systems, we have obtained the
The standard deviation of the frequency-mean lineal energy
Dose-average lineal energy
The absorbed dose distribution d(y) is given by Eq. 4.
The expected value of d(y) is called the dose-mean lineal energy,
2.4 Monte Carlo simulations
Monte Carlo (MC) simulations reproducing the irradiation configuration and sensor geometries were performed with the GATE (version 9.1) open-source platform [42]. They were used to crosscheck the experimental pulse-height spectra. We used the Physics lists and parameters recommended by the GATE collaboration for proton therapy applications, i.e., the Binary Cascade (BIC) model for the hadronic interactions adding the low-energy electromagnetic processes by implementing the GATE builder QGSP_BIC_HP_EMZ [43]. The range cuts implemented were of 10 mm and 1 μm for all the particles in the air and sensor array geometries, respectively.
The energy beam spectra were defined as Gaussian distributions (from 6 to 24 MeV) with initial standard deviations for each case of 0.1 MeV (as specified by the beamline scientists) by using the general particle source (GPS). The simulations were run into a computation cluster (CC-IN2P3) to speed the calculations with 1010 primary protons for each energy. The total energies deposited into the SV of both configurations were recorded. Afterwards, they were treated to account for the CCE dependence on the entry point of the particle trajectory to the SV as detailed in [22, 23]. Then, the energy spectra were reconstructed and compared to the experimental data. Subsequently, the lineal energy distributions were calculated by dividing the energy spectra by the mean path length of the particles in the SV, i.e., 19.86 μm, which corresponds to the silicon thickness since the microdetectors were irradiated perpendicularly to their front face (see Figure 3B).
3 Results
We present in this section some of the results obtained for both systems: their energy calibration, the characterization of the beam intensity, the experimental energy spectra and their comparison to Monte Carlo simulations, the microdosimetry maps, and finally the mean values of the microdosimetry quantities.
3.1 Energy calibration
For the calibration, we assume a linear proportionality between the energy deposited in the silicon microdetectors and the corresponding electronics output voltage pulse height [44]. Due to the small size of the SVs (
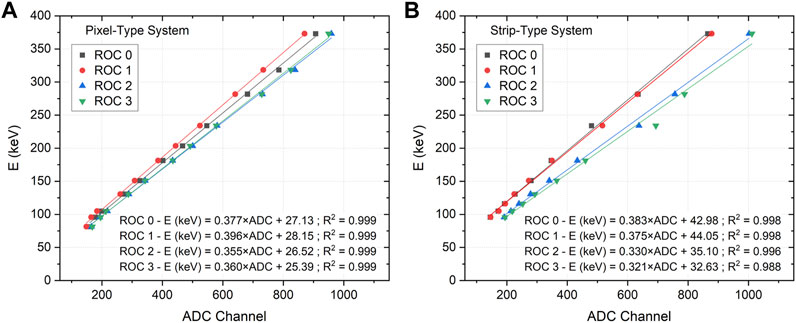
FIGURE 4. Energy calibration obtained for each ROC in (A) the pixel system and (B) the strip system. The deposited energies calculated with SRIM simulations were fitted to the experimental ADC channels with a linear model.
3.2 Beam intensity
Figure 5 shows the total number of particles collected by each ROC channel of the pixel (top) and strip (bottom) systems, for one proton beam energy, 7 MeV. In the case of the pixel system, since each ROC channel is connected to one individual microdetector, we have a 2D distribution covering a surface of 1.9 cm×0.1 cm with a spatial resolution of 200 μm in the horizontal axis and 250 μm in the vertical one. With the strip system, since each ROC channel collects the particles from 10 individual microdetectors in a 0.1 cm strip, we measure along a 1D distance of 5.1 cm with a resolution of 100 μm. As it can be seen in Figure 5, the beam that can be reachable at the ALTO accelerator is not large enough to cover the full detection surface, therefore, several irradiations where made for each beam energy to characterize the complete system and the four ROCs of each system. For the sake of simplicity, in this section we will only show the results obtained with two representative regions of both systems, indicated with a red dashed line in Figure 5, corresponding to a 5 mm horizontal distance in the pixel system and 1 cm of the strip system. The maps presented in Figure 5 show that we are able to quantify the beam intensity in the transverse plane relative to the beam direction, characterizing the spatial dependence of the beam intensity with resolutions of 200 μm in two dimensions in the case of the pixel system and 100 μm in one dimension with the strip one.
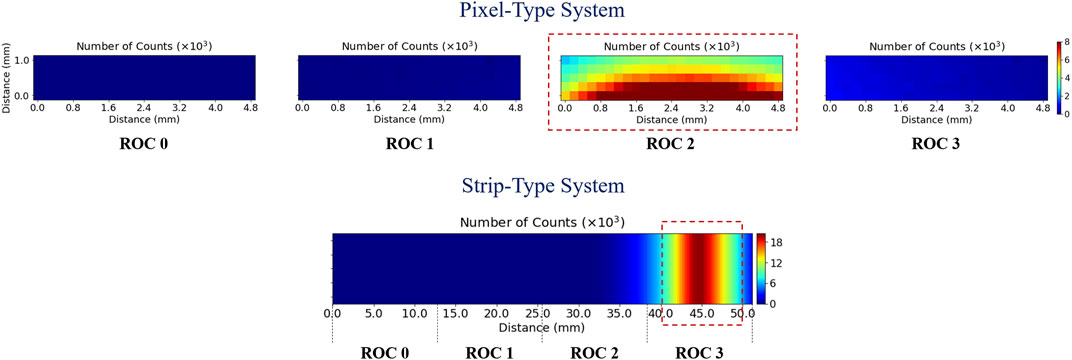
FIGURE 5. Number of particles detected by both systems with a 7 MeV proton beam (not to scale).
With the pixel configuration (Figure 5, top), we can observe in 2D the ellipsoidal shape of the beam impinging into the array as well as its halo. In contrast, with the strip system (Figure 5, bottom), we can only observe the beam intensity gradient in the horizontal direction along the 1 cm distance irradiated, each vertical line in the plot correspond to the counts accumulated by the 10 detectors covering a distance of 1 mm along the Y-axis (vertical direction), the beam has a Gaussian shape along the X-axis. Another difference between both systems is the acquisition time necessary to accumulate the same statistics, since in the strip system we have 10 microdetectors connected to one channel along the Y-axis, we need an integration time ten times lower to obtain the same number of counts per channel than with the pixel system, although this is achieved at the expense of the spatial resolution in this axis.
These results demonstrate that we can perform beam monitoring with both microdetector systems, using different conditions of detection surface, dimensions, spatial resolution and acquisition time, and using also different modes of 2D mapping including pixel by pixel and strip by strip. Additionally, the number of total counts will have also a direct impact on the values and the standard deviations of the physical microdosimetry quantities, as discussed below.
3.3 Energy spectra
Figure 6 shows the experimental energy spectra, integrated over all the SVs contained in the selected regions indicated in Figure 5, obtained for three different proton beam energies (7, 12 and 20 MeV) with both systems. Note that the X-axis represents the total energy deposited in the SV (i.e., in the 19.86 μm thick silicon). The spectra are essentially identical for the 12 and 20 MeV proton beams for both pixel and strip systems. However, for the lowest energy, 7 MeV, although the centroid of the peaks are in the same position, there is a 16 % difference in the FWHM (Full Width at Half Maximum). This can be due to slight differences in the beam shape, which are more visible for lower energies since the straggling produced in the air is more relevant than for higher energies, in addition, this effect is even more important given the different size of the detection surfaces considered for both systems. The energy thresholds (low level discriminator) that we have used to avoid noise during the measurements are ∼73 keV for the pixel system and ∼47 keV for the strip one, this produces some differences at the low energy tail between both systems, as it can be seen in Figures 6B–C.
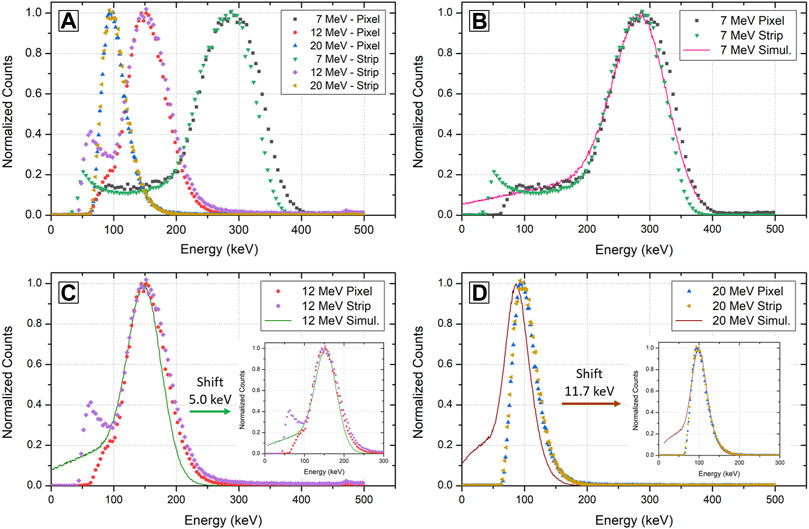
FIGURE 6. (A) Experimental energy spectra obtained with both systems for three representative energies. (B–D) Comparison of the experimental spectra with Geant4 simulations.
We have compared the experimental energy spectra to MC simulations performed with GATE. Figures 6B–D show the comparison between the experimental pulse-height spectra (Figure 6A) and those simulated once the CCE correction factor [23] and a resolution factor to take into account the noise of the electronics (not implemented in GATE) have been applied to the simulations. An energy shift between the experimental and the simulated peak maximum is observed in all the cases, being more evident for 12 and 20 MeV. The origin of these differences between simulated and measured spectra is the slightly different values of the deposited energy that we have found between SRIM and Geant4 simulations. The values of the deposited energy obtained for each beam energy with both sets of simulations are shown in Table 1, the difference between each pair of values is also indicated in this table as ΔE. We performed the energy calibration with the values from the SRIM simulations in order to have an independent intercomparison between the MC code used in the calibration and that used in the spectra comparison (Geant4), which explains the shifts observed. When a shift offset corresponding to ΔE is applied to the simulated spectra (see insets in Figures 6C–D), there is a very good agreement between the spectra shapes. Similar shifts have been previously found in microdosimetry studies at these micrometer scales [13, 22, 24].
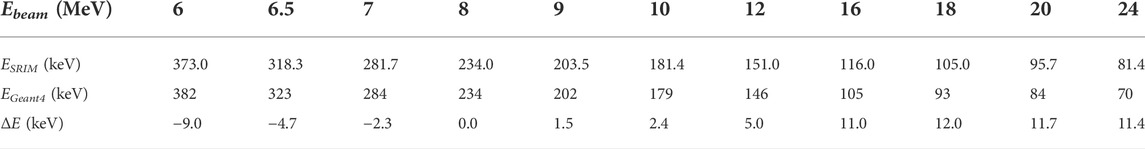
TABLE 1. Values of the energy deposited in the SV by the protons obtained with SRIM and Geant4 simulations for the different beam energies used in this work, and difference between the two sets of values (ΔE).
3.4 Microdosimetry spectra
To obtain the lineal energy spectra, data were analyzed by means of an in-house Python code, using the energy calibration presented in Section 3.1, and the equations described in Section 2.3. The results presented in this work correspond to the values of the lineal energy obtained in silicon, to calculate those values in tissue-equivalent material one should apply Eq. 8
Where yTE and ySi are the values of the lineal energy in tissue-equivalent material and in silicon, respectively, ρTE and ρSi the densities, and STE and SSi the mass stopping power (MeV⋅cm2⋅g−1) in both materials.
Figure 7 shows, for the three energies discussed in this work, the lineal energy distribution yf(y) on the left, and the absorbed dose distribution yd(y) on the right, obtained with the pixel system (top) and with the strip system (bottom). As previously explained, this figure correspond to the values of the lineal energy in silicon.
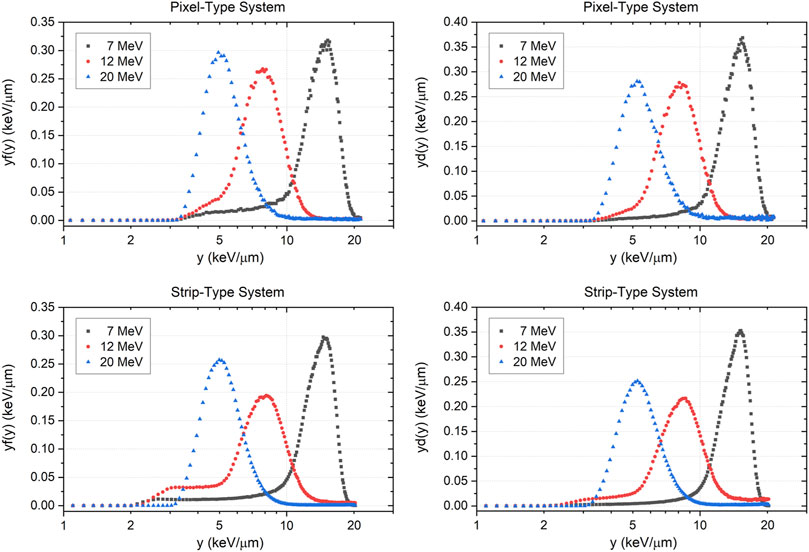
FIGURE 7. Lineal energy distribution yf(y), left, and absorbed dose distribution yd(y), right, obtained with the pixel (top) and the strip (bottom) systems for three different energies (values in silicon).
These curves correspond to the integrated spectra coming from all the microdetectors contained in the selected regions indicated in Figure 5. However, thanks to the multi-channels electronic used and the data analysis code tailored, they could have also been calculated, for example, for each channel of the readout chip individually [22]. Therefore, one could also obtain f(y) and d(y) for each individual microdetector of all the pixels and strips, as it is shown in the next section. This can be very useful for clinical applications, e.g., voxel-by-voxel RBE optimization [46] with high spatial resolution, particularly in penumbras, critical areas, and out-of-field regions [47].
3.5 Microdosimetry maps
The values of the microdosimetric quantities have been calculated individually for each microdetector. In particular, we focus on the frequency-mean lineal energy (
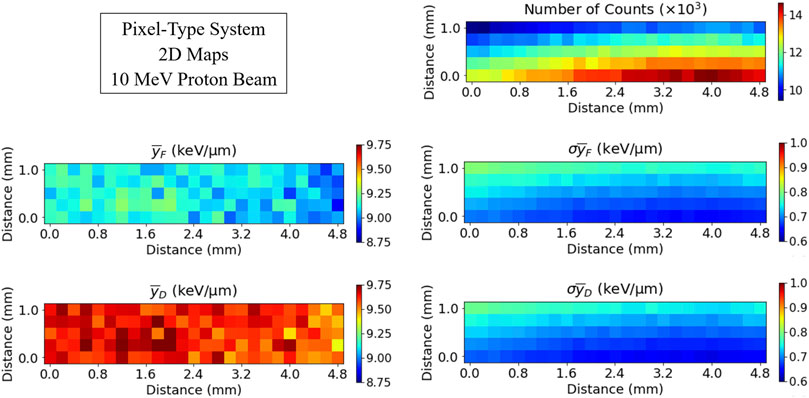
FIGURE 8. 2D microdosimetry maps obtained with the pixel system for 10 MeV protons. Top: number of particles detected. Middle: frequency-mean lineal energy and its standard deviation. Bottom: dose-mean lineal energy and its corresponding standard deviation.
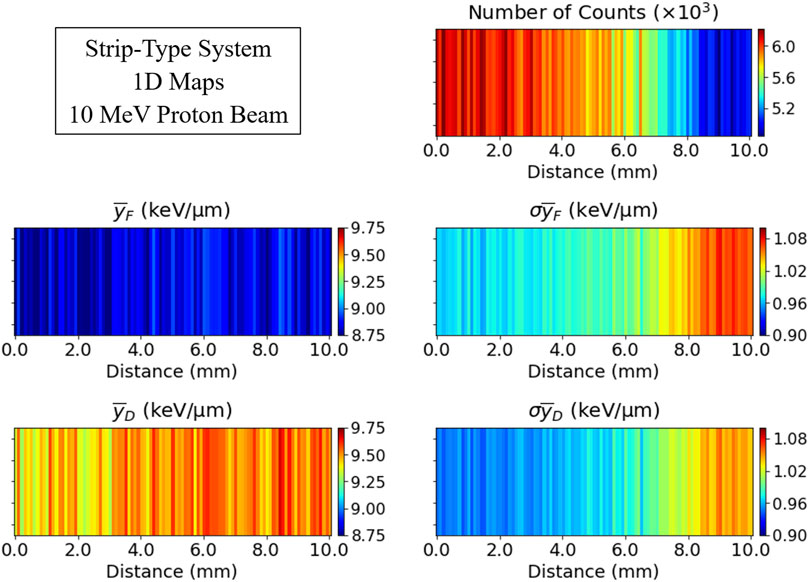
FIGURE 9. 1D microdosimetry maps obtained with the strip system for 10 MeV protons. Top: number of particles detected. Middle: frequency-mean lineal energy and its standard deviation. Bottom: dose-mean lineal energy and its standard deviation.
As in the beam intensity maps shown in Section 3.2, we obtain 2D microdosimetry maps for the pixel system with a resolution of 200 μm in the X-axis and 250 μm in the Y-axis, and 1D maps with a resolution of 100 μm with the strip system. On the top-right of Figures 8, 9, we see the number of particles detected by each individual microdetector or SV (in the pixel system, Figure 8) or by 0.9 mm line in the Y-axis (in the strip system, Figure 9) . On the left, we show the values of
Figure 10 shows the frequency-mean lineal energy
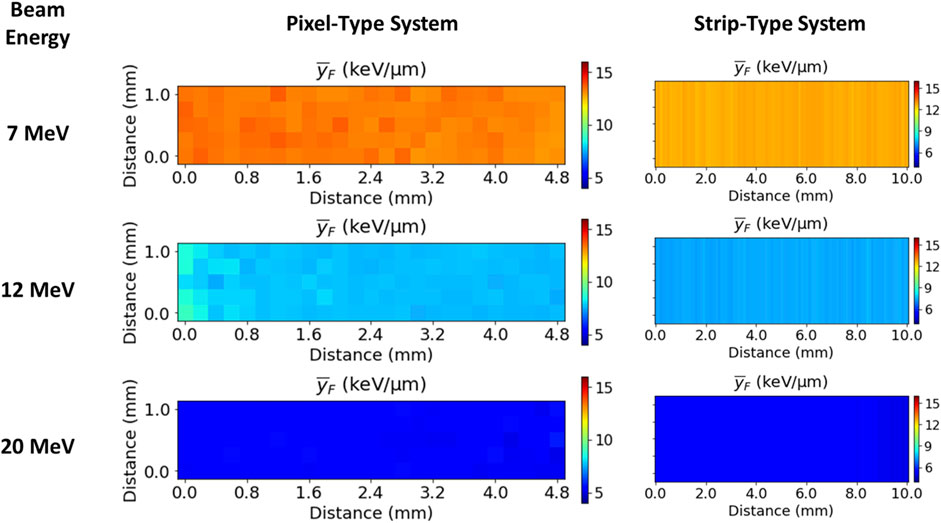
FIGURE 10. Maps of the frequency-mean lineal energy
The mean values of
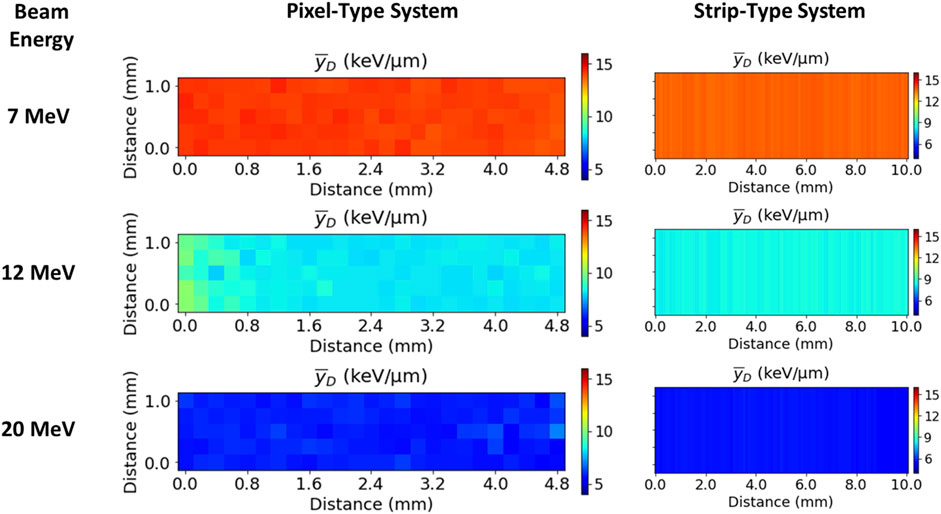
FIGURE 11. Maps of the dose-mean lineal energy
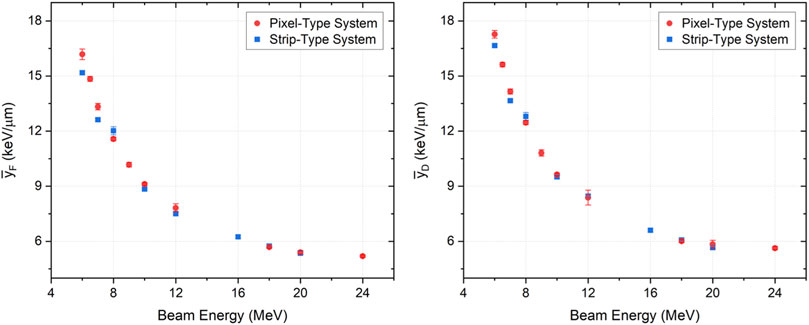
FIGURE 12. Mean values of
Those mean values and their dispersion are presented in Table 2, as well as the differences obtained between both systems. The highest difference is 6.4 % and it is produced for the 6 MeV protons. As mentioned earlier, for the lowest energy beams, it is expected to have higher differences due to a higher straggling of the particles in the air, making more significant slight differences in the geometries (tilt, incidence angles, detection surfaces, etc.).
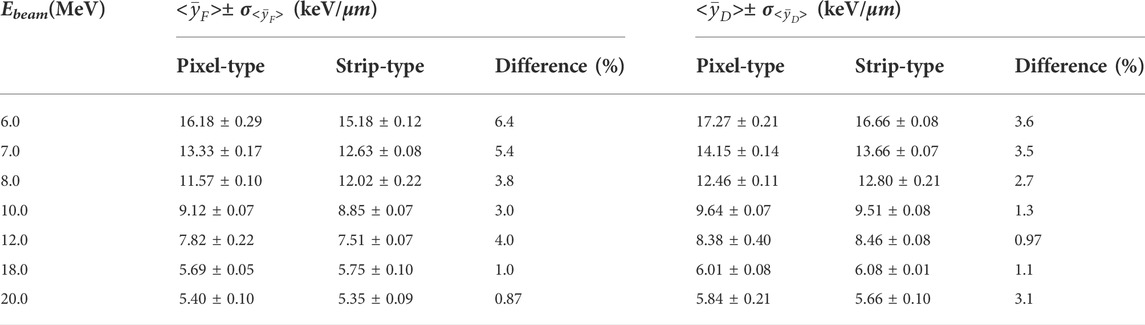
TABLE 2. Values of <
4 Discussion
The two systems studied in this work have been characterized with 6–24 MeV proton beams, although these values are lower than the ones used in clinical proton therapy (70–200 MeV), the results obtained here are acceptable as a first approach since the proton energies used are similar to those at the end of the distal edge in clinical scenarios. It is worth noting that the energy thresholds used with this setup, ∼73 keV for the pixel system and ∼47 keV for the strip one, which corresponds to lineal energy values of 3.7–2.4 keV/μm in silicon, or 2.2–1.4 keV/μm in tissue-equivalent, limit the measurement of very low LET contributions in the Bragg peak entrance.
Related to the calibration procedure, a good lineal behavior has been observed in the energy range studied for both systems. In order to have an independent intercomparison between the MC codes, we performed the energy calibration with the SRIM values and the spectra comparison with Geant4. Then, we observed that when we compare the experimental energy spectra, a small energy shift (≤ 12 keV) between both peak maximums is observed in all the cases. If a shift offset is properly applied (6), there is an overall good agreement between both spectra. The origin of these differences comes from the values of the deposited energy obtained for each beam energy (see Table 1) with the 2 MC codes, SRIM and Geant4. This shows the importance of verifying the results with independent MC codes because, in certain cases, there could be larger shifts which can impact the values of <
With respect to the microdosimetry measurements, Table 3 compares the results obtained with the first microdosimetry arrays [22], under the same irradiation conditions in ALTO, with the current ones. We present the results obtained for four representative energies and the maximal difference between both sets of data, the results are consistent for all of them. As explained in [22], the higher difference observed at 18 MeV can be due to the different thresholds applied to the systems during the measurements because of their different level of noise. This different threshold produced a variation on the number of events detected at low energy, which are especially relevant for the spectra at 18 MeV.
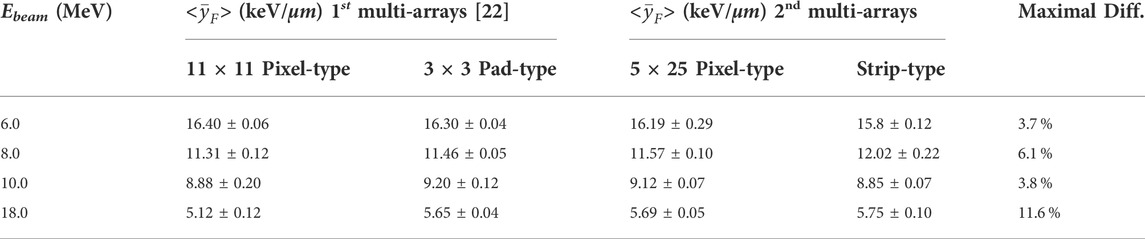
TABLE 3. Values of <
The experimental microdosimetry values of
Considering the beam monitoring application, new beam monitoring devices should have a wide fluency measurement range, high spatial resolution, and be as transparent as possible. In this line, the results (Section 3.2) showed that the devices discussed in this paper are able to obtain the beam profiles (intensity at each position) for beam currents between 100 and 200 pA with a resolution of 200 μm in the horizontal axis and 250 μm in the vertical one for the pixel configuration and 100 μm for both horizontal and vertical axis for the strip configuration, which is a promising solution for high spatial resolution requirements. Moreover, these sensors are manufactured over Silicon-on-Insulator wafers whose support may be selectively etched to obtain ultra-thin sensors (≤ 20 μm) [51], avoiding not only back-scattering contributions, but also minimizing the energy loss of the main particle beam. Besides that, the acquisition time can be reduced with the strip system at the expense of losing spatial resolution in one direction. For example, the acquisition time to accumulate the same statistics was 10 times lower in the strip system than in the pixel one, since it has 10 microdetectors connected to each channel (instead of 1 detector per channel), but reducing the spatial resolution from 200 μm to 0.9 mm in the Y-axis. Regarding the beam intensity, that can saturate the readout, the current 3D cylindrical architecture can be technologically reduced to a half or smaller (∼ 9 μm). It means that we could quadruple the beam intensity without saturation, i.e., reducing the possibility of pile-up in high flux environments.
5 Conclusion
We present the first multi-arrays of 3D cylindrical microdosimeters, pixel and strip types, that allow us to generate a modular structure to scale the sensitive areas towards the centimeter scale. Depending on the final application, we may need a trade-off between a portable and achievable multi-channel electronics and the minimum spatial resolution required. Two scalable microdetector arrays for both beam monitoring and microdosimetry purposes have been manufactured and characterized using proton beams at different energies with clinical-equivalent fluence rates.
The present paper reports on the first comparison between the two multi-array microdosimeter systems for 3D microdosimetry with the highest spatial resolution so far in the transverse plane respect to the beam direction (200 and 100 μm, or lower by adjusting the layout). We have demonstrated for first time that we may obtain microdosimetry distributions in two dimensions, which would be very useful for clinical conditions, e.g., close to organs-at-risk where we may have heterogeneous LET distributions, distal edges, for further voxel-by-voxel RBE optimization, dosimetry evaluations in spatially fractionated radiation therapy (SFRT), etc.
Additionally, they can be used for beam monitoring due to their small thickness (20 μm) and adaptable resolution. Therefore we have proposed a high-resolution technological solution that can be used in clinical proton therapy scenarios for microdosimetry and also potentially for beam monitoring. It has a fully integrated in-house python code and firmware control for real-time monitoring. We have customized a read-out electronics and pitch-adapters that allows us to assemble several detectors stacked laterally and a specific multichannel DAQ system for spectroscopy. Nevertheless, radiation-hardness tests are still required to evaluate the usable lifetime of the devices under realistic clinical irradiation conditions, which is key for a future clinical implementation and commercialization.
Data availability statement
The raw data supporting the conclusions of this article will be made available by the authors, without undue reservation.
Author contributions
DBP and CG conceived and performed the experiments and discussed the results. DBP programmed the in-house Python code for the data analysis. MZ adapted a part of the Python code for the experiments. DBP analyzed the experimental data. CG conceived the microdosimetry systems and performed the Monte Carlo simulations. CF and CG designed the microdetector arrays. CF, DQ and FG fabricated and characterized the microdetectors. CG proposed the new customized pitch-adapters and DB designed and manufactured them. DB-P. and CG wrote the article. All authors reviewed the manuscript.
Funding
The 3D cylindrical microdetectors fabrication was funded from the European Union’s Horizon research and innovation program under the Marie Skłodowska-Curie grant agreement No 745109. The readout electronics systems were funded from the CNRS-Momentum fellow 2019-2021.
Acknowledgments
DBP and CG thank the staff of the ALTO facility for their support to perform the tests. CG gratefully acknowledges the access to the CNRS/IN2P3 Computing Center (Lyon, France).
Conflict of interest
The authors declare that the research was conducted in the absence of any commercial or financial relationships that could be construed as a potential conflict of interest.
Publisher’s note
All claims expressed in this article are solely those of the authors and do not necessarily represent those of their affiliated organizations, or those of the publisher, the editors and the reviewers. Any product that may be evaluated in this article, or claim that may be made by its manufacturer, is not guaranteed or endorsed by the publisher.
References
1. Yock TI, Bhat S, Szymonifka J, Yeap BY, Delahaye J, Donaldson SS, et al. Quality of life outcomes in proton and photon treated pediatric brain tumor survivors. Radiother Oncol (2014) 113:89–94. doi:10.1016/j.radonc.2014.08.017
2. Rossi HH. Microdosimetry and the effects of small doses of radiation. IEEE Trans Nucl Sci (1976) 23:1417–21. doi:10.1109/tns.1976.4328493
3.ICRU. Fundamental quantities and units for ionizing radiation ICRU. J ICRU (2011) 1–31. Report 84.
4. Wagenaar D, Tran L, Meijers A, Marmitt G, Souris K, Bolst D, et al. ′Validation of linear energy transfer computed in a Monte Carlo dose engine of a commercial treatment planning system. Phys Med Biol (2020) 65:025006. doi:10.1088/1361-6560/ab5e97
5. McGovern SL, Okcu MF, Munsell MF, Kumbalasseriyil N, Grosshans DR, McAleer MF, et al. Outcomes and acute toxicities of proton therapy for pediatric atypical teratoid/rhabdoid tumor of the central nervous system. Int J Radiat Oncology*Biology*Physics (2014) 90:1143–52. doi:10.1016/j.ijrobp.2014.08.354
6. Indelicato DJ, Flampouri S, Rotondo RL, Bradley JA, Morris CG, Aldana PR, et al. Incidence and dosimetric parameters of pediatric brainstem toxicity following proton therapy. Acta oncologica (2014) 53:1298–304. doi:10.3109/0284186X.2014.957414
7. Ödén J, Toma-Dasu I, Nyström PW, Traneus E, Dasu A. Spatial correlation of linear energy transfer and relative biological effectiveness with suspected treatment-related toxicities following proton therapy for intracranial tumors. Med Phys (2020) 47:342–51. doi:10.1002/mp.13911
8.ICRU. Microdosimetry ICRU report 36. Bethesda, MD, USA: International Commission on Radiation Units and Measurements (1983).
9. Bianchi A, Selva A, Colautti P, Bortot D, Mazzucconi D, Pola A, et al. Microdosimetry with a sealed mini-TEPC and a silicon telescope at a clinical proton SOBP of CATANA. Radiat Phys Chem (2020) 171:108730. doi:10.1016/j.radphyschem.2020.108730
10. Verona C, Cirrone GAP, Magrin G, Marinelli M, Palomba S, Petringa G, et al. Microdosimetric measurements of a monoenergetic and modulated Bragg peaks of 62 mev therapeutic proton beam with a synthetic single crystal diamond microdosimeter. Med Phys (2020) 47:5791–801. doi:10.1002/mp.14466
11. Loto O, Zahradnik I, Leite AM, De Marzi L, Tromson D, Pomorski M. Simultaneous measurements of dose and microdosimetric spectra in a clinical proton beam using a sccvd diamond membrane microdosimeter. Sensors (2021) 21:1314. doi:10.3390/s21041314
12. Rosenfeld AB. Novel detectors for silicon based microdosimetry, their concepts and applications. Nucl Instr Methods Phys Res Section A: Acc Spectrometers Detectors Associated Equipment (2016) 809:156–70. doi:10.1016/j.nima.2015.08.059
13. Anderson SE, Furutani KM, Tran LT, Chartier L, Petasecca M, Lerch M, et al. Microdosimetric measurements of a clinical proton beam with micrometer-sized solid-state detector. Med Phys (2017) 44:6029–37. doi:10.1002/mp.12583
14. Tran LT, Chartier L, Bolst D, Pogossov A, Guatelli S, Petasecca M, et al. Characterization of proton pencil beam scanning and passive beam using a high spatial resolution solid-state microdosimeter. Med Phys (2017) 44:6085–95. doi:10.1002/mp.12563
15. Tran L, Bolst D, Guatelli S, Pogossov A, Petasecca M, Lerch M, et al. The relative biological effectiveness for carbon, nitrogen, and oxygen ion beams using passive and scanning techniques evaluated with fully 3D silicon microdosimeters. Med Phys (2018) 45:2299–308. doi:10.1002/mp.12874
16. Samnøy AT, Ytre-Hauge KS, Malinen E, Tran L, Rosenfeld A, Povoli M, et al. Microdosimetry with a 3D silicon on insulator (SOI) detector in a low energy proton beamline. Radiat Phys Chem (2020) 176:109078. doi:10.1016/j.radphyschem.2020.109078
17. Parisi A, Olko P, Swakoń J, Horwacik T, Jabłoński H, Malinowski L, et al. Microdosimetric characterization of a clinical proton therapy beam: Comparison between simulated lineal energy distributions in spherical water targets and experimental measurements with a silicon detector. Phys Med Biol (2022) 67:015006. doi:10.1088/1361-6560/ac4563
18. Guardiola C, Quirion D, Pellegrini G, Fleta C, Esteban S, Cortés-Giraldo MA, et al. Silicon-based three-dimensional micro-structures for radiation dosimetry in hadrontherapy. Appl Phys Lett (2015) 107:023505. doi:10.1063/1.4926962
19. Fleta C, Esteban S, Baselga M, Quirion D, Pellegrini G, Guardiola C, et al. 3D cylindrical silicon microdosimeters: Fabrication, simulation and charge collection study. J Instrum (2015) 10:P10001. doi:10.1088/1748-0221/10/10/p10001
20. Conte V, Agosteo S, Bianchi A, Bolst D, Bortot D, Catalano R, et al. Microdosimetry of a therapeutic proton beam with a mini-TEPC and a MicroPlus-Bridge detector for RBE assessment. Phys Med Biol (2020) 65:245018. doi:10.1088/1361-6560/abc368
21. Pola A, Bortot D, Mazzucconi D, Fazzi A, Galer S, Kirkby KJ, et al. Characterization of a pixelated silicon microdosimeter in micro-beams of light ions. Radiat Meas (2020) 133:106296. doi:10.1016/j.radmeas.2020.106296
22. Bachiller-Perea D, Zhang M, Fleta C, Quirion D, Bassignana D, Gómez F, et al. Microdosimetry performance of the first multi-arrays of 3D-cylindrical microdetectors. Sci Rep (2022) 12:12240. doi:10.1038/s41598-022-14940-1
23. Bachiller-Perea D, López JG, Jiménez-Ramos Md. C, Gómez F, Fleta C, Quirion D, et al. Characterization of the charge collection efficiency in silicon 3-D-detectors for microdosimetry. IEEE Trans Instrum Meas (2021) 70:1–11. doi:10.1109/TIM.2021.3054631
24. Prieto-Pena J, Gómez F, Fleta C, Guardiola C, Pellegrini G, Donetti M, et al. Microdosimetric spectra measurements on a clinical carbon beam at nominal therapeutic fluence rate with silicon cylindrical microdosimeters. IEEE Trans Nucl Sci (2019) 66:1840–7. doi:10.1109/tns.2019.2921453
25. Guardiola C, Bachiller-Perea D, Prieto-Pena J, Jimenez-Ramos MC, Garcia-Lopez J, Esnault C, et al. Microdosimetry in low energy proton beam at therapeutic-equivalent fluence rate with silicon 3D-cylindrical microdetectors. Phys Med Biol (2021) 66:114001. doi:10.1088/1361-6560/abf811
26. Esteban S. Development of advanced silicon sensors for neutron detection and microdosimetry. Ph.D. thesis. Universitat Autònoma de Barcelona (2016).
27. Prieto-Pena J. Development of silicon sensors for dosimetry and microdosimetry. Ph.D. thesis, Univ. de Santiago de Compostela (2019).
28. Constanzo J, Vanstalle M, Finck C, Brasse D, Rousseau M. Dosimetry and characterization of a 25-mev proton beam line for preclinical radiobiology research. Med Phys (2019) 46:2356–62. doi:10.1002/mp.13512
29. Ali Y, Monini C, Russeil E, Létang JM, Testa E, Maigne L, et al. Estimate of the biological dose in hadrontherapy using gate. Cancers (2022) 14:1667. doi:10.3390/cancers14071667
30. Billena C, Khan AA. Current review of spatial fractionation: Back to the future? Int J Radiat Oncology*Biology*Physics (2019) 104:177–87. doi:10.1016/j.ijrobp.2019.01.073
31. Malicki J. The importance of accurate treatment planning, delivery, and dose verification. Rep Pract Oncol Radiother (2012) 17:63–5. doi:10.1016/j.rpor.2012.02.001
32. Guardiola C, Fleta C, Rodríguez J, Lozano M, Gómez F. Preliminary microdosimetric measurements with ultra-thin 3D silicon detectors of a 62 MeV proton beam. J Instrum (2015) 10:P01008. doi:10.1088/1748-0221/10/01/p01008
33. Prieto-Pena J, Gómez F, Guardiola C, Jimenez-Ramos MC, Garcia-Lopez J, Baratto-Roldán A, et al. Impact of charge collection efficiency and electronic noise on the performance of solid state 3D-microdetectors. Phys Med Biol (2020) 65:175004. doi:10.1088/1361-6560/ab87fa
34. Parker S, Kenney CJ, Segal J. 3D—a proposed new architecture for solid-state radiation detectors. Nucl Instr Methods Phys Res Section A: Acc Spectrometers Detectors Associated Equipment (1997) 395:328–43. doi:10.1016/s0168-9002(97)00694-3
35. Pellegrini G, Balbuena J, Bassignana D, Cabruja E, Fleta C, Guardiola C, et al. 3D double sided detector fabrication at IMB-CNM. Nucl Instr Methods Phys Res Section A: Acc Spectrometers Detectors Associated Equipment (2013) 699:27–30. doi:10.1016/j.nima.2012.05.087
36. Quirion D, Manna M, Hidalgo S, Pellegrini G. Manufacturability and stress issues in 3D silicon detector technology at IMB-CNM. Micromachines (2020) 11:1126. doi:10.3390/mi11121126
37. Terzo S, Grinstein S, Manna M, Pellegrini G, Quirion D. A new generation of radiation hard 3d pixel sensors for the atlas upgrade. Nucl Instr Methods Phys Res Section A: Acc Spectrometers, Detectors Associated Equipment (2020) 982:164587. doi:10.1016/j.nima.2020.164587
38. Manna M, Grieco C, Grinstein S, Hidalgo S, Pellegrini G, Quirion D, et al. First characterisation of 3d pixel detectors irradiated at extreme fluences. Nucl Instr Methods Phys Res Section A: Acc Spectrometers, Detectors Associated Equipment (2020) 979:164458. doi:10.1016/j.nima.2020.164458
39. Guardiola C, Fleta C, Quirion D, Pellegrini G, Gómez F. Silicon 3d microdetectors for microdosimetry in hadron therapy. Micromachines (2020) 11:1053. doi:10.3390/mi11121053
42. Sarrut D, Bardiès M, Boussion N, Freud N, Jan S, Létang J-M, et al. A review of the use and potential of the gate Monte Carlo simulation code for radiation therapy and dosimetry applications. Med Phys (2014) 41:064301. doi:10.1118/1.4871617
43. Winterhalter C, Taylor M, Boersma D, Elia A, Guatelli S, Mackay R, et al. Evaluation of gate-rtion (gate/geant4) Monte Carlo simulation settings for proton pencil beam scanning quality assurance. Med Phys (2020) 47:5817–28. doi:10.1002/mp.14481
45. Ziegler JF, Ziegler MD, Biersack JP. Srim - the stopping and range of ions in matter (2010). Nucl Instr Methods Phys Res Section B: Beam Interactions Mater Atoms (2010) 268:1818–23. doi:10.1016/j.nimb.2010.02.091
46. Feng H, Shan J, Anderson JD, Wong WW, Schild SE, Foote RL, et al. Per-voxel constraints to minimize hot spots in linear energy transfer-guided robust optimization for base of skull head and neck cancer patients in impt. Med Phys (2022) 49:632–47. doi:10.1002/mp.15384
47. Butterworth KT, McGarry CK, Clasie B, Carabe-Fernandez A, Schuemann J, Depauw N, et al. Relative biological effectiveness (RBE) and out-of-field cell survival responses to passive scattering and pencil beam scanning proton beam deliveries. Phys Med Biol (2012) 57:6671–80. doi:10.1088/0031-9155/57/20/6671
48. Debrot E, Tran L, Chartier L, Bolst D, Guatelli S, Vandevoorde C, et al. SOI microdosimetry and modified MKM for evaluation of relative biological effectiveness for a passive proton therapy radiation field. Phys Med Biol (2018) 63:235007. doi:10.1088/1361-6560/aaec2f
49. Bertolet A, Grilj V, Guardiola C, Harken A, Cortés-Giraldo M, Baratto-Roldán A, et al. Experimental validation of an analytical microdosimetric model based on geant4-dna simulations by using a silicon-based microdosimeter. Radiat Phys Chem (2020) 176:109060. doi:10.1016/j.radphyschem.2020.109060
50. Pan C, Huang Y, Cheng K, Chao T, Tung C. Microdosimetry spectra and relative biological effectiveness of 15 and 30mev proton beams. Appl Radiat Isot (2015) 97:101–5. doi:10.1016/j.apradiso.2014.12.019
Keywords: microdosimetry, proton therapy, silicon radiation detectors, beam monitoring, Monte Carlo simulations
Citation: Bachiller-Perea D, Zhang M, Fleta C, Quirion D, Bassignana D, Gómez F and Guardiola C (2022) Multi-arrays of 3D cylindrical microdetectors for beam characterization and microdosimetry in proton therapy. Front. Phys. 10:958648. doi: 10.3389/fphy.2022.958648
Received: 31 May 2022; Accepted: 22 August 2022;
Published: 10 October 2022.
Edited by:
Gabriela Llosá, Instituto de Física Corpuscular (CSIC), SpainReviewed by:
Hidetoshi Yamaguchi, The University of Tokyo, JapanAnatoly Rosenfeld, University of Wollongong, Australia
Copyright © 2022 Bachiller-Perea, Zhang, Fleta, Quirion, Bassignana, Gómez and Guardiola. This is an open-access article distributed under the terms of the Creative Commons Attribution License (CC BY). The use, distribution or reproduction in other forums is permitted, provided the original author(s) and the copyright owner(s) are credited and that the original publication in this journal is cited, in accordance with accepted academic practice. No use, distribution or reproduction is permitted which does not comply with these terms.
*Correspondence: Diana Bachiller-Perea, ZGlhbmFiYWNoaWxsZXJwZXJlYUBnbWFpbC5jb20=; Consuelo Guardiola, Y29uc3VlbG8uZ3VhcmRpb2xhQGltYi1jbm0uY3NpYy5lcw==