 Yaxiong Li
 Xinzhi Yang
- Xi’an Research Institute of High Technology, Xi’an, Shaanxi, China
Identifying a set of critical nodes with high propagation in complex networks to achieve maximum influence is an important task in the field of complex network research, especially in the background of the current rapid global spread of COVID-19. In view of this, some scholars believe that nodes with high importance in the network have stronger propagation, and many classical methods are proposed to evaluate node importance. However, this approach makes it difficult to ensure that the selected spreaders are dispersed in the network, which greatly affects the propagation ability. The VoteRank algorithm uses a voting-based method to identify nodes with strong propagation in the network, but there are some deficiencies. Here, we solve this problem by proposing the DILVoteRank algorithm. The VoteRank algorithm cannot properly reflect the importance of nodes in the network topology. Based on this, we redefine the initial voting ability of nodes in the VoteRank algorithm and introduce the degree and importance of the line (DIL) ranking method to calculate the voting score so that the algorithm can better reflect the importance of nodes in the network structure. In addition, the weakening mechanism of the VoteRank algorithm only weakens the information of neighboring nodes of the selected nodes, which does not guarantee that the identified initial spreaders are sufficiently dispersed in the network. On this basis, we consider all the neighbors nodes of the node’s nearest and next nearest neighbors, so that the crucial spreaders identified by our algorithm are more widely distributed in the network with the same initial node ratio. In order to test the algorithm performance, we simulate the DILVoteRank algorithm with six other benchmark algorithms in 12 real-world network datasets based on two propagation dynamics model. The experimental results show that our algorithm identifies spreaders that achieve stronger propagation ability and propagation scale and with more stability compared to other benchmark algorithms.
Introduction
Along with the rapid development of information technology, high-speed networking is increasingly important to human society, and systems in many fields are abstracted as complex networks for research [1, 2]. Many aspects of our lives are covered by a large number of complex networks, such as power networks [3], transportation networks [4], and trade networks [5]. On the one hand, the research applications of complex networks in different fields have greatly facilitated our lives. Biomolecular networks [6] analyze the structure of intermolecular networks and help us understand the relationship between network structures and functions. Social networks [7] are analyzed in an effort to explain social phenomena in psychology and economics and to reveal influential individuals and their effect on others. Online trading networks [8] are used to target advertisements and products to interested groups through complex network community segmentation. On the other hand, the study of critical nodes in complex networks can help people to predict and prevent risk. The normal operation of many systems is greatly affected by a small number of critical nodes [9–12]. In the last decade or so, large-scale grid blackouts have occurred in nine countries around the world, and the maintenance of some critical nodes in power networks will effectively improve their resistance to destruction and the robustness of the network [13, 14]. On the basis of propagation dynamics [15], after the identification of key nodes in social networks, the spread of epidemics [16, 17] and rumors [18] can be effectively predicted. In the context of the global spread of COVID-19, research on controlling the spread of viruses has received extensive attention from various countries around the world.
Identifying the influential spreaders in complex networks is significant for improving the system’s resistance to destruction and preventing the spread of diseases and rumors. This task is known as the influence maximization (IM) problem. The IM problem is defined as sending information to a small group of nodes in the network, which ultimately maximizes the range of information dissemination. Many algorithms have been proposed to solve the IM problem. One method is to evaluate the node importance by metrics and select the top k nodes as the initial spreaders. In the early days, many classic ranking methods were proposed, such as the degree centrality [19], betweenness centrality [20], closeness centrality [21], eigenvector centrality [22], K-shell [23], and h-index [24]. The degree centrality is the most basic local evaluation method, in that it merely takes the number of neighboring nodes into consideration, but fails to reflect the importance of the nodes properly. Many researchers have proposed new methods based on the degree centrality. Chen et al. [25] proposed a semi-local method based on the degree information of nodes and their direct neighbors. Liu et al. [26] proposed an evaluation method using degree information to calculate the importance of nodes and edges, called the DIL method, which can better identify the bridge nodes. Ren et al. [27] combined degree and clustering coefficient information to evaluate node importance. Methods based on the global information of the networks, such as the betweenness centrality and closeness centrality, need to calculate the shortest path based on the global network. This renders the algorithm quite complex and, in large networks, generates an unbearable amount of computation [26]. The K-shell method was proposed by Kitsak et al. [23] to divide nodes into layers according to their locations, but this method is insufficiently hierarchical. Liu et al. [28] argued that important nodes are closer to the center of the network. They distinguished the importance of nodes at the same level by calculating the distance between a node and the nodes with the largest K-core value in the network. Wang et al. [29] proposed an improve K-shell method to distinguish nodes at the same level by information entropy. Yeruva et al. [30] proposed the Pareto-shell decomposition method using a Pareto front function based on the K-shell algorithm. Bae et al. [31] proposed the neighborhood coreness (NC) and extended neighborhood coreness (ENC) based on the K-core value of nodes and their neighbors. The h-index method was first proposed by Hirsch et al. [24] as a method to measure the research influence of scientists. Lü et al. [32] proposed a method to evaluate the importance of nodes based on a combination of the degree, h-index, and coreness methods. Liu et al. [33] proposed the local h-index method, by taking the h-index value of neighbors into consideration. With the in-depth study of complex networks, researchers have proposed more efficient methods to find important nodes in networks, such as PageRank [34, 35], LeaderRank [36], and other algorithms based on random walks. Qian et al. [37] proposed a new measure of node importance by utilizing a redefined entropy centrality model. Sheikhahmadi et al. [38] proposed the MCDE method by mixing the core value, degree centrality, and entropy of nodes together.
The above ranking algorithms solve the IM problem by identifying key nodes in the network, but they cannot guarantee that the selected nodes are widely distributed in the network. In the process of maximizing the spread of influence, it is often necessary to identify a set of spreaders, and it is desirable that these spreaders are sufficiently dispersed in the network so that the nodes achieve the maximum coverage of the network during the spread. Zeng et al. [39] verified that the distance between the spreaders in a network has a crucial influence on influence maximization. This provides a new way of thinking about the IM problem: selecting influential nodes widely distributed in the network. Zhang et al. [40] proposed a novel method based on a voting mechanism, called VoteRank, to select decentralized critical nodes in the network which the initial spreaders filtered out are more widely distributed, and avoid leading to an unnecessary waste of time and influence. Sun et al. [41] proposed an extension to VoteRank for weighted networks, called WVoteRank. Kumar et al. [42] argued that the node voting ability needs to reflect the position of the node in the network and introduced neighborhood coreness to optimize the VoteRank algorithm; their optimized algorithm is called NCVoteRank. Guo et al. [43] proposed the EnRenew algorithm, which uses the node information entropy as the node voting ability.
The VoteRank algorithm puts forward a new approach to solve the IM problem in the above studies, but the algorithm also has some flaws. First, the VoteRank algorithm treats the initial voting ability of all nodes in the network as the same and does not differentiate between nodes based on their importance. Second, in the voting process, the node scores are obtained only by summing up the voting ability of the neighbors, which fails to reflect the contribution of different neighbors. In Addition, the VoteRank algorithm weakens the voting ability of only the nearest neighbors after selecting the winning node in each round, which does not take into account the effect of non-directly connected nodes and does not guarantee that the identified spreaders are widely distributed in the network.
In response to the above shortcomings, some scholars have made partial improvements. The EnRenew algorithm uses the information entropy as the initial voting ability of a node, but does not propose improvements to calculating the node’s voting score. The NCVoteRank algorithm treats the initial voting ability of nodes as the same and introduces the NC value of nodes in the calculation process of node scores for improvement. However, the NC value does not better reflect the importance of the nodes in the network. To address the above issues, we propose an improved algorithm of VoteRank called DILVoteRank, the main improvements were made as follows:
(i) The initial voting ability of a node is redefined using the degree value, so that the initial voting ability of a node can reflect the importance of the node to some extent.
(ii) The calculation of the node voting score in the VoteRank algorithm is improved by introducing the DIL method, which better reflects the importance of the node in the network local, making the node identified by the improved algorithm have more influence on the network.
(iii) The weakening mechanism of the VoteRank algorithm is optimized to weaken the nearest and next nearest neighbors’ information of the nodes selected in each round of voting, so that the initial spreaders selected by our method are more widely distributed in the network, so that a larger propagation range is achieved in the network.
In the experimental part of this paper, we first compare the DIL method with other different types of traditional importance ranking methods, comparing the computational complexity of the different methods and the correlation with the ranking results obtained by using the node deletion method (NDM) to demonstrate the superiority of the DIL method in reflecting the importance of nodes. Afterwards, we compare our DILVoteRank algorithm with other benchmark algorithms using 12 real datasets under the SIR model and linear threshold model. The experimental results demonstrate that the DILVoteRank algorithm outperforms other benchmark algorithms in terms of both propagation speed and propagation size, as well as stability.
The framework of this paper is as follows. Section 2 reviews some related works. Section 3 describes the steps of the proposed algorithm and the main innovation points. Section 4 presents the performance metrics chosen for the experiment in this paper. Section 5 provides the experimental results and discusses them, and Section 6 concludes the paper.
Related work
There are many methods to evaluate the importance of nodes. A relatively simple method is to use the degree centrality, which considers nodes with more neighbors to be more important than those with fewer neighbors. However, in some cases, nodes located in the center of the network do not necessarily have a high degree value [25, 26]. Therefore, many novel and valid methods have been proposed to evaluate the importance of nodes. In this section, we present some effective methods for evaluating node importance in complex networks, as well as a brief description of the VoteRank algorithm and its improvements.
Assuming that an undirected and unweighted complex network can be characterized as
Semi-local method
The semi-local centrality was a method proposed by Chen [25] to evaluate the importance of nodes by considering the number of nearest and next-nearest neighbors, by weighing the low relevance of degree centrality and the large calculating complexity of global methods. The local centrality
where
DIL method
Liu et al. [26] proposed a new method, called the DIL method, which computes the importance of a node by using the degree centrality and the importance of lines. This method initially considers that the importance of the edges in the network as being proportional to the connectivity of the edges and inversely proportional to the alternative ability of the connected nodes. For example, if edge
where
Then the importance of node
Nodes with larger
NC method
Bae et al. [31] argued that important nodes have more neighbors located at the center of the network, and proposed NC by taking the K-core value of neighbors into consideration:
where
where
VoteRank algorithm
Zhang et al. [40] proposed the VoteRank algorithm, based on a voting mechanism, to select the most influential nodes based on the scores of the nodes in each round of voting. Each node in the network contains two attributes,
Step 1: Initialize. Initialize the voting score
Step 2: Vote. In this phase, each node votes on their neighbors, and each receives all votes from its neighbors. The voting score of a node
Step 3: Select. The node with the highest voting score is selected based on the results of the current round of voting. The selected node
Step 4: Update. In order to make the selected nodes as diffuse as possible, the voting ability of the selected node’s neighbors needs to be diminished. The diminished node voting ability can be defined as:
where
Step 5: Repeat. Repeat the process from Steps 2 to 4 until the top k initial spreaders are filtered out.
NCVoteRank algorithm
Kumar et al. [42] argued that the voting ability of nodes should be distinguished based on the topological location of nodes in the network. Therefore, they proposed the NCVoteRank algorithm to improve the voting ability of nodes by considering the neighborhood coreness value of nodes, which is obtained by calculating the node coreness value by Eq. 6. The NCVoteRank algorithm also first initializes the voting ability
where
EnRenew algorithm
Inspired by the VoteRank algorithm, Guo et al. [43] argued that node information entropy better reflects the position of nodes in the network. Their EnRenew algorithm thus uses the node information entropy as the initial propagation ability of a node. The node information entropy can be calculated by:
where
where
Proposed work
The VoteRank algorithm selects influential nodes in complex networks by using a voting mechanism. In the traditional VoteRank algorithm, however, the initial voting ability of nodes is set to be the same, and the score contributions of nodes to their neighbors are their own voting ability. To a certain extent, then, the final score of the nodes has a greater correlation with the degree index of the nodes. We believe that a more suitable node-importance method should be used to improve the VoteRank algorithm—one that better reflects the position of the nodes in the network topology during the voting process. Therefore, we propose an algorithm called DILVoteRank to identify the key nodes in the network. We improve the VoteRank algorithm in different aspects, and the following are the specific details for the proposed DILVoteRank.
Algorithm steps
The DILVoteRank algorithm proceeds as follows:
(i) Calculating the local importance of nodes. The local importance of nodes
where
(ii) Initialize node score and voting ability. We consider that the voting ability is related to the degree of the node. In this phase, the node voting score is initialized to 0, and the voting ability
where
(iii) Voting phase. In the voting phase, each node receives votes from its neighbors, and sends votes to the neighbors that voted for them. The score of the current round for each node can be calculated as:
To better reflect the local importance indicators of nodes, we use the homotopy function
(iv) Update node attribute values. Firstly, the node with the top voting score in this round is selected, and its voting ability is set to 0. We assume that node
where
(v) Iteration phase. Repeat Steps (iii) to (iv) until the top k initial spreaders are selected.
Algorithm description and complexity analysis
The detailed procedure for DILVoteRank is shown in Algorithm 1.
Algorithm 1. DILVoteRank
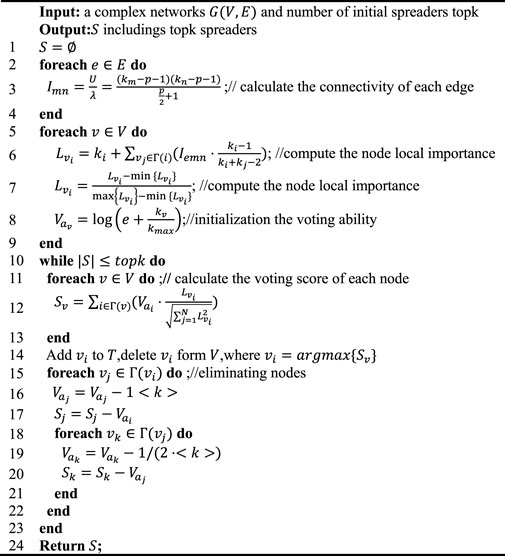
In lines 2–4, we calculate the connectivity of each edge in the network. We use n and m to denote the number of nodes and edges in the network, respectively. The time complexity of this process is O(m), according to Eq. 3. In lines 5–9, we calculate the local importance of nodes and initialize voting ability. In line 6, we consider the neighbors of all nodes during the calculation, so the time complexity is O(n<k>), where <k> represents the average degree of the network, <k ≥ 2m/n. In lines 11–22, we first calculate the voting scores of all nodes and choose the nodes with the highest scores as the selected nodes. Then, we update the attributes values of the nearest and the next-nearest neighbors. This process needs to be repeated s times, where s indicates the number of initial spreaders. So the time complexity of this process is O(sn<k > 2). In summary, the computational complexity of the algorithm is O(m + n <k> + sn<k > 2), which can be expressed as O(n <k> + sn<k > 2). Since the value of s is much smaller than n, the complexity of the algorithm can be eventually approximated as O(n<k > 2).
Example explanation
In this section, we use a small example network, shown in Figure 1, as an illustration to demonstrate the DILVoteRank algorithm in detail, which has also been adopted by other scholars [29, 44]. In Figure 1, the node colors are labeled according to the degree of the nodes. After the first round of voting, the results of node local importance
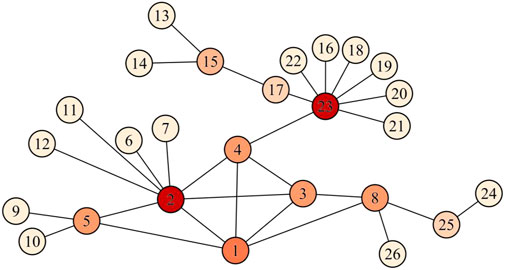
FIGURE 1. An example network to explain DILVoteRank algorithm.
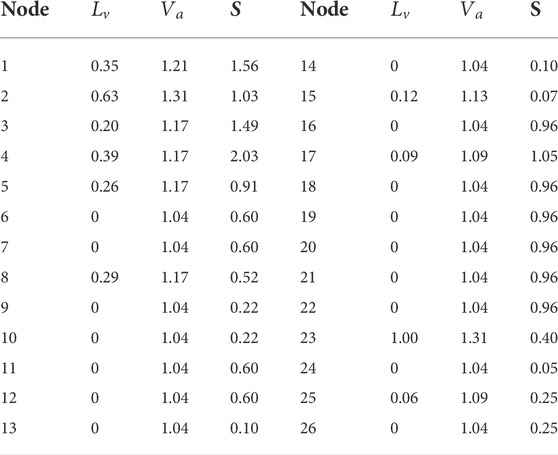
TABLE 1. The importance of the nodes calculated by DIL
Performance metrics
Evaluating different ranking methods
There are two approaches to evaluating the accuracy of nodes selected by different algorithms [45]. One is based on the propagation dynamics model, with the selected node as the propagation source. The propagation process is simulated in the model and analyzed by the initial node influence range. The other approach is based on the NDM, in which the importance of a node is judged by the effectiveness of the network after its deletion. The method based on propagation dynamics can more intuitively simulate the transmission process of information in the network, and has less computational complexity than the NDM. It has become the main method to evaluate the accuracy of the identification results of different algorithms. Therefore, this paper adopts two widely used propagation dynamics evaluation models, and uses the NDM to evaluate the performance of different algorithms. The details of the above methods are described as follows.
Susceptible, infected, recovered model
The susceptible, infected, recovered (SIR) model [46] offers accurate evaluations of the propagation ability of initial spreaders selected by different algorithms by simulating the propagation process of viruses, information, etc. in a network. This model is an effective tool for evaluating complex-network ranking methods by virtue of its operability and applicability to large networks. In the SIR model, nodes are divided into three categories: susceptible nodes (S), infected nodes (I), and recovered nodes (R). In the starting phase, a small portion of nodes in the network are selected as infected nodes, which are in state I, and other nodes are set as susceptible nodes, in state S. During each subsequent iteration step, the infected nodes have the ability to transform the susceptible nodes in their neighboring nodes into infected nodes, with probability
Under the SIR model, in each iteration step, infected nodes infect neighboring susceptible nodes to achieve propagation in the network. At the same time, infected nodes have a certain probability of becoming recovered nodes in the propagation process, so the number of infected nodes in the network will gradually increase with time and then decrease. When the number of infected nodes decreases to 0, only susceptible nodes and recovered nodes are left in the network and the network stops spreading. Based on this, we can use
where
where
Linear threshold model
The linear threshold (LT) model [44] is also an evaluation model based on propagation dynamics, which is different from the SIR model in terms of propagation mechanism. In the LT model, each node in the network has two states of active and inactive, and an activation probability
Network efficiency
Through the NDM, we can calculate the proportion of the decrease in network efficiency after the deletion of nodes and effectively evaluate the importance of nodes. Network efficiency reflects the connectivity of the network: the higher the network efficiency, the closer the network is connected and the more quickly information can spread in the network. The network efficiency
where
where
Network efficiency can be used to evaluate not only the importance of individual nodes but also the importance of a certain set of nodes. However, the network efficiency requires the shortest path algorithm in the calculation process, which has high computational complexity and is therefore unsuitable for node evaluations of large networks.
Correlation coefficient
Based on the network efficiency, the NDM can produce a convincing ranking of node importance. However, the shortest path algorithm is required to calculate the network efficiency, and the computational complexity is nonlinearly related to the number of nodes, which is not applicable to large network structures. Therefore, this method is not generally used to solve IM problems in real networks, although the calculation results of this method can provide a better reference for evaluating other algorithms. Calculating the correlation between the ranking derived from different algorithms and the ranking based on the NDM can be used to evaluate the performance of the algorithms. There are many coefficients used in statistics to measure the correlation of variables, such as the Pearson, Spearman, and Kendall correlation coefficients, and the selection of appropriate evaluation coefficients according to the type and distribution of variables can make the results more reliable. The Spearman correlation and Kendall correlation are more suitable for the correlation evaluation of ranking algorithms.
Spearman correlation coefficient for ranking data
The Spearman rank correlation coefficient is widely used to evaluate the correlation between two different indicator rankings. It is calculated based on the difference between the different indicator ranking levels, which can be expressed as:
where
Kendall correlation coefficient
The Kendall correlation is significantly different from the Spearman correlation. The Kendall correlation classifies all node pairs in the network into concordant pairs and discordant pairs, and evaluates the relevance of different ranking methods by the number of different types of node pairs. For any node pair
where
Average distance between spreaders (
The average distance is an important index to evaluate the dispersion of the initial spreaders, which has an important impact on maximizing influence. With the limited number of initially selected nodes, we want the selected nodes to be as dispersed as possible in the network to improve the coverage area during propagation. In most real networks, the node distribution shows the phenomenon of community aggregation [47], and if the selected spreaders are too concentrated, it is difficult to spread the information to other communities effectively. The average shortest path can be found by the distance between any two nodes in the node set, which is calculated as follows:
where
Datasets and result analysis
In this section, to verify the performance of DILVoteRank compared to other benchmark algorithms, we first compare the DIL with other node-importance evaluation methods to illustrate the superiority of the DIL method at reflecting the importance of nodes. Second, we compare DILVoteRank with other algorithms in a real-world network based on the SIR model in a dataset and analyze the experimental results.
DIL compared with other centralities
In this section, we use six node-importance ranking methods—the betweenness centrality (BC), closeness centrality (CC), semi-local centrality (SL), DIL, NC, and ENC—and the NDM to rank the nodes in the network of Figure 1. The ranking results are shown in Table 2. The nodes in this table are sorted according to the results of the NDM. Table 3 shows the categories, the computational complexity, the Spearman correlation
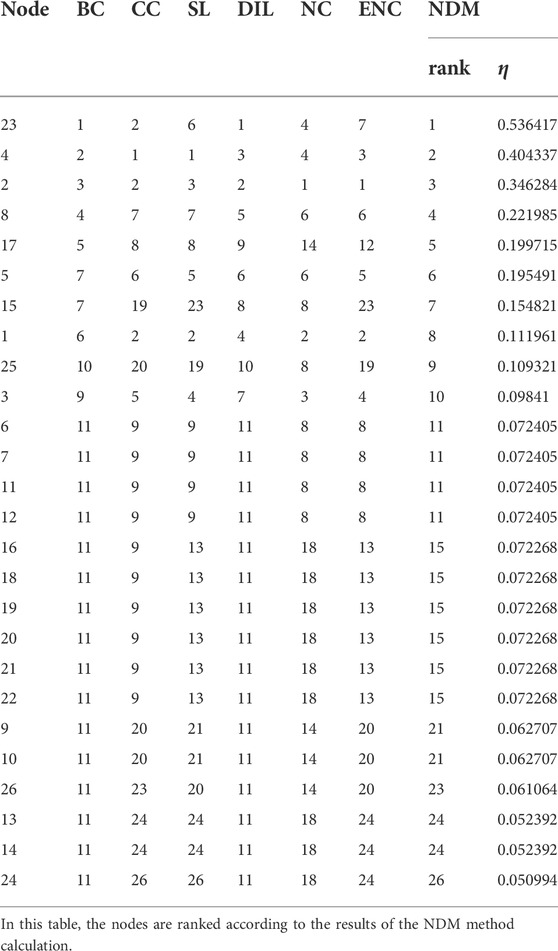
TABLE 2. The ranking of the nodes in the example network is calculated by the BC, CC, SL, DIL, NC, and ENC methods, as well as by the ranking of the nodes and the rate of decrease in the efficiency of the network after node deletion using the NDM.
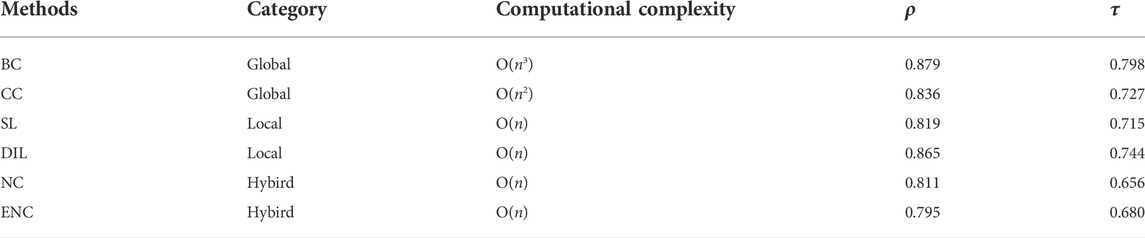
TABLE 3. Categories and computational complexity of the six methods and their correlation coefficients of the ranking results using the NDM method, where
From the results of the correlation coefficients in Table 3, the correlation between DIL and the NDM is better than the other methods (except the BC method) in both correlation indexes. In terms of computational complexity, the BC and CC methods calculate the importance of nodes through the global information of the network, and the computational complexity is much higher than the other four algorithms, such that the computational burden is unfeasible for large networks. The DIL method is based exclusively on the local information of the nodes in the network, and the computational complexity is linearly correlated with the number of nodes in the network. Compared to other methods of the same complexity, the DIL method has the greatest correlation with the sorting results of the NDM, and even outperforms the CC method, which is much more complex than the DIL method. From the above results, it can be seen that the DIL algorithm can evaluate the local importance of nodes in the network more accurately by virtue of less computational complexity.
Data description
To test the performance of the algorithm, we performed operations using 12 real network datasets, selected with different data sizes and data sources. These datasets are frequently used in research on complex networks. The following is a description of the datasets used for the tests. 1) Karate: a small social network dataset containing interpersonal relationships and interconnections among 34 members of the Karate Club of America [48]. 2) Dolphin: an undirected social network that portrays the interactions and community distribution of 62 dolphins [49]. 3) Jazz Music: this dataset contains the interactions of a network of jazz musicians [50]. 4) CEnew: a biological metabolic network [51]. 5) Email: a network of email exchanges among members of Rovira i Virgili University [52]. 6) Netscience: a coauthorship network of scientists working on network theory and experiments [53]. 7) USAir: a network of the US air transportation system in 2010 [54]. 8) Hamster: a friendship network between users of the website hamsterster.com [55]. 9) Facebook Social: a crowd-sourced dataset containing information about the social circles of Facebook users [56]. 10) Power: a power grid network in the USA [57]. 11) Astro-ph: a collaboration network of scientists posting preprints on the astrophysics archive at www.arxiv.org [58]. 12) Cond-Mat: a coauthorship network between researchers on the topic of condensed matter [54]. Some of their basic network properties are listed in Table 4.

TABLE 4. Basic characteristics of the 12 complex network datasets, where <k> denotes the average degree of the network, and
Comparison with benchmark algorithms
In this part, we compare the DILVoteRank algorithm with six benchmark algorithms—DC, DIL, K-shell, VoteRank, EnRenew, and NCVoteRank—in real networks to test the performance of different algorithms under different experimental conditions and evaluation metrics. Figure 2 shows the network infection scale
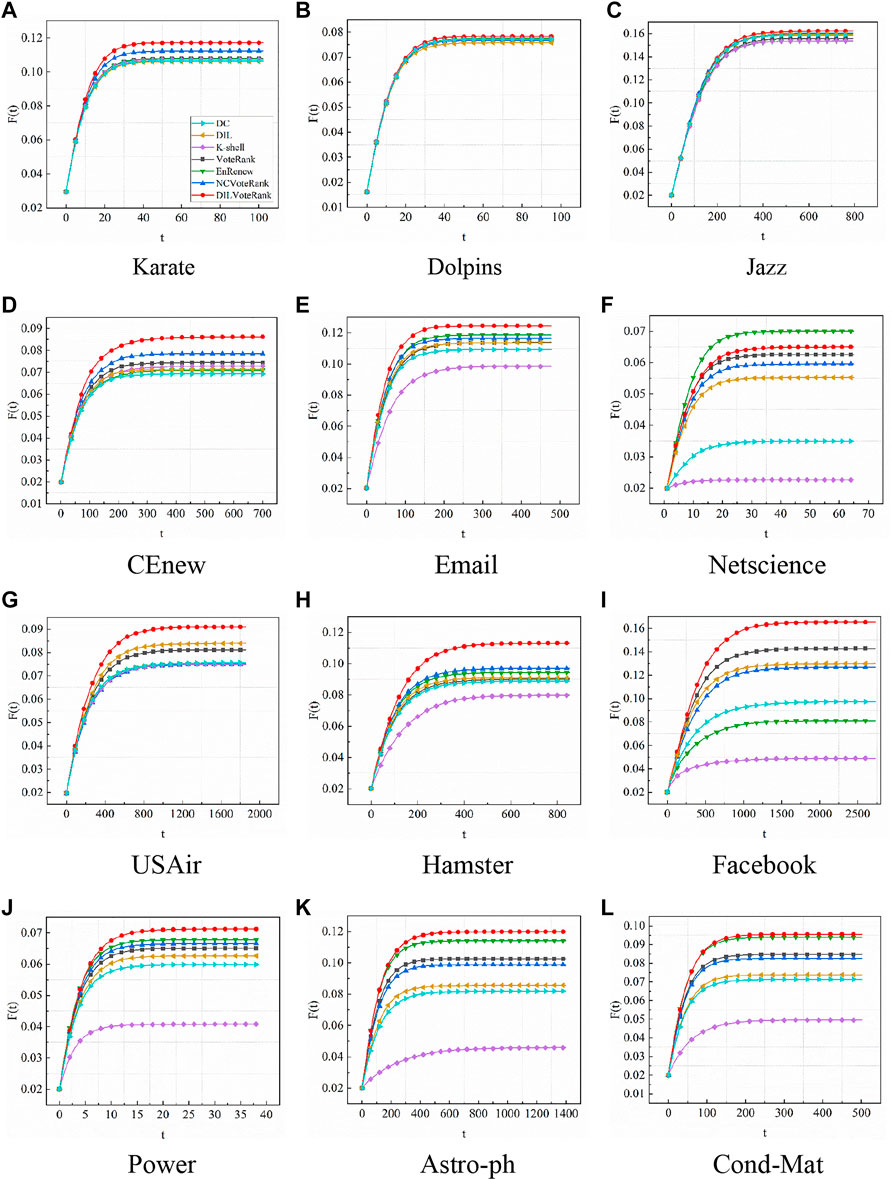
FIGURE 2. The infection scale
We selected three node-importance-based ranking algorithms, DC, DIL, and K-shell, as references in our experiments. From the experimental results, compared to other algorithms based on voting mechanisms, the performance of these three algorithms is poor. This may be due to the fact that these three algorithms rely excessively on the nodes’ own information, and the selected nodes do not surely have high propagation ability in the global network. Further, these algorithms are based on the local information of the nodes and ignore the weakening of the importance of the surrounding nodes of the selected node in the process of node selection, thus causing the initial set of nodes to have a high clustering coefficient. In particular, the K-shell algorithm is more susceptible to the rich club phenomenon, which is detrimental to the propagation of the initial nodes in the network [38]. Algorithms based on voting mechanisms weaken the voting ability of the neighbors of selected nodes to reduce the aggregation of the initial spreaders, and therefore have better performance in the experiments.
Figure 3 shows the variation curve of the final infection scale with the initial infected node ratio. The results of this experiment take the average of 1,000 calculations, with the infected rate
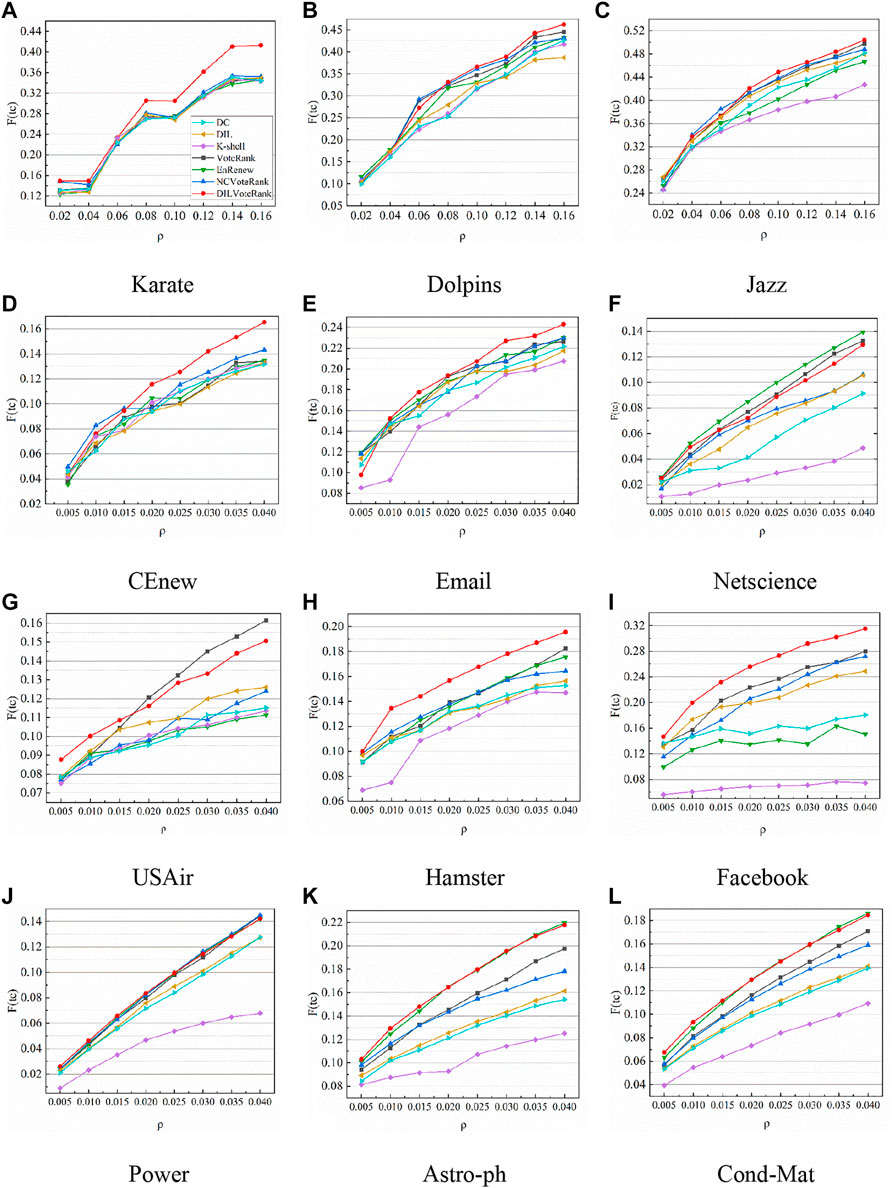
FIGURE 3. The variation curve of the final infection scale with the initial infected node ratio, the results of this experiment take the average of 1,000 calculations, set the infected rate
In the SIR model, the node infection rate
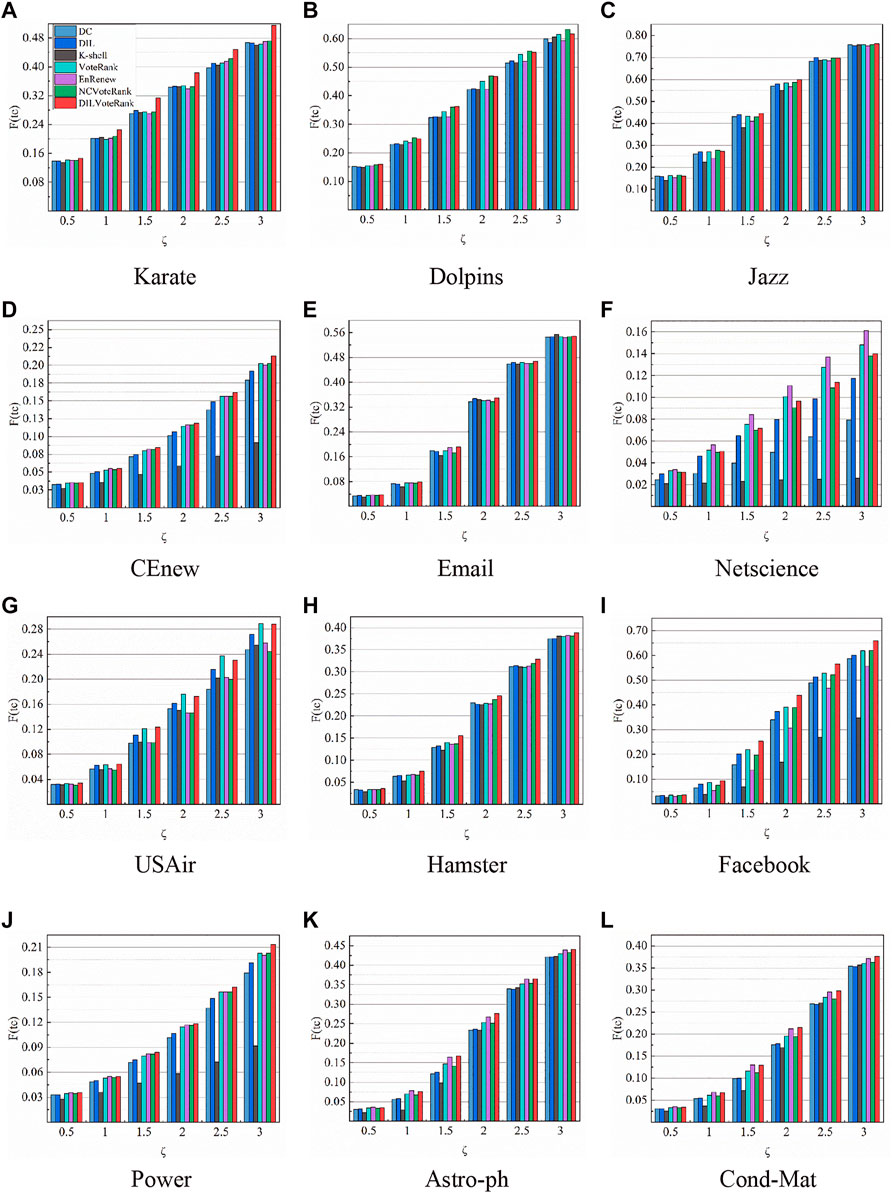
FIGURE 4. The distribution of the final infection size of the network with different infection rates. The average of the results of 1,000 runs was calculated by setting the proportion of initial nodes
In addition to using the SIR model, we also use the LT model to evaluate the propagation ability of nodes. Figure 5 shows the change curve of the number of activated nodes in the stable stage with different initial node proportions. The experimental results are the average of 1,000 simulations. As can be seen from the figure, except in Netscience, the DILVoteRank algorithm outperforms other algorithms in 11 other network datasets. The simulation results in the LT model are consistent with the evaluation results of the SIR model in Figure 2, which once again verifies that the nodes identified by the DILVoteRank algorithm have stronger propagation ability.
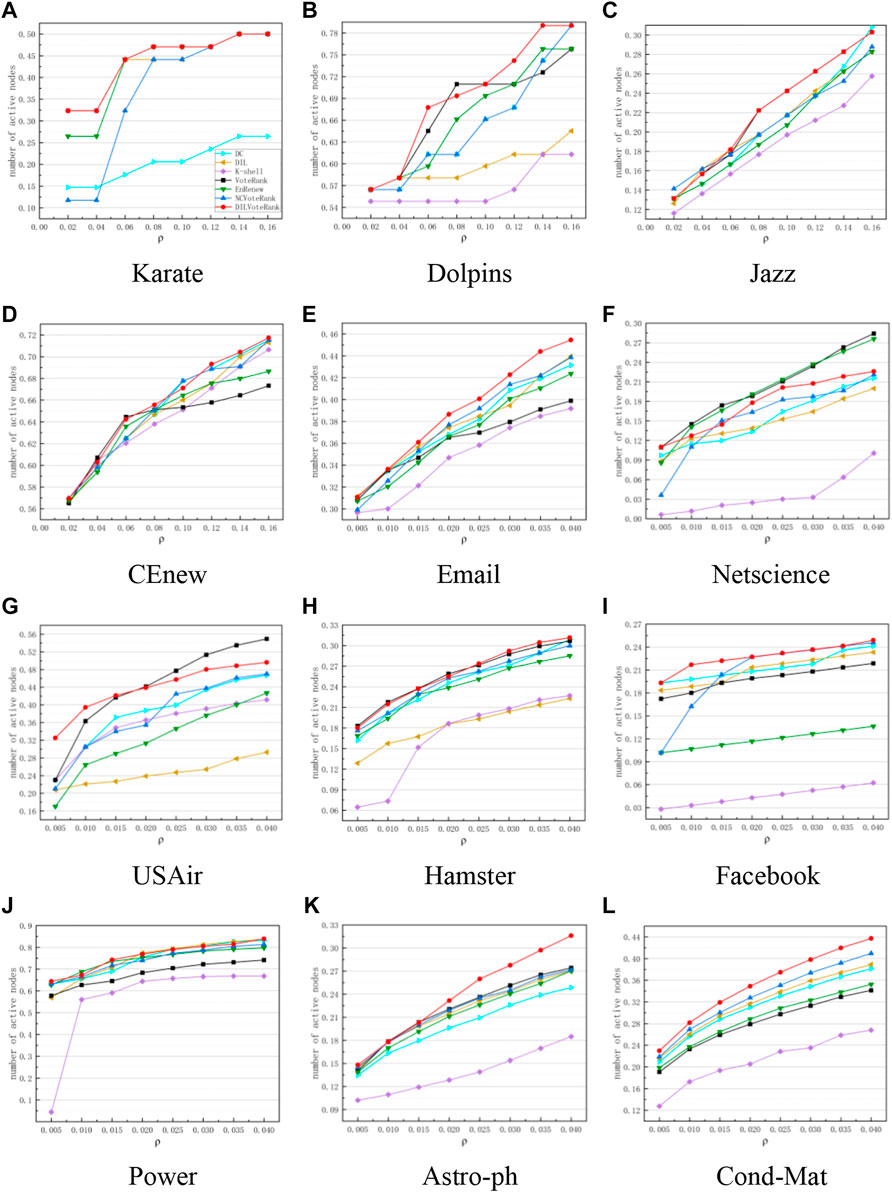
FIGURE 5. The change curve of the number of activated nodes in the stable stage with different initial node proportions, the experimental results are the average of 1,000 simulations. Subgraphs (A–L) respectively represent the experimental results of 12 datasets in Table 4.
By the way, in the two propagation models, the ratio of the number of propagated nodes to the total number of nodes in the network is the most important indicator to measure the propagation ability of the node. The larger the ratio, the stronger the propagation ability of the node. Figures 3, 5 respectively describe the variation curve of the propagation scale with the proportion of initial nodes based on two different propagation models. As can be seen from both sets of graphs, the algorithms performance ranking changes continuously with the proportion of initial nodes, and there are also differences in different networks. This may be because each network has differences in community distribution, aggregation degree, degree distribution, etc., and different algorithms have different ideas and optimization indicators, therefore, the performance of the algorithm varies with the change of the initial node ratio and the network. In general, under the influence of the above two factors, the DILVoteRank algorithm can maintain better performance in most cases than other algorithms, which shows stronger applicability and stability.
Figure 6 shows the shortest paths between spreaders selected by different algorithms with different initial proportions. The average shortest path of the initial spreaders considerably influences network propagation, and we want the selected initial nodes to be distributed as widely as possible in different communities so as to reach the maximum coverage area of the network. This can be evaluated by the average shortest path of the initial node set. From Figure 6, we can see that the set of nodes selected by the DILVoteRank algorithm always achieves a larger average shortest path in different networks. In CEnew, Email, Hamster, Facebook, and Cond-Mat, our proposed algorithm has an obvious advantage over other algorithms, which means that the node set selected by the DILVoteRank algorithm has a wider distribution in the network. This further indicates that the node set selected by the algorithm has superior propagation ability.
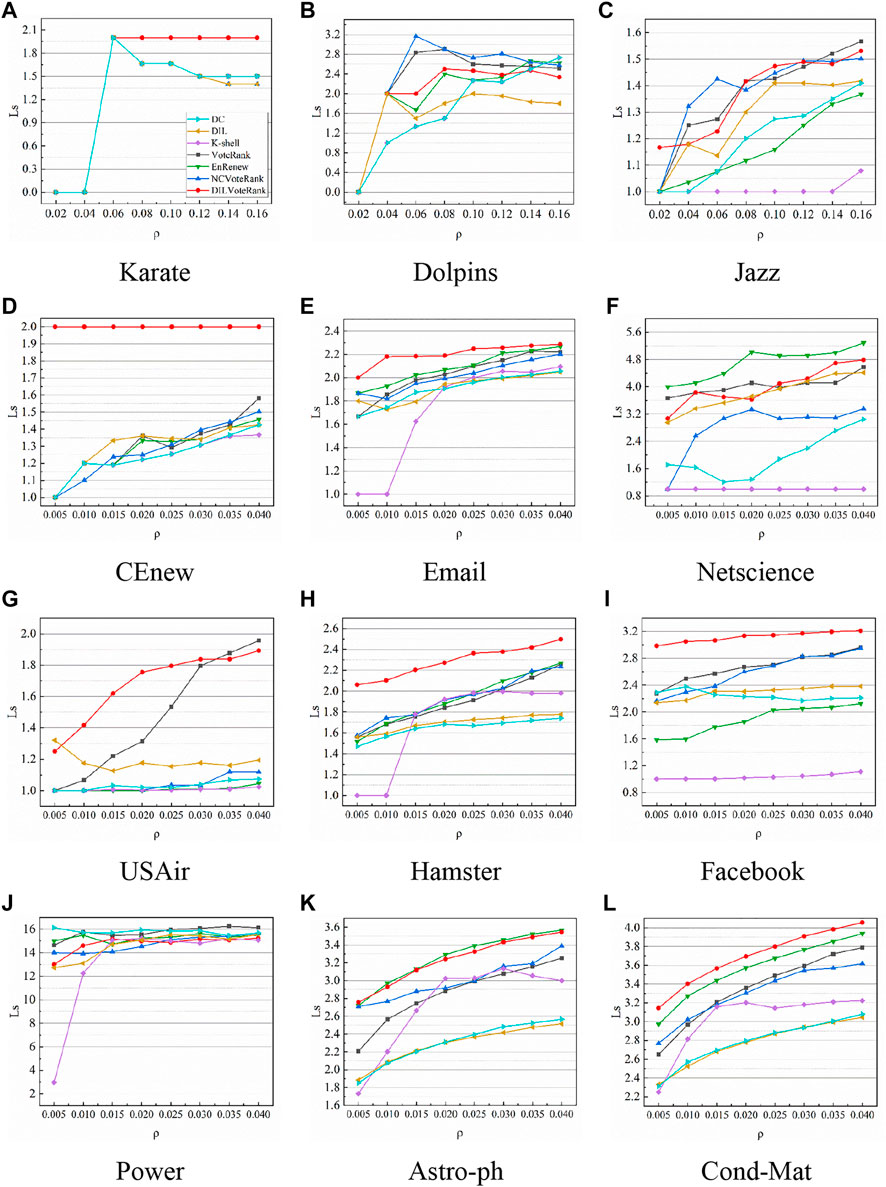
FIGURE 6. The shortest paths between spreaders selected by different algorithms, with different initial proportions. Subgraphs (A–L) respectively represent the experimental results of 12 datasets in Table 4.
The propagation ability of nodes depends on its importance and dispersion in the network. Therefore, the
Conclusion
In this paper, we proposed an algorithm called DILVoteRank that selects spreaders with stronger propagation ability in complex networks. The algorithm uses a voting mechanism to determine the influence of nodes in the order in which they are selected from voting. In this algorithm, we believe that the voting ability of nodes in the voting process should reflect the local importance of the nodes to some extent, rather than treating all nodes the same. For this reason, we selected the DIL as the initial metric to evaluate the importance of nodes. We compared the DIL method with other methods and found that the DIL reflects the importance of nodes in the network more accurately and with less computational complexity than other algorithms. Then, we optimized the node voting ability based on the local importance of nodes calculated by the DIL method. The propagation was simulated in 12 real network datasets based on the SIR model and LT model. The experimental results showed that the proposed DILVoteRank algorithm outperformed other algorithms in terms of the propagation rate, propagation scale, and algorithm stability in different propagation conditions and datasets. Furthermore, we confirmed that the initial spreaders selected by the DILVoteRank algorithm have excellent propagation ability. As such, our algorithm has application value for finding influential nodes in networks, preventing the spread of diseases and rumors, and improving the anti-destructive properties of network systems.
Data availability statement
Publicly available datasets were analyzed in this study. This data can be found here: https://networkrepository.com/index.php.
Author contributions
YL and XY performed the analysis. XY validated the analysis and drafted the manuscript. XZ reviewed the manuscript. MX and XL designed the research. All authors have read and approved the content of the manuscript.
Funding
This work was financially supported by regional foundation of the National Natural Science Foundation of China (No.12171481).
Conflict of interest
The authors declare that the research was conducted in the absence of any commercial or financial relationships that could be construed as a potential conflict of interest.
Publisher’s note
All claims expressed in this article are solely those of the authors and do not necessarily represent those of their affiliated organizations, or those of the publisher, the editors and the reviewers. Any product that may be evaluated in this article, or claim that may be made by its manufacturer, is not guaranteed or endorsed by the publisher.
References
2. Bai Y, Li Q, Fan Y, Liu S. Motif-h: a novel functional backbone extraction for directed networks. Complex Intell Syst (2021) 7(6):3277–87. doi:10.1007/s40747-021-00530-7
3. Haynes TW, Hedetniemi SM, Hedetniemi ST, Henning MA. Domination in graphs applied to electric power networks. SIAM J Discret Math (2002) 15(4):519–29. doi:10.1137/s0895480100375831
4. Banavar JR, Maritan A, Rinaldo A. Size and form in efficient transportation networks. nature (1999) 399(6732):130–2. doi:10.1038/20144
5. Chapman D, Purse BV, Roy HE, Bullock JM. Global trade networks determine the distribution of invasive non‐native species. Glob Ecol Biogeogr (2017) 26(8):907–17. doi:10.1111/geb.12599
6. Chakrabarty B, Parekh N. Naps: network analysis of protein structures. Nucleic Acids Res (2016) 44(W1):W375–82. doi:10.1093/nar/gkw383
7. Borgatti SP, Mehra A, Brass DJ, Labianca G. Network analysis in the social sciences. science (2009) 323(5916):892–5. doi:10.1126/science.1165821
8. Leskovec J, Adamic LA, Huberman BA. The dynamics of viral marketing. ACM Trans Web (2007) 1(1):5. doi:10.1145/1232722.1232727
9. Albert R, Jeong H, Barabási A-L. Error and attack tolerance of complex networks. nature (2000) 406(6794):378–82. doi:10.1038/35019019
10. Buldyrev SV, Parshani R, Paul G, Stanley HE, Havlin S. Catastrophic cascade of failures in interdependent networks. nature (2010) 464(7291):1025–8. doi:10.1038/nature08932
11. Crucitti P, Latora V, Marchiori M. Model for cascading failures in complex networks. Phys Rev E (2004) 69(4):045104. doi:10.1103/physreve.69.045104
12. Watts DJ. A simple model of global cascades on random networks, the Structure and Dynamics of Networks. Princeton New jersey, United State: Princeton University Press (2011). 497–502.
13. Carreras BA, Lynch VE, Dobson I, Newman DE. Critical points and transitions in an electric power transmission model for cascading failure blackouts. Chaos (2002) 12(4):985–94. doi:10.1063/1.1505810
14. Kinney R, Crucitti P, Albert R, Latora V. Modeling cascading failures in the North American power grid. Eur Phys J B (2005) 46(1):101–7. doi:10.1140/epjb/e2005-00237-9
15. Barrat A, Barthelemy M, Vespignani A. Dynamical processes on complex networks. Cambridge, United State: Cambridge University Press (2008).
16. Pastor-Satorras R, Castellano C, Van Mieghem P, Vespignani A. Epidemic processes in complex networks. Rev Mod Phys (2015) 87(3):925–79. doi:10.1103/revmodphys.87.925
17. Pastor-Satorras R, Vespignani A. Epidemic spreading in scale-free networks. Phys Rev Lett (2001) 86(14):3200–3. doi:10.1103/physrevlett.86.3200
18. Borge-Holthoefer J, Moreno Y. Absence of influential spreaders in rumor dynamics. Phys Rev E (2012) 85(2):026116. doi:10.1103/physreve.85.026116
19. Freeman LC. Centrality in social networks conceptual clarification. Social networks (1978) 1(3):215–39. doi:10.1016/0378-8733(78)90021-7
20. Freeman LC. A set of measures of centrality based on betweenness. Sociometry (1977) 40:35–41. doi:10.2307/3033543
21. Sabidussi G. The centrality index of a graph. Psychometrika (1966) 31(4):581–603. doi:10.1007/bf02289527
22. Bonacich P. Factoring and weighting approaches to status scores and clique identification. J Math Sociol (1972) 2(1):113–20. doi:10.1080/0022250x.1972.9989806
23. Kitsak M, Gallos LK, Havlin S, Liljeros F, Muchnik L, Stanley HE, et al. Identification of influential spreaders in complex networks. Nat Phys (2010) 6(11):888–93. doi:10.1038/nphys1746
24. Hirsch JE. An index to quantify an individual's scientific research output. Proc Natl Acad Sci U S A (2005) 102(46):16569–72. doi:10.1073/pnas.0507655102
25. Chen D, Lü L, Shang M-S, Zhang YC, Zhou T. Identifying influential nodes in complex networks. Physica A: Stat Mech its Appl (2012) 391(4):1777–87. doi:10.1016/j.physa.2011.09.017
26. Liu J, Xiong Q, Shi W, Shi X, Wang K. Evaluating the importance of nodes in complex networks. Physica A: Stat Mech its Appl (2016) 452:209–19. doi:10.1016/j.physa.2016.02.049
27. Ren Z-M, Shao F, Liu J-G, Guo Q, Wang B-H. Node importance measurement based on the degree and clustering coefficient information. Acta Phys Sin (2013) 62(12):128901. doi:10.7498/aps.62.128901
28. Liu J-G, Ren Z-M, Guo Q Ranking the spreading influence in complex networks. Physica A: Stat Mech its Appl (2013) 392(18):4154–9. doi:10.1016/j.physa.2013.04.037
29. Wang M, Li W, Guo Y, Peng X, Li Y. Identifying influential spreaders in complex networks based on improved k-shell method. Physica A: Stat Mech its Appl (2020) 554:124229–9. doi:10.1016/j.physa.2020.124229
30. Yeruva S, Devi T, Reddy YS. Selection of influential spreaders in complex networks using Pareto Shell decomposition. Physica A: Stat Mech its Appl (2016) 452:133–44. doi:10.1016/j.physa.2016.02.053
31. Bae J, Kim S. Identifying and ranking influential spreaders in complex networks by neighborhood coreness. Physica A: Stat Mech its Appl (2014) 395:549–59. doi:10.1016/j.physa.2013.10.047
32. Lü L, Zhou T, Zhang Q-M, Stanley HE. The H-index of a network node and its relation to degree and coreness. Nat Commun (2016) 7(1):10168–7. doi:10.1038/ncomms10168
33. Liu Q, Zhu Y-X, Jia Y, Deng L, Zhou B, Zhu JX, et al. Leveraging local h-index to identify and rank influential spreaders in networks. Physica A: Stat Mech its Appl (2018) 512:379–91. doi:10.1016/j.physa.2018.08.053
34. Bryan K, Leise T. The $25, 000, 000, 000 eigenvector: The linear algebra behind Google. SIAM Rev Soc Ind Appl Math (2006) 48(3):569–81. doi:10.1137/050623280
35. Ghoshal G, Barabási A-L. Ranking stability and super-stable nodes in complex networks. Nat Commun (2011) 2(1):394–7. doi:10.1038/ncomms1396
36. Li Q, Zhou T, Lü L, Chen D. Identifying influential spreaders by weighted LeaderRank. Physica A: Stat Mech its Appl (2014) 404:47–55. doi:10.1016/j.physa.2014.02.041
37. Qiao T, Shan W, Zhou C. How to identify the most powerful node in complex networks? A novel entropy centrality approach. Entropy (2017) 19(11):614. doi:10.3390/e19110614
38. Sheikhahmadi A, Nematbakhsh MA. Identification of multi-spreader users in social networks for viral marketing. J Inf Sci (2017) 43(3):412–23. doi:10.1177/0165551516644171
39. Zeng A, Zhang C-J. Ranking spreaders by decomposing complex networks. Phys Lett A (2013) 377(14):1031–5. doi:10.1016/j.physleta.2013.02.039
40. Zhang J-X, Chen D-B, Dong Q, Zhao ZD. Identifying a set of influential spreaders in complex networks. Sci Rep (2016) 6:27823. doi:10.1038/srep27823
41. Sun H-L, Chen D-B, He J-L, Ch’ng E. A voting approach to uncover multiple influential spreaders on weighted networks. Physica A: Stat Mech its Appl (2019) 519:303–12. doi:10.1016/j.physa.2018.12.001
42. Kumar S, Panda B, Applications I. Identifying influential nodes in Social Networks: Neighborhood Coreness based voting approach. Physica A: Stat Mech its Appl (2020) 553:124215. doi:10.1016/j.physa.2020.124215
43. Guo C, Yang L, Chen X, Chen D, Gao H, Ma J. Influential nodes identification in complex networks via information entropy. Entropy (2020) 22(2):242. doi:10.3390/e22020242
44. Liu P, Li L, Fang S, Yao Y. Identifying influential nodes in social networks: A voting approach. Chaos Solitons Fractals (2021) 152:111309. doi:10.1016/j.chaos.2021.111309
45. Liu J-G, Ren Z-M, Guo Q, Wang B-H. Node importance ranking of complex networks. Acta Phys Sin (2013) 62(17):178901. doi:10.7498/aps.62.178901
46. Pastor-Satorras R, Vespignani AJPRE. Epidemic dynamics and endemic states in complex networks. Phys Rev E (2001) 63(6):066117. doi:10.1103/physreve.63.066117
47. Csardi G, Nepusz T. The igraph software package for complex network research. InterJournal, complex Syst (2006) 1695(5):1–9.
48. Zachary WW. An information flow model for conflict and fission in small groups. J anthropological Res (1977) 33(4):452–73. doi:10.1086/jar.33.4.3629752
49. Lusseau D, Schneider K, Boisseau OJ, Haase P, Slooten E, Dawson SM. The bottlenose dolphin community of Doubtful Sound features a large proportion of long-lasting associations. Behav Ecol Sociobiol (2003) 54(4):396–405. doi:10.1007/s00265-003-0651-y
50. Gleiser PM, Danon L. Community structure in jazz. Adv Complex Syst (2003) 6(04):565–73. doi:10.1142/s0219525903001067
51. Jeong H, Tombor B, Albert R, Oltvai ZN, Barabasi AL. The large-scale organization of metabolic networks. nature (2000) 407(6804):651–4. doi:10.1038/35036627
52. Guimera R, Danon L, Diaz-Guilera A, Giralt F, Arenas A. Self-similar community structure in a network of human interactions. Phys Rev E (2003) 68(6):065103. doi:10.1103/physreve.68.065103
53. Newman MEJ. Finding community structure in networks using the eigenvectors of matrices. Phys Rev E (2006) 74(3):036104. doi:10.1103/physreve.74.036104
54. Colizza V, Pastor-Satorras R, Vespignani A. Reaction–diffusion processes and metapopulation models in heterogeneous networks. Nat Phys (2007) 3(4):276–82. doi:10.1038/nphys560
55. Kunegis J. KONECT–The koblenz network collection. Proc 22nd Int Conf World Wide Web (2013) 13:43–50.
56. Viswanath B, Mislove A, Cha M, Gummadi KP On the evolution of user interaction in Facebook. In: Proceedings of the 2nd ACM workshop on Online social networks; August 17, 2009; Barcelona, Spain (2009). p. 37–42.
57. Watts DJ, Strogatz SH. Collective dynamics of ‘small-world’networks. nature (1998) 393(6684):440–2. doi:10.1038/30918
Keywords: complex network, influence maximization, node identification, SIR model, VoteRank
Citation: Li Y, Yang X, Zhang X, Xi M and Lai X (2022) An improved voterank algorithm to identifying a set of influential spreaders in complex networks. Front. Phys. 10:955727. doi: 10.3389/fphy.2022.955727
Received: 29 May 2022; Accepted: 21 July 2022;
Published: 24 August 2022.
Edited by:
Dong Hao, University of Electronic Science and Technology of China, ChinaReviewed by:
Yifang Ma, Southern University of Science and Technology, ChinaSarah De Nigris, Joint Research Centre (Italy), Italy
Copyright © 2022 Li, Yang, Zhang, Xi and Lai. This is an open-access article distributed under the terms of the Creative Commons Attribution License (CC BY). The use, distribution or reproduction in other forums is permitted, provided the original author(s) and the copyright owner(s) are credited and that the original publication in this journal is cited, in accordance with accepted academic practice. No use, distribution or reproduction is permitted which does not comply with these terms.
*Correspondence: Xinzhi Yang, MjgyMzEyOTQxMUBxcS5jb20=