 Yingsi Zhao
 Chu Zhong
- 1School of Economics and Management, Beijing Jiaotong University, Beijing, China
- 2School of Electronics and Information Engineering, Beijing Jiaotong University, Beijing, China
With the rise and large-scale applications of social networking service, the prediction of information cascades has attracted extensive attention of researchers. User influence is an important factor affecting the dissemination of posts in online social networks. However, current studies usually take the number of users’ neighbors as their influence, and do not accurately describe the role of participating users in information dissemination. In this paper, a prediction model of information cascades in social networks is established based on the Hawkes process, and the model considers three factors, i.e., post influence, user influence and users’ response time, to describe the occurrence probability of forwarding events. In order to utilize abundant information of local network topology, we present a new method of calculating user influence, combining with semi-local centrality and local clustering coefficients. Then, a regression tree algorithm is used to determine time correction coefficients to reveal dynamic post influence, and the popularity prediction of posts in social networks is realized. Comparison experiments of different models are carried out on real-world datasets to evaluate the effectiveness and prediction performance of the proposed model, and results show that our method outperforms other counterparts.
1 Introduction
With massive user-generated contents and closely intertwined user relationship networks, the phenomena of information cascades become more and more common [1–3], and the work of information cascade prediction has also received notable attention of researchers [4–6]. The cascade prediction focuses on the cascade of social networks, which aims to estimate the future information diffusion ways. The final size of an information cascade directly indicates the popularity and influence depth of the information, and it is the reflection of information importance. That is, the larger the final scale of an information cascade, the higher its popularity and the wider the influence. Taking Twitter as an example, users can express their views and opinions on this platform. When a user posts a tweet, some users who follow it may retweet the tweet because they like it or approve of it, and then, the users who follow those retweeters have an opportunity to see the tweet [7–9]. After the tweet is received, it may also be forwarded, and the retweeting process is repeated continuously, forming a cascade of information in the network.
Existing work on information cascade prediction can be generally divided into two aspects: prediction methods based on feature learning and those based on model generation. The basic idea of feature learning is to use related algorithms of machine learning to formalize information cascade prediction as a classification or regression problem, and to extract relevant features of user-generated contents and initial cascade process, such as information disseminator [10, 11], information contents [12–14], and network structure [15–17], etc. Then, this kind of methods use different algorithms to mine the extracted features, so as to establish a mapping relationship between correlated characteristics and the future size of an information cascade. Wang et al. [18] proposed a combined social media popularity prediction framework based on multimodal feature extraction, implemented feature generalization and temporal modeling, and adopted a sliding window average to model short-term dependency of each user among visual and textual features. Kong et al. [19] focused on predicting multiple stages of popularity such as outbreak, plateau, rise, and fall. They adopted a pattern matching method to predict the future popularity stage by extracting multiple dynamic factors such as the number of retweets, the number of users, and network structure features at the micro level, and extracting the overall evolution pattern of the popularity stage at the macro level. Zhang et al. [20] extracted the time, structure and content features from the diffusion process of embedded web pages in WeChat moments and predicted the growth of content popularity. The results showed that the popularity scale was strongly correlated with the initial network structure of the cascade. Due to the diversity of features in the process of information cascades, it is very difficult to extract the optimal feature set. How to minimize the calculation and optimize the dynamic feature extraction process is an urgent problem to be solved.
On the other side, the methods with model generation directly simulate the process of information diffusion in a network, and formalize the cascade process into a parameterized model by analyzing the factors that affect the diffusion. After the diffusion model is established, various parameters of the model are estimated according to the cascade data observed in the initial stage, so as to predict the future cascade [21–27]. Zhao et al. [28] used the time-varying tweet influence to measure the forwarding rate, and identified whether a cascade is in the supercritical state or in the subcritical state. Chen et al. [29] proposed a marked self-exciting point process model to capture the retweeting dynamics and predict the tweet popularity. They selected the specific parameter form of the function in the model by comparing the goodness of fit of retweet cascades in the training data set. Palmowski et al. [30] described moments method of estimation of the parameters of Hawkes point process by using the generator theory to analyze and model the cascade effect of forwarding in social networks. Srivathsan et al. [31] presented a detailed Bayesian model of the information by incorporating prior knowledge of unobserved user information, which removed the high influence of the first observed user behavior. The results show that users make weighted choices between adoption and rejection, but do not always choose the most likely option, and adding prior user information will delay the cascade effect. Due to various assumptions on many factors affecting propagation process in the modeling, compared with prediction methods based on feature learning, model generation methods do not have the learning process of cascading features, so their prediction performance may be limited to a certain extent. Therefore, model generation methods should be incorporated with feature learning to improve the expressions of propagation details.
Existing models of cascade prediction only consider the number of followers for each forwarding user, that is, the in-degree of a node, when modeling the arrival intensity of forwarding events. The number of user’s followers can indeed represent the influence of a user to a certain extent, but this measurement also has certain shortcomings. Users with more followers do not necessarily have higher activity. Higher activity of a user in social networks means that the user may frequently post or repost a message, contributing to the growth of the forwarding cascade. In addition, fake online users are often used to construct fake popularity of influencers. If a user has a large number of fake fans, its influence will be overestimated when only measured by the number of fans.
We mainly focus on the problem of information cascades formed by the diffusion of posts (tweets on Twitter) after the posts are published in social networks, and investigate the prediction method based on model generation. We analyze the factors which affect the spreading of posts, and take the final number of reposts to measure the size of a cascade. Then, we construct the cascade prediction model based on the Hawkes process (also known as a self-exciting point process) to explore the final scale and influence range of an information cascade. In addition, we integrate the model with feature learning by introducing a cascading parameter to reflect the timeliness of posts. The main work of this paper is as follows:
1) We model the forwarding times of posts as a counting process, and characterize the arrival intensity of forwarding events by three factors, i.e., the influence of posts themselves, the influence of forwarding users, and the response time of users. Finally, the prediction model of the final forwarding number is obtained by integrating the theory of a branching process.
2) We propose a method of calculating the influence of forwarding users and predict the influence of posts. Then, we use a regression tree algorithm to train the cascading parameter, and a prediction algorithm is realized to obtain the final forwarding numbers of posts.
3) We conduct performance evaluation and comparative analysis of the cascade prediction model on two datasets from real social networks, and confirm the effectiveness of our model.
The rest of the paper is structured as follows. Our cascade prediction method is presented in Section 2. Section 3 provides experiments and empirical results of the model. Our conclusions are presented in Section 4.
2 Methods
In this section, firstly, we describe the specific problem discussed in this paper, and introduce the goal of information cascade prediction. Then, in terms of the theory of a counting process, we model the arrival intensity of post forwarding events based on the Hawkes process. Finally, we combine our generative model with intergenerational characteristics of a branching process, and obtain the predicted value of the final forwarding number. Figure 1 illustrates the overview of our proposed model.

FIGURE 1. Overview of the proposed framework.
2.1 Problem Definition
We assume that the publishing time for a post is

TABLE 1. Notations.
2.2 Forwarding Probability Modeling
Apparently, in the study of a counting process, how to characterize event arrival intensities in the process is a key problem. According to the features and growth mechanism of a forwarding cascade, each time a post is forwarded by a user, it may gain the attention of more users. Therefore, the number of potential users that may take forwarding behaviors increases due to forwarding events, and then more subsequent forwards are stimulated.
We characterize the probability of post forwarding events based on the intensity function of the Hawkes process. The intensity function of an event arrival in the classical Hawkes process is expressed as follows [32]:
where
We refine the self-excited effect and decompose the self-excited kernel function in the intensity function
where
Eq. 3 is the expression of the arrival intensity of post forwarding events in the information cascade, and
The arrival intensity of forwarded events
2.3 Tweet Attraction
The influence
Firstly, we consider the case that
In order to explain the process more clearly and concisely, the graphical expression of the model for the arrival process is shown in Figure 2. To simplify the representation of
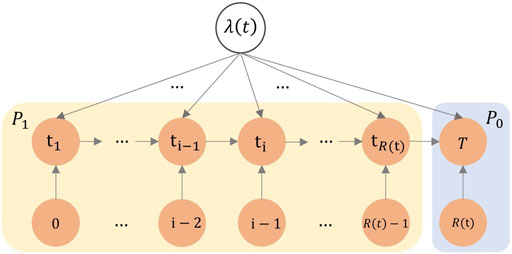
FIGURE 2. Graphical representation of the model for the arrival process.
Eq. 4 also represents the likelihood function of
Here,
In order to consider the time-varying characteristic of
where the unilateral kernel function
In social networks, users’ forwarding behaviors have a certain delay time. After a post is published, users need a period of response time to notice the post and decide whether to forward it. The probability density distribution of response time is determined by the memory kernel function
where
2.4 User Influence Modeling
We measure the influence of the ith forwarding user
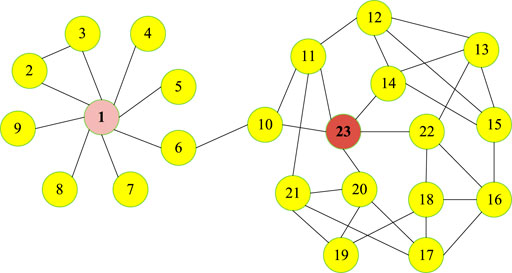
FIGURE 3. Illustration of user influence analysis.
Combined with two indicators of node influence, i.e., semi-local centrality [33] and local clustering coefficients, we expand the measurement of forwarding user influence by using more information of local network topology. The calculation method of semi-local centrality is as follows:
Where
Where
Where
2.5 Predicting an Information Cascade
After the modeling and parameter estimation of the arrival intensity for post’s forwarding events, this section will discuss how to predict the final number of forwards, that is, the final size of an information cascade. We define
The final scale of the information cascade to be predicted is expressed as
We assume that the own influence of the post remains unchanged after the prediction time
Where
Based on Eq. 14, the predicted final scale of the information cascade can be obtained, [28] that is, the final forwarding number is
In order to eliminate the inaccurate assumption that
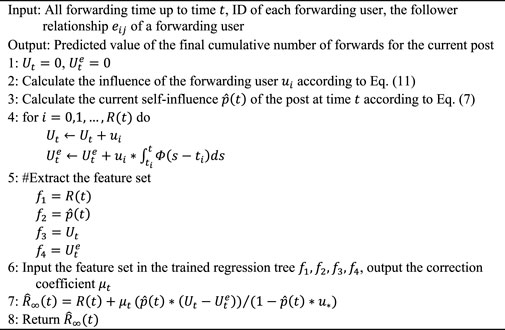
Eq. 16 is the final prediction model of an information cascade. We use the regression algorithm of a decision tree to solve and quantify
After selecting the feature set, we use the data in the training set to train the regression tree. In the test set, we input the feature set
Algorithm 1. Final scale prediction of an information cascade
3 Experiment Results
We use two real-world datasets in the experiments. The first dataset was collected from the Twitter platform and disclosed by Zhao et al. [28] in their research on the prediction of tweet forwarding. This dataset contains all the posts published on Twitter and their forwarding information within 1 month from 7 October 2011. The information of each post includes its ID, publishing time, the ID and number of fans of the publisher, as well as a series of forwarding time and the forwarding users. However, this dataset does not contain the structure information of the forwarding network, that is, there is no relationship information between users. Therefore, we introduce only the correction coefficient
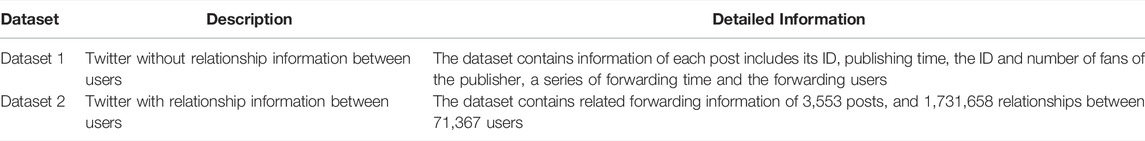
TABLE 2. Statistics of datasets.
We use the absolute percentage error (APE) and Kendall rank correlation coefficient as the evaluation metrics of prediction performance. APE is calculated as follows:
Where
Where
Here, we use the Hawkes model proposed by Zhao et al. [28] as the benchmark for experimental evaluation. The original Hawkes model uses the same correction coefficient for all posts, and the measurement of user influence only considers the number of users’ fans, so we address the role of our method of calculating user influence for the prediction performance. Note that the two datasets do not play the same role. We distinguish between two datasets to evaluate the impact of different modules on prediction performance. Dataset one does not have user relationships, so we validate on this dataset the effect on prediction performance of having different correction factors for different posts that we learned through machine learning without calculating user influence. Dataset 2 has user relationships, so influence can be calculated. We mainly extend the user influence on dataset two and verify the impact of this module on the prediction performance. For each post, 300s, 600s, 900s, 1,200s and 1,800s are selected as the prediction time to obtain the final sizes of forwarding cascades.
The comparison results on dataset one are shown in Figure 4 and Figure 5. In both figures, the curve ‘Hawkes’ represents the original Hawkes model, and the curve ‘Hawkesandfeature’ represents the model by introducing the idea of feature learning and using the regression tree algorithm to improve only correction coefficients. Figure 4A shows the evolutionary trend of the median of APE as a function of the prediction time
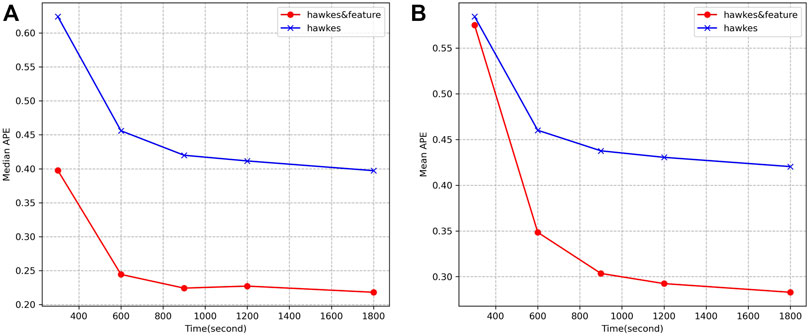
FIGURE 4. Comparison of APE of two models on dataset 1. (A) Evolutionary trend of the median APE with prediction time
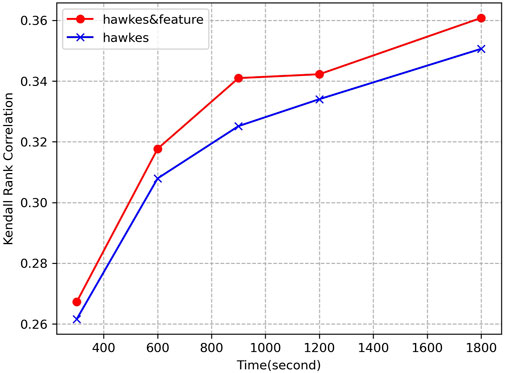
FIGURE 5. Comparison of Kendall rank correlation for two models on dataset 1.
Figure 5 shows the evolutionary trend of Kendall rank correlation for the above two models with prediction time
In the experiments on dataset 2, the measurement of user influence is expanded and the influence balance factor is set at
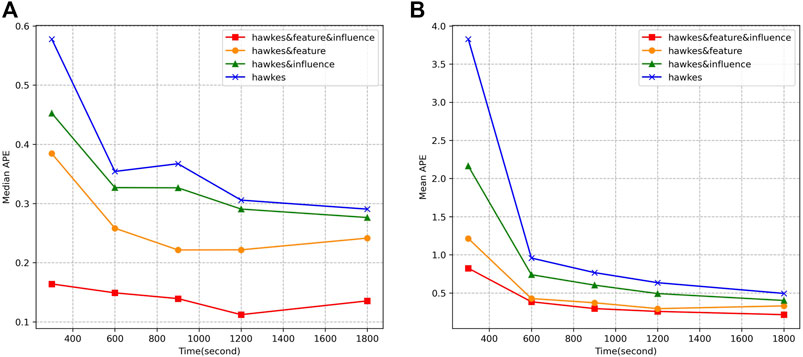
FIGURE 6. Comparison of APE of different models on dataset 2. (A) Evolutionary trend of the median APE with prediction time
Figure 7 shows the evolution trend of Kendall rank correlation of the above four models with prediction time
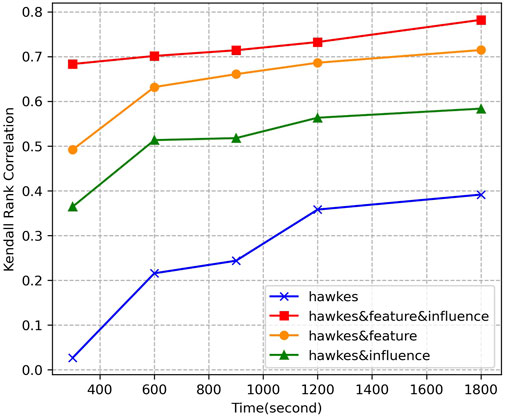
FIGURE 7. Comparison of Kendall rank correlation for different models on dataset 2.
We also notice that the performance of the models on the two datasets is slightly different. For instance, the mean APE of hawkesandfeature and Kendall rank correlation in dataset two are higher than it in dataset 1, which could be caused by the differences of the two networks. Dataset one contains a longer timeline of users’ actions, which leads to the better results.
Above all, through the experiments on real-world datasets, it can be concluded that our proposed method can effectively predict the final size of an information cascade, and has obvious performance improvement compared with the current process model.
4 Conclusion
Information cascades reflect a kind of user clustering behaviors, and the prediction of them has important theoretical significance and practical applications. In this paper, the prediction method based on model generation was proposed to solve the problem of cascade prediction. By analyzing the factors affecting information diffusion, we studied the growth mechanism of information cascades. On the basis of the Hawkes process, we modeled the arrival intensity of post forwarding process in combination with post attraction, forwarding user influence and users’ response time. We combined semi-local centrality with local clustering coefficients to measure the influence of forwarding users, and used the regression tree algorithm to improve the correction coefficients. Finally, the prediction model of the final number of forwards was obtained. The performance evaluation of the proposed method was carried out on real-world datasets, and results demonstrated that our method improves the prediction accuracy compared with representative models, indicating our method effectively realizes the prediction of information cascades.
In future, we will use deep learning methods to exploit forwarding paths and extract more latent features of information cascades, and incorporate deep learning with model generation methods. In addition, we will study the effective calculation methods of user influence in the propagation process, and investigate their roles in popularity prediction.
Data Availability Statement
The original contributions presented in the study are included in the article/Supplementary Material, further inquiries can be directed to the corresponding author.
Author Contributions
YZ designed the research and wrote the paper, CZ performed the experiments, and YZ conducted the validation and analyzed the results.
Conflict of Interest
The authors declare that the research was conducted in the absence of any commercial or financial relationships that could be construed as a potential conflict of interest.
Publisher’s Note
All claims expressed in this article are solely those of the authors and do not necessarily represent those of their affiliated organizations, or those of the publisher, the editors and the reviewers. Any product that may be evaluated in this article, or claim that may be made by its manufacturer, is not guaranteed or endorsed by the publisher.
Footnotes
1https://github.com/ShinyZC/dataset.
References
1. Davis JT, Perra N, Zhang Q, Moreno Y, Vespignani A. Phase Transitions in Information Spreading on Structured Populations. Nat Phys (2020) 16:590–596. doi:10.1038/s41567-020-0810-3
2. Chen X, Wang R, Tang M, Cai S, Stanley HE, Braunstein LA. Suppressing Epidemic Spreading in Multiplex Networks with Social-Support. New J Phys (2018) 20:013007. doi:10.1088/1367-2630/aa9cda
3. Velásquez-Rojas F, Ventura PC, Connaughton C, Moreno Y, Rodrigues FA, Vazquez F. Disease and Information Spreading at Different Speeds in Multiplex Networks. Phys Rev E (2020) 102:022312. doi:10.1103/PhysRevE.102.022312
4. Bao Q, Cheung WK, Zhang Y, Liu J. A Component-Based Diffusion Model with Structural Diversity for Social Networks. IEEE Trans Cybern (2017) 47(4):1078–1089. doi:10.1109/tcyb.2016.2537366
5. Li D, Zhang S, Sun X, Zhou H, Li S, Li X. Modeling Information Diffusion over Social Networks for Temporal Dynamic Prediction. IEEE Trans Knowl Data Eng (2017) 29(9):1985–97. doi:10.1109/tkde.2017.2702162
6. Cui P, Jin S, Yu L, Wang F, Zhu W, Yang S. Cascading Outbreak Prediction in Networks: a Data-Driven Approach. In: Proceedings of the 19th ACM SIGKDD international conference on Knowledge discovery and data mining; 2013 Aug 11-14; New York, USA. Association for Computing Machinery (2013). p. 901–909.
7. Zhao J, Wu J, Xu K. Weak Ties: Subtle Role of Information Diffusion in Online Social Networks. Phys Rev E Stat Nonlin Soft Matter Phys (2010) 82:016105. doi:10.1103/PhysRevE.82.016105
8. Ma Z, Sun A, Cong G. On Predicting the Popularity of Newly Emerging Hashtags in Twitter. J Am Soc Inf Sci Tec (2013) 64:1399–1410. doi:10.1002/asi.22844
9. Xiong F, Liu Y, Zhang Z, Zhu J, Zhang Y. An Information Diffusion Model Based on Retweeting Mechanism for Online Social media. Phys Lett A (2012) 376(30-31):2103–2108. doi:10.1016/j.physleta.2012.05.021
10. Bakshy E, Hofman J, Mason W, Watts D. Everyone’s an Influencer: Quantifying Influence on Twitter. In: Proceedings of the Fourth ACM International Conference on Web Search and Data Mining; 2011 Feb 9-12; Hong Kong, China. ACM Press (2011). p. 65–74.
11. Flamino J, Szymanski B. A Reaction-Based Approach to Information cascade Analysis. In: 28th International Conference on Computer Communication and Networks; 2019 Jul 29-Aug 1; Valencia, Spain. IEEE (2019). p. 1–9. doi:10.1109/icccn.2019.8847096
12. Tsur O, Rappoport A. What’s in a Hashtag? : Content Based Prediction of the Spread of Ideas in Microblogging Communities. In: Proceedings of the Fifth ACM International Conference on Web Search and Data Mining; 2012 Feb 8-12; Seattle, Washington, USA. ACM Press (2012). p. 643–652.
13. Bakshy E, Hofman JM, Mason WA, Watts DJ, Watts D. Everyone's an Influencer: Quantifying Influence on Twitter. In: Proceedings of the 4th ACM International Conference on Web Search & Web Data Mining; 2011 Feb 9-12; Hong Kong, China. ACM Press (2011). p. 65–74.
14. Wang J, Li W, Weili W. Predicting Information Popularity Degree in Microblogging Diffusion Networks. Int J Multimedia Ubiquitous Eng (2014) 9(2):21–30. doi:10.14257/ijmue.2014.9.2.30
15. Weng L, Menczer F, Ahn Y-Y. Virality Prediction and Community Structure in Social Networks. Sci Rep (2013) 3:2522. doi:10.1038/srep02522
16. Tsugawa S. Empirical Analysis of the Relation between Community Structure and Cascading Retweet Diffusion. In: Proceedings of the Thirteenth International AAAI Conference on Web and Social Media; 2019 Jun 11-14; Münich, Germany. AAAI Press (2019). p. 493–504.
17. Hong L, Dan O, Davison BD. Predicting Popular Messages in Twitter. In: Proceedings of the 20th International Conference Companion on World Wide Web; 2011 Mar 28-Apr 1; Hyderabad, India. ACM (2011). p. 57–58. doi:10.1145/1963192.1963222
18. Wang K, Wang PH, Chen X, Huang Q, Mao Z, Zhang Y. A Feature Generalization Framework for Social Media Popularity Prediction. In: Proceedings of the 28th ACM International Conference on Multimedia (MM ’20); Seattle, WA; October 12–16, 2020. Association for Computing Machinery (2020). p. 4570–4574. doi:10.1145/3394171.3416294
19. Kong Q, Mao W, Chen G, Zeng D. Exploring Trends and Patterns of Popularity Stage Evolution in Social Media. IEEE Trans Syst Man Cybern, Syst (2020) 50(10):3817–3827. doi:10.1109/tsmc.2018.2855806
20. Zhang B, Wu Q, Chen X, Chen L. Information Cascades over Diffusion-Restricted Social Network: A Data-Driven Analysis. In: IEEE INFOCOM 2019 - IEEE Conference on Computer Communications Workshops (INFOCOM WKSHPS) (2019). 29 April 2019 - 02 May 2019, Paris, France, p. 151–156. doi:10.1109/infcomw.2019.8845264
21. Crane R, Sornette D. Robust Dynamic Classes Revealed by Measuring the Response Function of a Social System. Proc Natl Acad Sci U.S.A (2008) 105(41):15649–15653. doi:10.1073/pnas.0803685105
22. Li Q, Wu Z, Yi L, N K, N. H, Ma X. WeSeer: Visual Analysis for Better Information cascade Prediction of WeChat Articles. IEEE Trans Vis Comput. Graphics (2020) 26:1399–1412. doi:10.1109/tvcg.2018.2867776
23. Szabo G, Huberman BA. Predicting the Popularity of Online Content. Commun ACM (2010) 53:80–88. doi:10.1145/1787234.1787254
24. Yu L, Cui P, Wang F, Song C, Yang S. From Micro to Macro: Uncovering and Predicting Information Cascading Process with Behavioral Dynamics. In: 2015 IEEE International Conference on Data Mining; 2015 Nov 14-17; Atlantic City, USA. IEEE (2015). p. 559–568. doi:10.1109/icdm.2015.79
25. Zaman T, Fox EB, Bradlow ET. A Bayesian Approach for Predicting the Popularity of Tweets. Ann Appl Stat (2014) 8(3):1583–1611. doi:10.1214/14-aoas741
26. Shen H, Wang D, Song C, Barabási AL. Modeling and Predicting Popularity Dynamics via Reinforced Poisson Processes. In: Proceedings of the 28th AAAI Conference on Artificial Intelligence; 2014 Jul 27-31; Québec, Canada. AAAI Press (2014). p. 291–297.
27. Kobayashi R, Lambiotte R. TiDeH: Time-dependent Hawkes Process for Predicting Retweet Dynamics. In: the 10th International AAAI Conference on Web and Social Media; 2016 May 17-20; Cologne, Germany. AAAI Press (2016). p. 191–200.
28. Zhao Q, Erdogdu MA, He HY, Rajaraman A, Leskovec J. SEISMIC: A Self-Exciting point Process Model for Predicting Tweet Popularity. In: Proceedings of the 21th International Conference on Knowledge Discovery and Data Mining; 2015 Aug 10-13; Sydney, Australia. ACM (2015). p. 1513–1522.
29. Chen F, Tan WH. Marked Self-Exciting Point Process Modelling of Information Diffusion on Twitter. Ann Appl Stat (2018) 12(4):2175–2196. doi:10.1214/18-aoas1148
30. Palmowski Z, Puchalska D. Modeling Social media Contagion Using Hawkes Processes. New York, NY: Cornell University (2020). ArXiv, abs/2010.14623.
31. Srivathsan S, Cranefield S, Pitt J. A Bayesian Model of Information Cascades. New York, NY: Cornell University (2021). p. 03166. ArXiv, abs/2105.
32. Hawkes AG, Oakes D. A Cluster Process Representation of a Self-Exciting Process. J Appl Probab (1974) 11(3):493–503. doi:10.2307/3212693
33. Chen D, Lü L, Shang M-S, Zhang Y-C, Zhou T. Identifying Influential Nodes in Complex Networks. Physica A: Stat Mech its Appl (2012) 391(4):1777–1787. doi:10.1016/j.physa.2011.09.017
Keywords: cascade prediction, self-exciting point process, user influence, dynamic post correction, social network
Citation: Zhao Y and Zhong C (2022) Cascade Prediction With Self-Exciting Point Process and Local User Influence Measurement. Front. Phys. 10:951729. doi: 10.3389/fphy.2022.951729
Received: 24 May 2022; Accepted: 17 June 2022;
Published: 08 July 2022.
Edited by:
Xuzhen Zhu, Beijing University of Posts and Telecommunications (BUPT), ChinaReviewed by:
Junyu Xuan, University of Technology Sydney, AustraliaLin Hui, Tamkang University, Taiwan
Zhangbing Zhou, China University of Geosciences, China
Copyright © 2022 Zhao and Zhong. This is an open-access article distributed under the terms of the Creative Commons Attribution License (CC BY). The use, distribution or reproduction in other forums is permitted, provided the original author(s) and the copyright owner(s) are credited and that the original publication in this journal is cited, in accordance with accepted academic practice. No use, distribution or reproduction is permitted which does not comply with these terms.
*Correspondence: Yingsi Zhao, eXN6aGFvQGJqdHUuZWR1LmNu