 Haixia Zhang
 Jingjie Zhao2
 Peican Zhu
- 1School of Mechanical and Electrical Engineering, Wuhan Institute of Technology, Wuhan, China
- 2Beijing Municipal Transportation Operations Coordination Center (TOCC), Beijing, China
- 3State Grid Information and Telecommunication Group Co. Ltd, Beijing, China
- 4School of Artificial Intelligence, Optics and Electronics (iOPEN), Northwestern Polytechnical University, Xi’an, China
Air transport involves a long-distance journey; it is the main method of transnational travel, which is also an important connection channel between countries/regions. The aviation network is one of the core national transportation networks, whose importance is self-evident. To improve the management efficiency of the aviation network, this study studies the topological characteristics of the global aviation network in detail. The findings show that the global aviation network is a scale-free heterogeneous network, and the aviation network is tolerant of random faults. However, if key nodes are deliberately attacked, the network structure can easily be destroyed into fragments. To further explore the importance of nodes, combined with the background of airport mergers or unions, the node shrinkage method is improved by weighing network edges with the number of edges and ranking the importance of each node in the aviation network. This study compares the results of the node importance calculation by the node shrinkage method and improved weighted node shrinkage method, respectively. The results show that the ranking results obtained from the weighted node shrinkage method are better than those obtained from the traditional node shrinkage method. To further verify the validity of the weighted node shrinkage method, this study conducts a sensitivity analysis by calculating the weights of nodes and edges with different values. The results imply that the rank changes of node importance in the top 20 global aviation networks are the same. Therefore, it is important to find the key nodes in the aviation network and take corresponding protective measures to protect the stability of the global aviation network and improve the efficiency of the management of the aviation network.
Introduction
As an effective and convenient transportation mode, air transportation has incomparable advantages compared with land transportation, especially in long-distance transportation across countries. According to the statistics released by IATA in 2018, airlines worldwide carried a total of 4.4 billion passengers on scheduled flights. Since taking an airplane has become a significant choice for citizens to travel, air transportation is crucial in globalization. However, this industry suffered a great deal due to the outbreak of the Covid-19 pandemic. Indeed, airline operations were paralyzed by the collapse of any route triggered by the sudden circuit breaker, which considerably impacted the airline network. Therefore, to cope with the emergent situation in the airline network, it is critical to analyze the structural characteristics of the network.
The current research on aviation networks mainly focuses on several basic properties, such as the topology, resilience, robustness, association structure, and identification of a key node, in an airline network. Zhang et al. [1] investigated the Chinese air route network based on the complex network theory. Verma et al. [2] built a world airline network and analyzed the corresponding characteristics. Wang et al. [3] uncovered the important intrinsic properties of the structure of the airport network. Lordan and Sallan [4] studied the Europe airline network. The United States airline network was investigated by Lin and Ban [5]. Cheung et al. [6] studied the evolution of the global air transport network over the period 2006–2016.
Later, Liu et al. [7] studied the reliability of complex networks and analyzed the criticality nodes of the networks. Wen et al. [8] discussed the Chinese airport network as multilayer networks using the complex network method. Roy et al. [9] studied the vulnerability of the airspace system using topological metrics from the perspective of the network model. Sun et al. [10] studied the criticality of nodes in air transport networks by three domains, providing a better understanding of the same. Du et al. [11] proposed a centrality measure named TOPSIS, and the efficiency and practicability of TOPSIS were evaluated via the susceptible-infected model. At present, Truong [12] used neural networks and Monte Carlo simulation to estimate the impact of COVID-19 on medium- and long-term air travel, finding that air transportation was difficult to recover in a short time. Yun [13] combined an entropy weight method with a centrality algorithm to calculate the importance of each node and ranked the nodes by the calculated importance in the global aviation network. Ren [14] established an aviation sector network model by the schedule of China. In the meantime, he also proposed a node ranking algorithm through a variation coefficient method and ranked the airports in the Chinese aviation network.
For the key node ranking problem of the aviation network, most scholars mainly considered the attribute of the nodes and the topology of the whole network. However, they ignored the interactions among the nodes. In the actual aviation network, airlines is an exceedingly vital factor that affects the significance of the airport. For the ranking algorithm of node importance, this study proposes a node contraction algorithm based on the edge betweenness to identify the key nodes in the global airline network.
The remainder of this manuscript is organized as follows. Section 2 introduces the methodology of the aviation network analysis. Section 3 presents the practical application and analysis of the results. Section 4 describes the sensitivity analysis. The conclusions are provided in Section 5.
Aviation Network Analysis
Centrality Measurement Algorithm
Due to the complexity of the network, the structural characteristics of the network and the interactions between the nodes should be analyzed. In general, the following key node algorithms are commonly used: degree centrality (DC) [15, 16], betweenness centrality (BC) [17, 18], closeness centrality (CC) [19], and eigenvector centrality [20] algorithms.
1) Degree centrality
DC is the most direct measure of node centrality, calculating the weight of a node degree in the network. DC of a node is calculated as
where
2) Betweenness centrality
BC is a centrality measurement model that relates to the shortest path, which is the number of the shortest path through the node. BC of node
where
3) Closeness centrality
CC also is a vital indicator that reveals the importance of the nodes, calculating the overall distance from one node to other nodes in the airline network. In an airline network, if a node is closer to other nodes, the CC of the node is greater. CC of a node is calculated by the following formula:
where
4) Eigenvector centrality
Eigenvector centrality focuses on the importance of a node by measuring the importance of neighboring nodes in the airline network. Eigenvector centrality is an algorithm that measures the connectivity between these nodes, which indicates that the influence of a node connected to a node with a high score is greater than that of a node connected to a node with a low score. The eigenvector centrality of a node is calculated as follows:
We assume
Since
Calculation of Cohesiveness of Aviation Network by Nodal Contraction Method
The node contraction method [21] is a model to measure the importance of each node in a network. The process is to form a new network by absorbing the neighbors of a node into a new node and establishing connected edges with the neighbors of the neighboring nodes. Further, the importance of the node is measured by comparing the cohesiveness of the network after the contraction of different nodes. In general, the greater the cohesiveness of a node, the higher the importance of the node. A schematic diagram of the node contraction process is shown in Figure 1.
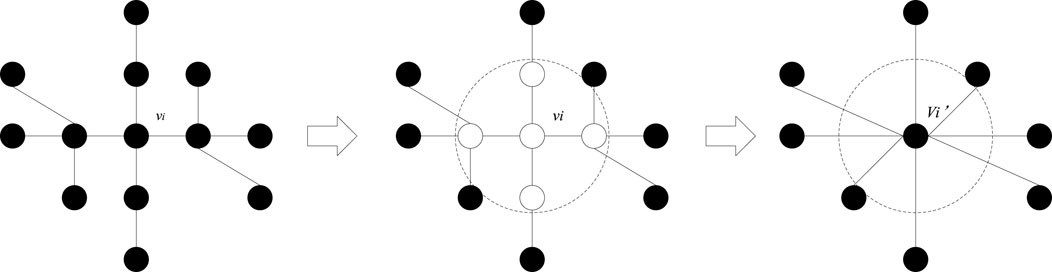
FIGURE 1. Node contraction process.
In the viewable networks, the cohesiveness of the network is defined as follows:
where
Then, the importance of nodes can be expressed by the following equation:
Through Equations 6 and 7, it could be determined that the importance of a node mainly relates to the degree and position. Furthermore, we should take the two indicators, both DC of the node and BC, into consideration, when evaluating the importance of the connected point. When the DC of the node is lager, the degree of the node is large. While the number of nodes after the node contraction in the network is small, the cohesiveness of the airline network is large. Thereafter, the definition of BC is the number of shortest paths through the node in all node pairs. If a node with a large BC is contracted, the average shortest path that newly generated network will be greatly reduced. As a consequence, the cohesiveness of the airline network will be greater.
Node Contraction Method Considering the Inter-Airport Correlation
At present, for the model to identify the key node in the complex network, the literature focuses on the study about the unweighted network. However, if only the topological structure of the network is assessed, it may fail to analyze the importance of the aviation network effectively. Therefore, the importance of connected edges between airports should be taken into consideration. Then, suitable and critical airports can be better found. Based on the analysis above, this study not only considers the importance of connected edges between airports but also analyzes the importance of nodes in aviation networks.
Edge betweenness is similar to BC of a node. Moreover, node betweenness is the number of the shortest path through the node, while edge betweenness is the number of the shortest path through the edge. For the definition of edge betweenness, we regard edge betweenness as the importance of the connected edges in the aviation network. Then, the importance of a node under the improved node contraction calculus can be defined as follows:
where
Then,
where
Solution of the Algorithm
In summary, the calculation steps for this framework are shown in Figure 2. Step 1: Find the adjacency matrix of the global airline network. Step 2: Calculate the set of edge betweenness
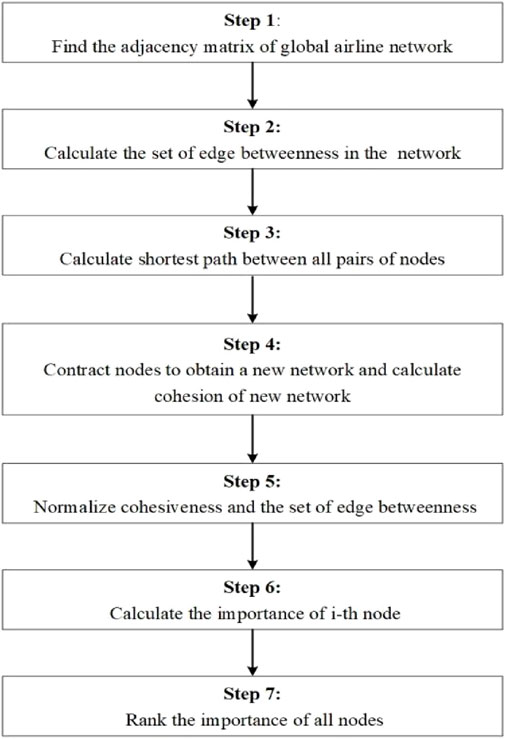
FIGURE 2. Flow diagram of the solution of the algorithm.
Practical Application and Analysis of Results
Aviation Network Structure
In this study, the global flight information of 2018 is collected and integrated. If there are flights between two airports, it can be considered that there is a connected edge. Otherwise, there is no connected edge between these two airports. Through integration and analysis of the global flight data of 2018, it is found that there are 3,154 airports and 18,592 routes in the global aviation network. The structure diagrams of the aviation network are presented in Figure 3, and Table 1 shows the statistical characteristics of the aviation network.
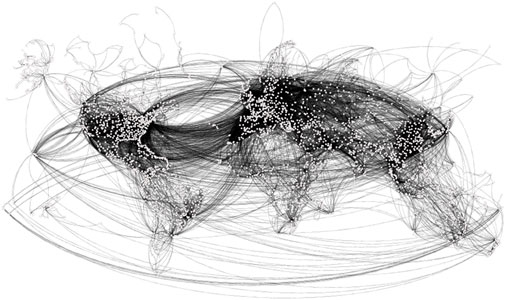
FIGURE 3. Air transportation network.

TABLE 1. Parameters of the global airport network.
In Table 1, the density of the global aviation network is 0.004. It is obvious that the number of flights in the aviation network is still relatively sparse. Meanwhile, the average path length and diameter are 3.691 and 12, respectively, indicating that the average number of airports to pass through from one airport to another is 3.961, with the maximum number of airports to pass through being 12. Among other things, the coefficient of homogeneity is −0.017, which indicates the connected edges between airports that tend to connect with airports that are not like their own in the aviation network. That is, the global aviation network is heterogeneous.
Figure 4 shows the degree distribution of the aviation network, where the blue circles are the real degree distribution and the black line is the result of fitting the degree distribution with an R2 of 0.91. Therefore, the degree distribution of the global airline network is a power-law distribution with scale-free characteristics.
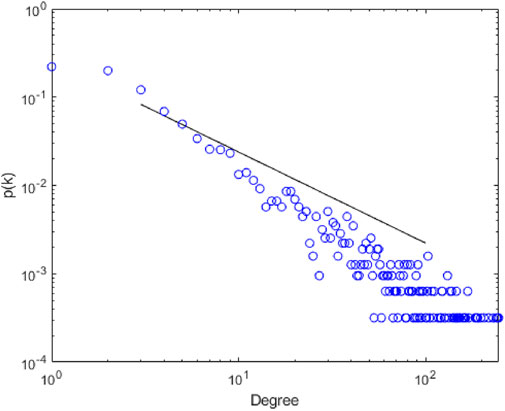
FIGURE 4. Degree distribution of the air transportation network.
To further verify the effectiveness of the importance calculation of nodes under this model, this study simulates the disease transmission 100 times by the SI model with the top 20 nodes in the node contraction algorithm and the improved node contraction method as the source of transmission, respectively. At last, the average value of the infected nodes over time is calculated. The results are shown in Figure 5A. By analyzing the simulation results, it is found that the improved node contraction method starts to converge at step 118, while the unimproved nodal contraction method starts to converge at step 127.
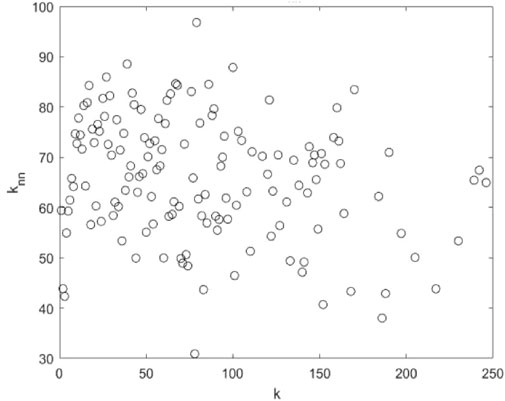
FIGURE 5. Relationship between the average degree of the adjacent nodes
Correlation of Degree With Degree
The correlation between the degree of the nodes is used to indicate the preference of the linkage of the nodes. The average degree of the adjacent points of node i is specified as follows:
where
When
Betweenness Correlation
Betweenness correlation depicts the preference of nodes to select connections with other nodes based on the value of betweenness. The following is the average betweenness of the adjacent nodes of the node whose betweenness is g:
where
The overall distribution of the betweenness of the adjacent nodes shows no obvious tendency to the node’s betweenness (g), as shown in Figure 6. The betweenness of the adjacent nodes of the node with smaller betweenness varies widely.
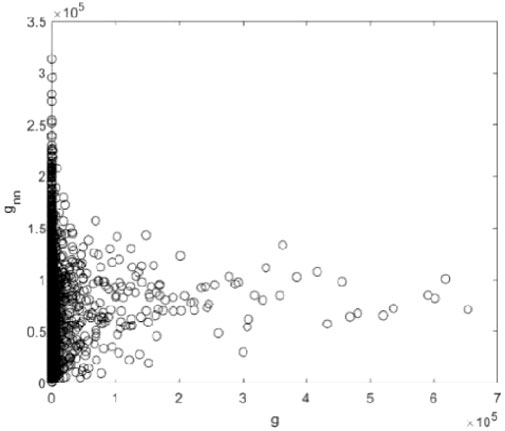
FIGURE 6. Relationship between the average betweenness of the adjacent nodes (
Cluster-Degree Correlation
Cluster-degree correlation is used to describe the correlation between the node and the clustering degree of its connected nodes. As presented in Figure 7, when the node degree value is less than 50, the average clustering coefficient of nodes is roughly stable (between 0.3 and 0.45). If the node degree value is between 50 and 200, the average clustering coefficient shows an upward trend, indicating that airports with higher degree values tend to cluster. Meanwhile, the average clustering coefficient shows a downward trend when the node degree value is large (k > 200). The clustering coefficient varies between 0.35 and 0.45, which indicates that the airports with the largest degree do not cluster together.
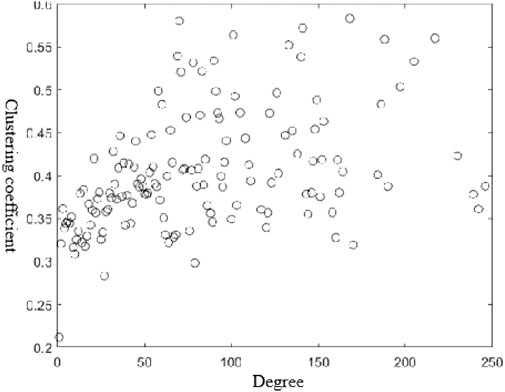
FIGURE 7. Relationship between the clustering coefficient and the degree of the node in the global aviation network.
Effectiveness of Key Node
To validate the effectiveness of this algorithm, this study utilizes DC, CC, BC, the eigenvector centrality, and the improved node contraction method. Then, the top 20 nodes ranked under these models are selected as propagation sources for disease propagation simulation through the SI model. The simulation results are shown in Figure 8B. Moreover, although the improved node contraction method ranks last in terms of the number of infections at the beginning of transmission, its transmission efficiency accelerates significantly over time and converges rapidly over the other models. In summary, the improved node contraction method proposed in this study is effective.

FIGURE 8. Selection of different nodes as the source of propagation.
Table 2 shows the results of the top 20 airport rankings based on the four algorithms mentioned above with the improved node contraction method. The top 20 airports are Frankfurt am Main International Airport (FRA), Charles de Gaulle International Airport (CDG), London Heathrow Airport (LHR), Amsterdam Airport Schiphol (AMS), Dubai International Airport (DXB), Los Angeles International Airport (LAX), John F Kennedy International Airport (JFK), Lester B. Pearson International Airport (YYZ), Atatürk International Airport (IST), Munich International Airport (MUC), Chicago O'Hare International Airport (ORD), Beijing Capital International Airport (PEK), Leonardo da Vinci–Fiumicino Airport (FCO), Narita International Airport (NRT), Newark Liberty International Airport (EWR), Incheon International Airport (ICN), Zürich Airport (ZRH), Adolfo Suárez Madrid–Barajas Airport (MAD), Chek Lap Kok International Airport (HKG), and George Bush Intercontinental Houston Airport (IAH). It is obvious that the importance of the critical nodes calculated by different models is different, which is mainly due to the different contexts and demand contexts where the critical nodes are created. However, the simulation results of the rank of critical nodes under these algorithms through the SI model also validate that the construction of these algorithms is effective. In general, when we select a different model to rank the importance of critical nodes, although the results will be different, the algorithm is feasible.
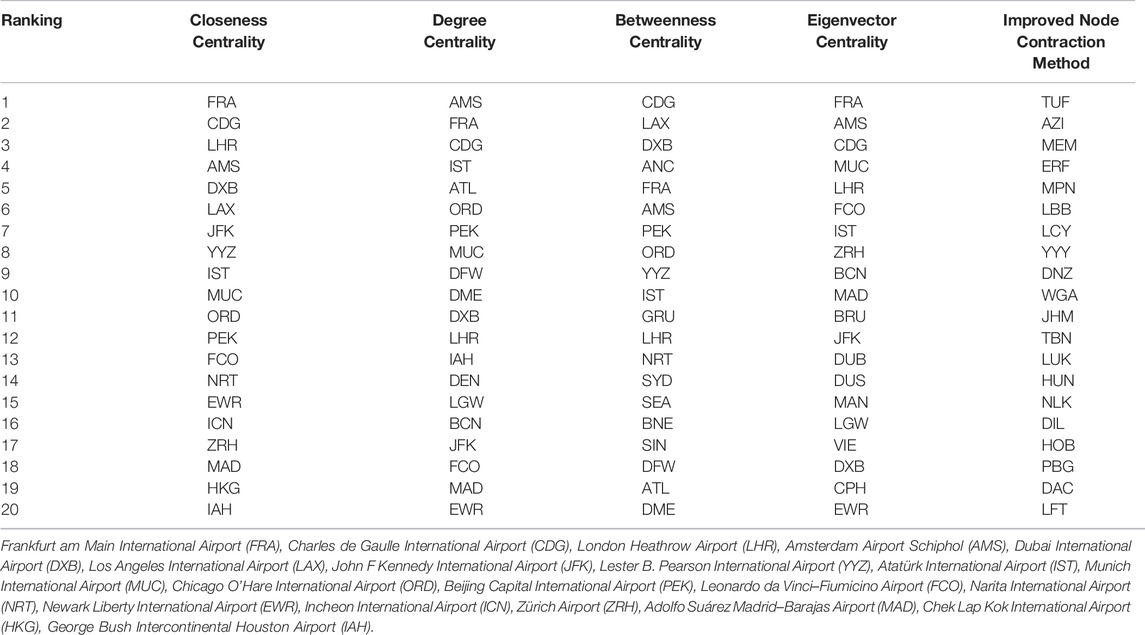
TABLE 2. Ranking of airport importance (top 20).
The United States has eight airports and Australia, Bangladesh, Canada, Timor-Leste, The Falk Islands, France, Germany, Norfolk Island, Taiwan, Turkey, the United Arab Emirates, and the United Kingdom each have one airport in the global top 20, according to a significant ranking of airports with the improved node contraction method. This shows that the critical nodes in the global aviation network are mainly concentrated in Western countries. Among them, the United States is the main country, which also indicates that air travel is an exceedingly significant means of transportation between American cities.
Sensitivity Analysis
This study uses different
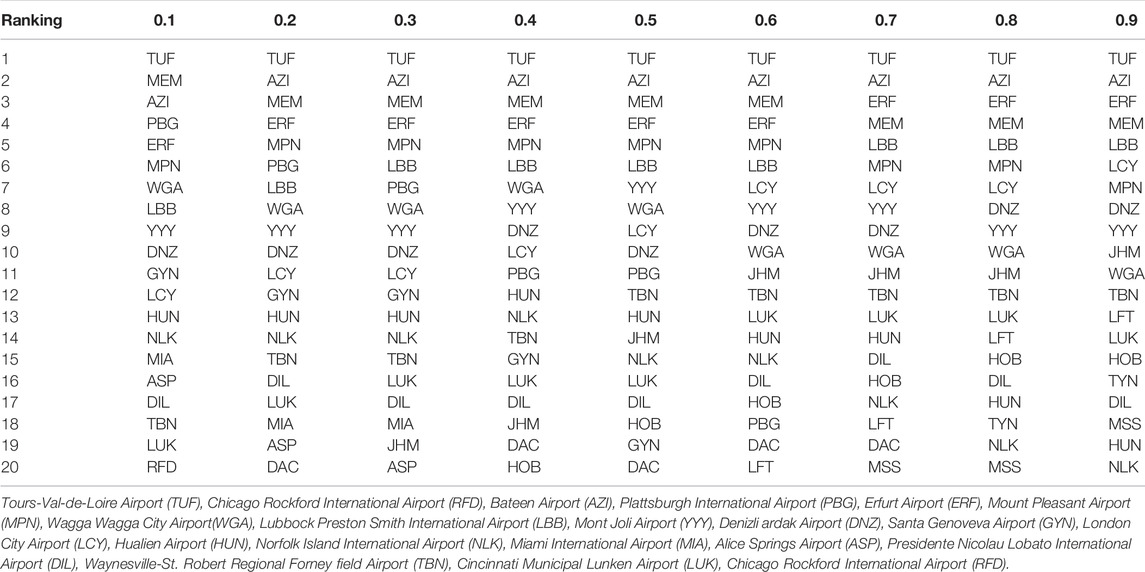
TABLE 3. Ranking of airport importance by different
Conclusion
This study focuses on the analysis of the global aviation network based on the complexity network model. In terms of the structural characteristics and degree distribution in aviation networks, it is found that the global aviation network is a scale-free heterogeneous network. Moreover, the scale-free network is highly tolerant of random faults because of the existence of key nodes in the network. If errors occur randomly, the number of key nodes is so small that they are hardly affected, and deleting other nodes has little impact on the network structure. However, if key nodes are deliberately attacked, the network is easily damaged. Therefore, the identification of key nodes is extremely vital to ensure the security and stability of the global aviation network.
With the background of airport mergers, the node contraction method is improved to identify key nodes in a network. Based on the structural characteristics, the concept of edge betweenness is introduced, and the importance of connected edges to improve the node contraction method is considered. To examine the importance of nodes and identify the key nodes in a multidimension way, the node centrality, node betweenness, and edge betweenness are integrated. This research has significant implications for the security and stability of the global aviation network. Besides, it also lays a noticeable foundation for research on how to improve the efficiency of the aviation network.
Data Availability Statement
The original contributions presented in the study are included in the article/supplementary material; further inquiries can be directed to the corresponding author.
Author Contributions
HZ and PZ contributed to the conception and design of the study. JZ and JW organized and cleared the data. HZ and PZ performed the statistical analysis. HZ wrote the first draft of the manuscript. JZ, JW, and PZ wrote sections of the manuscript. All authors contributed to manuscript revision, read, and approved the submitted version.
Funding
This work was supported by National Natural Science Foundation of China (Grant Nos. U1803263, 62073263), the Key Research and Development Program of Shaanxi Province (Grant No. 2022KW-26), and the Technological Innovation Team of Shaanxi Province (Grant No. 2020TD-013).
Conflict of Interest
JW was employed by State Grid Information and Telecommunication Group Co. Ltd.
The remaining authors declare that the research was conducted in the absence of any commercial or financial relationships that could be construed as a potential conflict of interest.
Publisher’s Note
All claims expressed in this article are solely those of the authors and do not necessarily represent those of their affiliated organizations, or those of the publisher, the editors, and the reviewers. Any product that may be evaluated in this article, or claim that may be made by its manufacturer, is not guaranteed or endorsed by the publisher.
References
1. Zhang M, Liang B, Wang S, Perc M, Du W, Cao X. Analysis of Flight Conflicts in the Chinese Air Route Network. Chaos, Solitons & Fractals (2018) 112:97–102. doi:10.1016/j.chaos.2018.04.041
2. Verma T, Araújo NA, Herrmann HJ. Revealing the Structure of the World Airline Network. Sci Rep (2014) 4(1):5638–6. doi:10.1038/srep05638
3. Wang J, Zhou Y, Huang GQ. Alternative Pair in the Airport Network. Transportation Res A: Pol Pract (2019) 124:408–18. doi:10.1016/j.tra.2019.04.010
4. Lordan O, Sallan JM. Analyzing the Multilevel Structure of the European Airport Network. Chin J Aeronautics (2017) 30(2):554–60. doi:10.1016/j.cja.2017.01.013
5. Lin J, Ban Y. The Evolving Network Structure of US Airline System during 1990-2010. Physica A: Stat Mech its Appl (2014) 410:302–12. doi:10.1016/j.physa.2014.05.040
6. Cheung TKY, Wong CWH, Zhang A. The Evolution of Aviation Network: Global Airport Connectivity index 2006-2016. Transportation Res E: Logistics Transportation Rev (2020) 133:101826. doi:10.1016/j.tre.2019.101826
7. Liu S, Wang Z, Wei G, Li M. Distributed Set-Membership Filtering for Multirate Systems under the Round-Robin Scheduling over Sensor Networks. IEEE Trans Cybern (2020) 50(5):1910–20. doi:10.1109/TCYB.2018.2885653
8. Du W-B, Zhou X-L, Lordan O, Wang Z, Zhao C, Zhu Y-B. Analysis of the Chinese Airline Network as Multi-Layer Networks. Transportation Res Part E: Logistics Transportation Rev (2016) 89:108–16. doi:10.1016/j.tre.2016.03.009
9. Roy S, Xue M, Sridhar B. Vulnerability Metrics for the Airspace System. In: Proceedings of the 2017 FAA/Eurocontrol Air Traffic Management Research and Development Seminar; 27-30 June 2017; Seattle, Washington, USA. (2017).
10. Sun X, Wandelt S, Cao X. On Node Criticality in Air Transportation Networks. Netw Spat Econ (2017) 17(3):737–61. doi:10.1007/s11067-017-9342-5
11. Du Y, Gao C, Hu Y, Mahadevan S, Deng Y. A New Method of Identifying Influential Nodes in Complex Networks Based on TOPSIS. Physica A: Stat Mech its Appl (2014) 399:57–69. doi:10.1016/j.physa.2013.12.031
12. Truong D. Estimating the Impact of COVID-19 on Air Travel in the Medium and Long Term Using Neural Network and Monte Carlo Simulation. J Air Transport Manag (2021) 96:102126. doi:10.1016/j.jairtraman.2021.102126
13. Wang Y, Meng K, Wu H, Hu J, Wu P. Critical Airports of the World Air Sector Network Based on the Centrality and Entropy Theory. Int J Mod Phys B (2021) 35(06):2150081. doi:10.1142/s0217979221500818
14. Ren G, Lu C, Zhu J, Liu X. Analyzing the Topological Characteristic and Key Nodes of Chinese Air Sector Network. Int J Mod Phys B (2019) 33(11):1950100. doi:10.1142/s0217979219501005
15. Dai P-F, Xiong X, Zhou W-X. Visibility Graph Analysis of Economy Policy Uncertainty Indices. Physica A: Stat Mech its Appl (2019) 531:121748. doi:10.1016/j.physa.2019.121748
16. Hu J, Chen J, Zhu P, Hao S, Wang M, Li H, et al. Difference and Cluster Analysis on the Carbon Dioxide Emissions in China during Covid-19 Lockdown via a Complex Network Model. Front Psychol (2022) 12:795142. doi:10.3389/fpsyg.2021.795142
17. Hu J, Zhang Y, Wu P, Li H. An Analysis of the Global Fuel-Trading Market Based on the Visibility Graph Approach. Chaos, Solitons & Fractals (2022) 154:111613. doi:10.1016/j.chaos.2021.111613
18. Rajeh S, Savonnet M, Leclercq E, Cherifi H. How Correlated Are Community-Aware and Classical Centrality Measures in Complex Networks? In: International Conference on Complex Networks. Cham: Springer (2021). p. 120–32. doi:10.1007/978-3-030-81854-8_11
20. Zhu P, Cheng L, Gao C, Wang Z, Li X. Locating Multi-Sources in Social Networks with a Low Infection Rate. IEEE Trans Netw Sci Eng (2022) 9:1853–65. doi:10.1109/TNSE.2022.3153968
Keywords: air transportation, key airport identification, weighted node contraction method, aviation network, centrality
Citation: Zhang H, Zhao J, Wang J and Zhu P (2022) An Optimization Method for Critical Node Identification in Aviation Network. Front. Phys. 10:944136. doi: 10.3389/fphy.2022.944136
Received: 14 May 2022; Accepted: 16 June 2022;
Published: 08 August 2022.
Edited by:
Wei Wang, Chongqing Medical University, ChinaReviewed by:
Shunqiang Ye, Anhui University, ChinaYin-Jie Ma, East China University of Science and Technology, China
Peng Hu, University of Évry Val d'Essonne, France
Copyright © 2022 Zhang, Zhao, Wang and Zhu. This is an open-access article distributed under the terms of the Creative Commons Attribution License (CC BY). The use, distribution or reproduction in other forums is permitted, provided the original author(s) and the copyright owner(s) are credited and that the original publication in this journal is cited, in accordance with accepted academic practice. No use, distribution or reproduction is permitted which does not comply with these terms.
*Correspondence: Peican Zhu, ZXJpY2NhbkBud3B1LmVkdS5jbg==