
94% of researchers rate our articles as excellent or good
Learn more about the work of our research integrity team to safeguard the quality of each article we publish.
Find out more
ORIGINAL RESEARCH article
Front. Phys., 12 July 2022
Sec. Soft Matter Physics
Volume 10 - 2022 | https://doi.org/10.3389/fphy.2022.940980
This article is part of the Research TopicActive and Intelligent Living Matter: from Fundamentals to ApplicationsView all 7 articles
 Fabian Jan Schwarzendahl 1,2*
 Daniel A. Beller 3,2*
Recent studies have shown that packings of cells, both eukaryotic cellular tissues and growing or swarming bacterial colonies, can often be understood as active nematic fluids. A key property of volume-conserving active nematic model systems is chaotic self-mixing characterized by motile topological defects. However, for active nematics driven by growth rather than motility, less is understood about mixing and defect motion. Mixing could affect evolutionary outcomes in bacterial colonies by counteracting the tendency to spatially segregate into monoclonal sectors, which reduces the local genetic diversity and confines competition between subpopulations to the boundaries between neighboring sectors. To examine whether growth-driven active nematic physics could influence this genetic demixing process, we conduct agent-based simulations of growing, dividing, and sterically repelling rod-like bacteria of various aspect ratios, and we analyze colony morphology using tools from both soft matter physics and population genetics. We find that despite measurable defect self-propulsion in growth-driven active nematics, the radial expansion flow prevents chaotic mixing. Even so, at biologically relevant cell aspect ratios, self-mixing is more effective in growing active nematics of rod-like cells compared to growing isotropic colonies of round cells. This suggests potential evolutionary consequences associated with active nematic dynamics.
The study of active matter provides insights into the collective motions of living and internally driven systems by marrying far-from-equilibrium dynamics with the physics of partially ordered materials [1, 2]. In co-moving groups of vertebrates such as flocks of birds and schools of fish, as well as in flocks of self-propelled colloids, the emergent order is typically polar orientational alignment analogous to ferromagnets [1, 3–5]. Meanwhile, active matter with the apolar orientational order of nematic liquid crystals occurs in vibrated granular rods [6] and in a wide variety of systems at the microscale, including suspensions of cytoskeletal biofilaments and motor proteins [7, 8], monolayers of eukaryotic cells [9–11], and morphogenesis of the animal Hydra [12]. The non-equilibrium production of nematic disclinations is now recognized in a broad variety of 2D systems as a signature of active nematic physics [1, 7, 13–16]. Activity produces pairs of ±1/2-winding number disclinations, with the +1/2 defect behaving like a self-propelled particle.
Swarms of motile bacteria are a paradigmatic example of active matter [17–25]. Recently, it has been shown that even non-motile bacteria can behave as an active nematic simply by growing, dividing, and pushing against their neighbors [26–36]. We will refer to this scenario as the “growing active nematic”, in contrast to the better-studied active nematic of fixed size. Experiments have demonstrated that E. coli colonies form nematic microdomains of well-aligned rods, with neighboring domains meeting at grain boundary lines punctuated by disclination point-defects of winding number ±1/2 [27, 28, 32]. Agent-based simulations have found that simple mechanical models of growing, dividing, and mutually volume-excluding cells are sufficient to reproduce this nematic microdomain structure [28, 34]. For rod-like bacteria, these mechanical interactions create torques causing nearby cells to align their long axes in the apolar manner of nematic liquid crystals. An observed steady-state density of disclinations, maintained by a balance of ±1/2 defect pair-annihilation with pair-creation, represents a key similarity between growing and fixed-size active nematic systems. A similar non-equilibrium steady-state population of disclinations is found in continuum hydrodynamic simulations, which predict that +1/2 defects self-propel as they do in fixed-size active nematics [28, 31, 32].
Chaotic self-mixing is one of the most striking features of fixed-size active nematics [7, 16, 37], drawing comparisons to turbulent flow [38, 39]. In the microtubule-kinesin active nematic model system, the chaotic self-advection was quantified in Ref. [37] through measures of material stretching including the Lyapunov exponent. A strong correspondence was found between the fluid self-mixing and the topological entropy measurement of braiding in the trajectories of +1/2 defects: With time viewed as a third spatial dimension, the defect trajectories trace out curves that collectively form non-trivial braids in the topological sense, meaning that, with the curves forbidden to pass through each other and with their ends held fixed, there is no way to disentangle them. In the absence of this braiding, there would be no chaotic mixing of the material. This supports a coarse-grained picture of active nematic chaos in which the +1/2 defects are stirring rods, efficiently mixing the viscous fluid around them.
Does defect-driven, chaotic self-mixing occur also in growing active nematics? The answer may impact the evolutionary fate of the colony because of an apparently opposite trend exhibited by growing colonies of immotile cells: Genetic demixing, or gene segregation, divides the expanding colony into sectors that each consist of only closely related cells [40–42]. In radially growing colonies, many genetic sectors are lost to coarsening dynamics at early times, after which an “inflationary” epoch occurs in which sectors grow without interacting [43].
This demixing is a particularly stark manifestation of the general loss of local genetic diversity found in more recently colonized areas when a species expands its range—whether arising from microbial colony growth in a Petri dish or from invasive species at scales up to the continental [44, 45]. Genetic drift, the random fluctuations in allele frequencies from one generation to the next, acts far more strongly at the expansion periphery than in the homeland, as new regions become dominated by the alleles that happened to be carried there first (founder effect) [40, 46]. Consequently, Darwinian selection has comparatively less influence with which to promote adaptation [47], leaving the population more vulnerable to e.g. deleterious mutations, diseases, and environment changes.
Taken together, genetic demixing and active self-mixing raise the possibility of evolutionary consequences for growing bacterial colonies exhibiting active nematic behavior: If growing active nematics experience the efficient physical mixing observed in fixed-size active nematics, then this internal reorganization may partially counteract or delay genetic demixing.
In considering the interplay between active nematic mixing and genetic demixing, we note that the two phenomena have mostly been studied under different nutrient conditions. For growing active nematics, researchers have so far assumed nutrient-rich conditions, meaning that bacterial growth rates are independent of the cell’s position in the colony. In contrast, studies of genetic demixing usually assume nutrient availability to be low enough that growth occurs only within a short distance from the expansion front [33, 35]. However, gene segregation still occurs in the nutrient-rich (bulk-driven growth) scenario studied for active nematics, albeit with less sharp boundaries between genetic sectors [42], as we will see below in small aspect-ratio rods (Figure 6A).
In this article, we computationally investigate whether defect-driven active self-mixing helps growing bacterial colonies to maintain local genetic diversity. Using a minimal mechanical model of growing and dividing rod-like cells, we study active nematic dynamics and population evolution in tandem, including a quantitative study of defect motion and gene segregation for cells of various aspect ratios. Our findings shed light on unexpected subtleties in comparing growing to non-growing active nematics, and on potential evolutionary consequences related to emergent active matter dynamics.
We model growing bacteria as two-dimensional expanding rods, whose diameter d0 is fixed and whose length li expands with a mean growth rate g up to length l0 (Figure 1A). When a rod reaches length l0 it splits into two rods of length l0/2. The growth of each rod with rate gi is linear in time, and for each rod we choose gi to be a random variable in the interval [g/2, 3g/2] to avoid synchronization effects [28]. Following mechanics-focused approaches used in recent computational studies of bacterial colonies [28, 34, 48–50], the rods’ dynamics are governed by an overdamped motion for the positions ri and orientations
where ζ is a friction coefficient, ez is the unit vector that is perpendicular to the plane of motion of the rods, rij = ri − rj is the separation vector between two rods, and Fij are the forces between rods. The forces are modeled using a Hertzian repulsion, which reads
where F0 is the repulsion strength, hij is the overlap length of particle i and j, and nij is the normal vector of the particles’ closest point of contact (Figure 1B). In the following we use l0 as a unit of length, and g as a unit of velocity, implying a natural unit of time l0/g. Our model has two dimensionless parameters, which are the aspect ratio l0/d0 and gζ/(F0l0); the latter we keep fixed to gζ/(F0l0) = 5 × 10⁻⁷. We simulate up to 25,000 rods from an initial state of a single rod.
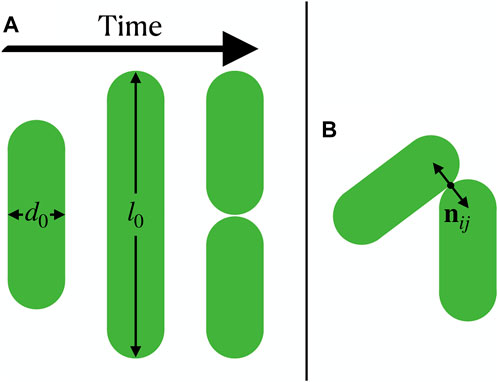
FIGURE 1. Growing bacteria modeled as expanding rods. (A) A rod grows, reaches length l0 and splits into two. (B) Interaction between two rods, where the normal vector nij of the particles’ closest point of contact is shown.
To analyze the simulated colonies, we compute a nematic tensorial orientation field from our particle-based simulations. Following Ref. [32], we apply a smoothing function that transforms the ith particle into
where Δri = r − ri is the separation from the particle’s position ri;
where the sum runs over particle indices i and μ, ν refer to the vector components, and the nematic order parameter is
where vi = dri/dt is the velocity of an individual particle approximated from its displacement in the most recent timestep.
Before studying colonies containing many defects, we examine the early-time behavior of isolated nematic defects programmed into the colony’s initial condition. In hydrodynamic field theories of fixed-size active nematics, director fields containing isolated defects display very distinct vorticity patterns depending on whether the defect has positive or negative charge: a +1/2 defect generates two regions of opposite vorticity nearby, resulting in a net active force in the transverse direction, whereas a −1/2 defect is surrounded by a threefold-symmetric pattern of alternating vorticity that produces no net force at the defect core [14, 39].
To investigate whether this picture applies in the case of growing active nematics, we initialize our simulation with rod orientations approximating an individual defect. We then allow the colony to grow until each cell has doubled at least once, resulting in the configurations shown in Figures 2A,D for a −1/2 and +1/2 defect respectively. Figures 2B,E display the corresponding nematic field, exhibiting the typical structures of +1/2 and −1/2 defects.
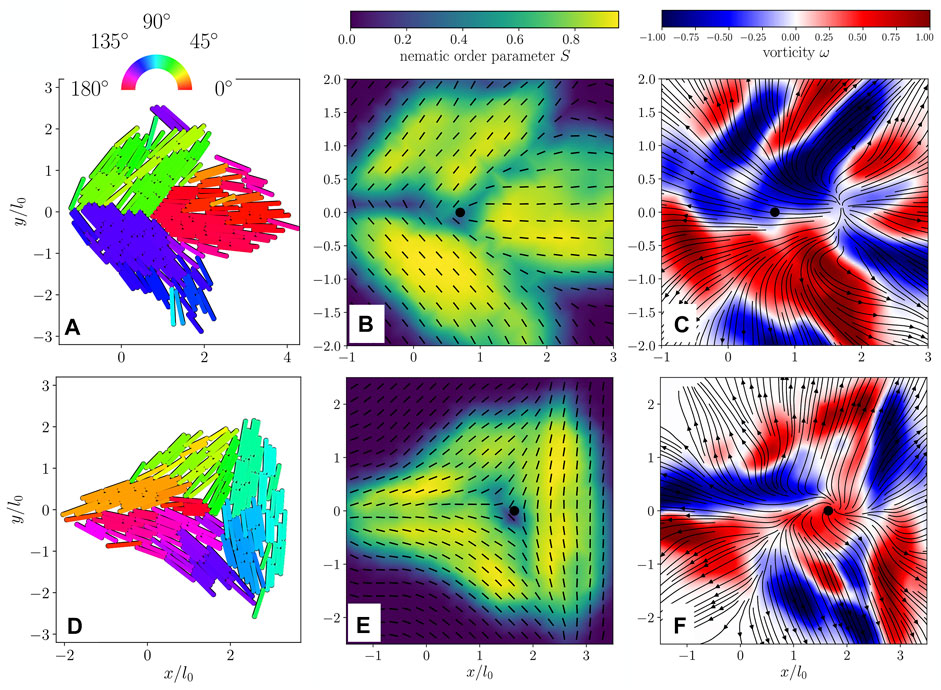
FIGURE 2. (A) Simulated configuration of an isolated + 1/2 defect. Color code shows the orientation of each rod. (B) Nematic director field (black lines) and nematic order parameter (color code) extracted from the configuration in (A). (C) Flow field (black lines) and vorticity (color code) extracted from the configuration in (A). (D) Configuration of an isolated − 1/2 defect. (E) Nematic director (black lines) and order parameter (color code) extracted from the configuration shown in (D). (F) Flow field (black lines) and vorticity (color code) extracted from (D). The black filled circle in (B,C,E,F) shows the location of the defect core. Particles have aspect ratio l0/d0 = 10.
The velocity field reveals a flow generally oriented radially outward from the center of the colony for both +1/2 and −1/2 defects (see Figures 2C,F), which is induced by the radial outward growth of the colony. We also computed the flow fields’ vorticity
Typical simulation snapshots resulting from a single-cell initial condition are shown in Figures 3A–C, displaying the growth of a colony. Consistent with prior work [28], we find microdomains of rods with similar orientation. Neighboring microdomains meet at grain boundaries, many of which contain nematic point-disclination defects. Figure 3D shows a typical nematic field for a colony at the end of a simulation, where we mark nematic defects with +1/2 (magenta arrows) and −1/2 (red circles) charge. The defects are identified by integrating changes in orientation on a small circuit around every point in the nematic field, leading to a number of defect candidates around each (true) defect position, which is then found using a clustering algorithm.
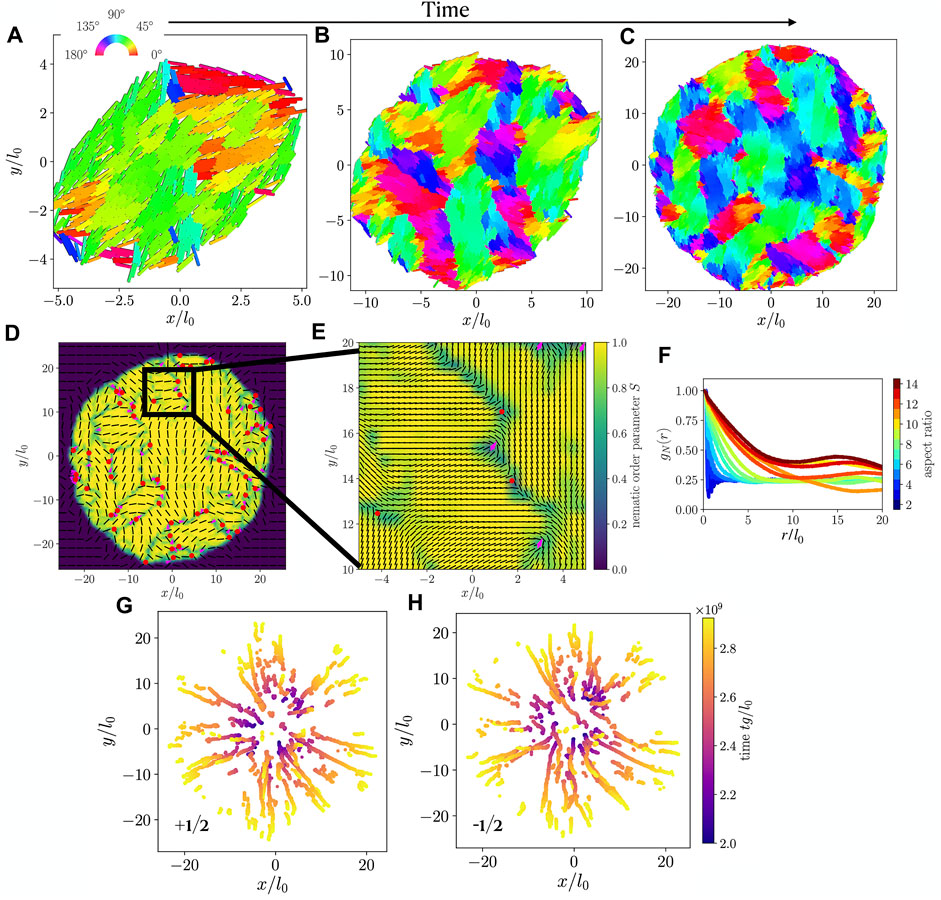
FIGURE 3. (A–C) Snapshots of a simulated colony, with particles colored by orientation, at times tg/l0 equal to (A) 2 × 10⁹, (B) 2.5 × 10⁹, (C) 3 × 10⁹. Particles have aspect ratio l0/d0 = 10. (D) Nematic orientation field (black lines) and nematic order parameter (color code) calculated for the simulation snapshot shown in (C). Defects of charge −1/2 and +1/2 are marked with red dots and magenta arrows, respectively. (E) Zoom-in of the black box shown in (D). (F) Orientational correlation function gN(r) as a function of interparticle distance r, for colonies with various cell aspect ratios. (G,H) Trajectories of +1/2 (G) and −1/2 (H) defects extracted from the nematic field of the colony shown in (A–C).
As shown in Figure 3E, this method identifies defects reliably such that we can extract defect trajectories. These are shown in Figure 3G for +1/2 defects and in Figure 3H for −1/2 defects. For both defect types, we observe a predominant radial outward trend, implying that the expansion of the colony has a strong influence on the defect motion.
The absence of significant braiding among the +1/2 defect trajectories (Figure 3G) represents a notable distinction from fixed-size active nematics, where such braiding corresponds strongly to the active material’s chaotic flow field [37]. Relatedly, we find that Lyapunov exponents calculated for our system, using the velocity field of Eq. 6 (see also [37]), are statistically indistinguishable from zero, regardless of particle aspect ratio. Chaotic dynamics are characterized by nonzero Lyapunov exponents, as these measure the separation rate of two infinitesimally close trajectories.
As a measure of nematic order, we compute the orientational correlation function, commonly used for characterizing nematic liquid crystals [51], which reads
where
We now examine the statistical properties of the nematic defects’ motion. First, we compute their velocities v and their speed distribution, shown in Figure 4A. We find that both types of defects have a peak at intermediate speeds, which is more prominent for +1/2 defects. Conversely, and surprisingly, higher speeds are somewhat more common for −1/2 defects. A similar picture arises when we project the defects’ velocities onto the radially (from the center of mass of the colony) outward direction at the defect’s position (Figure 4B). Again, both +1/2 and −1/2 defects show a peak at a positive value, and the −1/2 defects’ distribution is enhanced towards high radial velocities. That is, while colony growth generally pushes all defects farther from the colony center, outward radial motion is greater for −1/2 defects than for +1/2 defects.
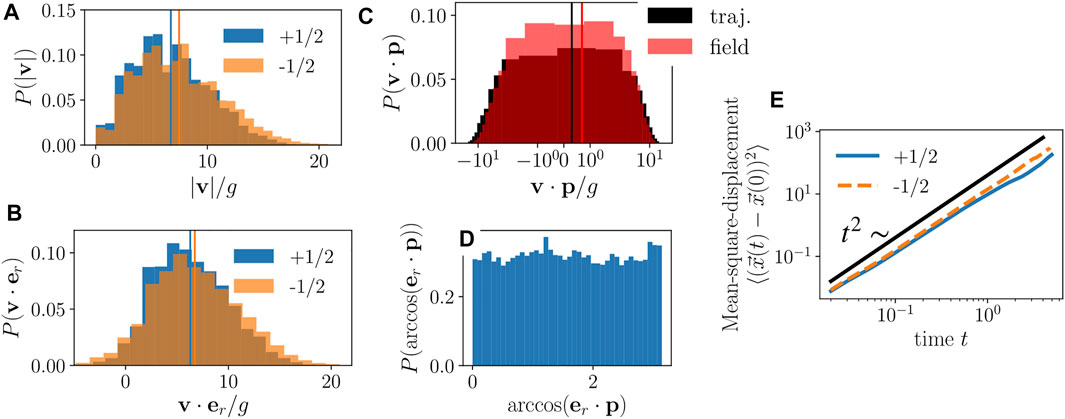
FIGURE 4. (A, B) Distributions of speeds (A) and radial component of velocity (B) of +1/2 (blue) and −1/2 (orange) defects. Vertical lines show mean of each distribution. (C) Distribution of velocity projected onto heading direction of +1/2 defects. For black bars the velocity was extracted from the defect trajectories while for the red bars the velocity was extracted from the flow field. Lines show the mean of the respective distributions. (D) Distribution of heading direction of +1/2 defects with respect to the radially outward unit vector from the colony’s center of mass. (E) Mean-square displacements of +1/2 (blue solid line) and −1/2 (orange dashed line) defects. Black line shows a t2 scaling. We used an aspect ratio of l0/d0 = 10 and averaged over defect trajectories from 10 independent simulation runs.
However, for +1/2 defects, we have a second contribution to their motion: the asymmetry in the nematic field around the defect leads to an active motion or “self-propulsion”, a well-known phenomenon in fixed-size active nematics [7, 13, 14]. To determine whether, and how strongly, + 1/2 defects self-propel in growing active nematics, we compute each defect’s heading direction p, the orientation of the “comet-head” arrangement in the nearby director field, which is computed using the polarization pμ = −∂νQμν/|∂νQμν| at the defect core. We then examine the projection of the defect’s velocity onto its heading direction. The defect’s velocity is computed with two independent methods, first from its trajectory and second from the velocity field v(r) at the defect’s location. The resulting distributions, shown in Figure 4C, both display a broad range of positive and negative values, but with a bias toward positive values. This implies that +1/2 defects move preferentially along their heading direction, the same defect self-propulsion trend found in fixed-size, extensile active nematics. We additionally find that the defect heading directions are isotropically distributed in the lab frame and have no significant correlation with the radial direction (Figure 4D).
The mean-square-displacement of defects (Figure 4E) shows a quadratic scaling with time, signifying ballistic motion, that stems from the radial expansion of the colony. Ballistic motion implies that the radial expansion dominates over the diffusive defect stirring dynamics typical of fixed-size active nematics [37, 39].
From the distributions in Figure 4, along with the defect trajectories in Figures 3G,H, the following conclusion emerges: While +1/2 defect self-propulsion is detectable in growing active nematics, the motion of +1/2 defects (as well as that of −1/2 defects) is dominated by the radial expansion flow.
We now turn to a population genetics perspective on mixing properties of our growing colonies, i.e. the degree of relatedness for spatially nearby cells. In order to quantify mixing of particles, we compute τ, the number of generations separating two cells phylogenetically, which is twice the number of generations since their most recent common ancestor (Figure 5A). Here, we first find the local neighbors of a particle i within a radius
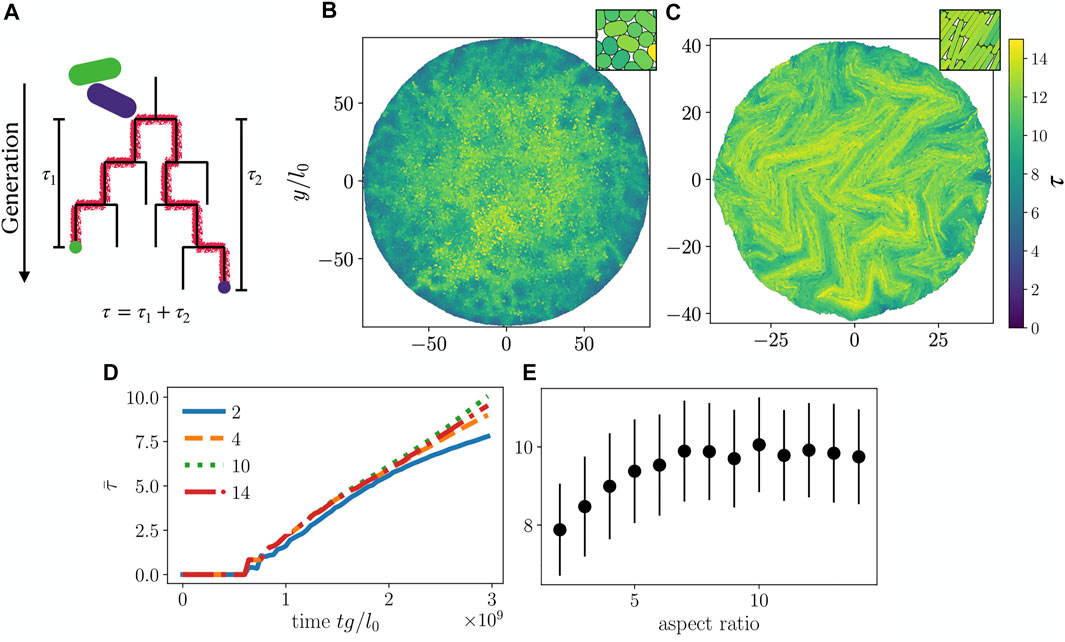
FIGURE 5. (A) Schematic for calculation of phylogenetic distance τ. The two particles (green and purple) are neighbors. Green and purple dots mark the particles of interest at present time, while red lines trace their ancestry back to the common ancestor. (B,C) τ calculated for each cell in colonies with cell aspect ratio (B) 2 and (C) 10. Insets in (B,C) show a magnified view of the center of each colony. (D) Colony average
On a global level, we determined the average phylogenetic distance
To make a connection to experiments [35, 40, 41] we performed simulations with two “alleles” (yellow and blue colors in Figures 6A,B) assigned randomly once the colony has reached N = 100 particles. Subsequently, cell division preserves the mother cell’s allele in both daughter cells, giving rise to the allele distributions shown in Figures 6A,B. As with the
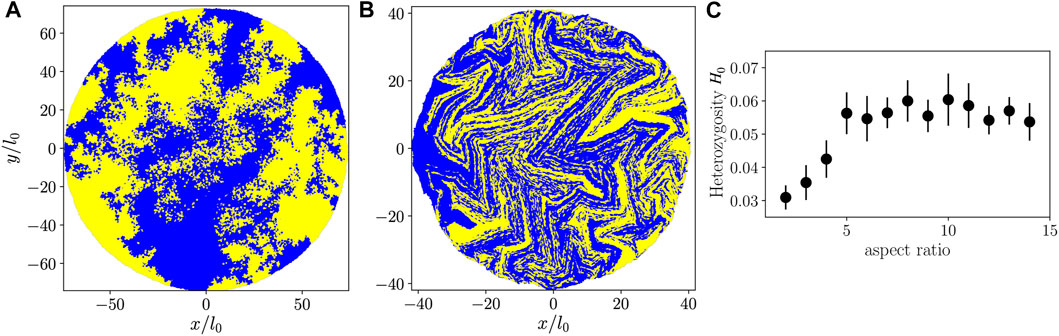
FIGURE 6. (A,B): Colonies with two alleles represented by yellow and blue colors, with cells having aspect ratio 2 (A) or 10 (B). (C) Heterozygosity as a function of aspect ratio at the end of each simulation (from a single simulation run per aspect ratio).
As a measure of genetic mixing in our two-allele representation, we compute the heterozygosity H, which, most generally, is the probability that two randomly selected organisms in the population share the same allele, but which can depend on distance r in spatially structured populations [41]. H is accessible to measurement in an experimental setting [35, 40, 41]. We study the small-distance limit of H(r) averaged over all cells in the colony, which we call H0, by considering all pairs of neighboring particles. With this restriction, the probability that two particles have different alleles equals the probability that both cells are on a line of contact between blue and yellow sectors, which recasts H0 as a geometric measurement. For our simulations we compute H0 = CBY/AB from configurations like Figures 6A,B, where CBY is the contour length of contact between blue and yellow sectors (including single-particle “sectors”), and AB is the total area occupied by the blue particles. Similarly to
For a given Brownian dynamics simulation, we measure H0 for an ensemble of random blue/yellow color assignments when the colony has size N = 100 particles, propagating the colors forward in time by following the simulation’s phylogenetic tree, obtaining additional configurations similar to Figures 6A,B. These are used to compute the colony-averaged value of H0 and its associated standard deviation, shown in Figure 6C. We find that for smaller aspect ratios, heterozygosity increases with increasing aspect ratio, implying an enhanced genetic mixing. Comparing our findings for
It is possible that simulations of larger systems would observe active nematic self-mixing more akin to the fixed-size case. The exponentially increasing computational expense with number of generations favors continuum models at these larger scales. Agent-based modeling such as the results we have presented can help to constrain and validate continuum hydrodynamic models for these purposes.
Motivated by the possibility that active mixing dynamics might counteract genetic demixing, we have presented results from particle-based computational modeling of growing colonies of immotile bacteria. To the question of whether growing active nematics exhibit the self-mixing dynamics of fixed-size active nematics, a surprisingly “mixed” answer emerges from our findings. On one hand, growing active nematics bear many of the signatures of their fixed-size counterparts: not only do disclinations arise in ±1/2-winding number pairs, but the +1/2 defects behave like active quasiparticles that preferentially move along their “comet-head” direction, with an accompanying pair of counter-rotating vortices (for isolated defects) as predicted by hydrodynamic theory [14]. On the other hand, the active self-propulsion of +1/2 defects is generally small compared to the colony’s radial expansion flow, so that the trajectories of +1/2 and −1/2 defects appear very similar. Most importantly, +1/2 defect trajectories do not braid around each other; relatedly, we find no chaotic mixing in the flow field of bacterial cells.
Despite the absence of chaos, we find, with measures inspired by population genetics, that active nematic colonies of high-aspect ratio cells mix themselves more efficiently than active isotropic colonies of rounder cells. Self-mixing quality improves with increasing aspect ratio up to around
It is worthwhile to compare the relatively weak mixing that we observe in our simulated colonies with known results for coexistence of spatially structured populations that passively undergo reorganization, such as through diffusion or external advection. For aquatic species such as phytoplankton, hydrodynamic flows that are chaotic but not turbulent have been found in simulation to mix competing species imperfectly and heterogeneously, in a manner that promotes genetic diversity: Populations that would be out-competed to extinction in a well-mixed system are instead spatially isolated by the flow dynamics and thus maintained in the steady state [53]. When the competing species are antagonistic (suppress each other’s growth where they are in contact), fluid flow modifies an effective line tension between gene-segregated domains [54]. Conversely, when multiple spatially structured populations have mutualistic interactions, their ecology as a whole may be stabilized by the imperfect mixing effects of diffusion, which impedes extinction by enabling rare types to reproduce faster—an effect hypothesized to have been important to the origin of life [55].
These observations lead us to conjecture that, for internally driven flows in growing active nematics, weak mixing of the kind we observe may often be optimal, with regard to genetic diversity, by inhibiting both the local demixing of flow-free systems and the rapid extinction dynamics characteristic of well-mixed populations. Given the benefits of weak mixing to mutualistic ecologies [55], it will be interesting to explore whether communities of symbiotic species benefit from active nematic mixing if cells of one or both species have high aspect ratio.
The model presented here includes only the birth of new particles; in future work we aim to also include cell death and removal. For an equal birth and death rate, the model then becomes a typical active nematic (as in the simulations of Ref. [7]); interpolating between that limit and the one studied here parametrizes a family of possible active nematic models. Additionally, the view of our system as a nematic fluid ignores orientational discontinuities along linear grain boundaries, which have been shown to play in important role in confined, two-dimensional smectic liquid crystals of hard rods [56]. Applying this perspective and including grain boundaries into analysis of particle-based active nematics simulations might give new insights into the structure and growth of bacterial colonies. Further, it will be of both biological and physical interest to study growing active nematics in complex environments [57] such as a porous medium [58], and in particular with respect to dynamics of cell avalanches [59, 60].
There is also a broad range of questions inspired by population genetics that can be probed with this model, which we have used here to examine only the simplest scenario of neutral evolution without mutation or competition for nutrients. Inspired by studies on lattice models and reaction-diffusion-type models [41, 42, 45], other topics of interest to address with this model include: the fixation time of an advantageous allele; the survival time of a deleterious allele; the stability of a colony against “mutational meltdown” in the presence of both mutation and selection [43]; growth rate heterogeneity due to differential uptake of finite nutrient resources; and robustness of a genetically heterogeneous colony against a spatially or temporally heterogeneous environment [61–64]. Agent-based simulations incorporating these genetic scenarios alongside mechanics are a promising tool for combining the perspectives of population evolution and active matter dynamics, providing insights into the evolutionary consequences of emergent collective motions.
The raw data supporting the conclusions of this article will be made available by the authors, without undue reservation.
FS and DB designed the work and wrote the paper. FS performed the work.
The authors declare that the research was conducted in the absence of any commercial or financial relationships that could be construed as a potential conflict of interest.
All claims expressed in this article are solely those of the authors and do not necessarily represent those of their affiliated organizations, or those of the publisher, the editors and the reviewers. Any product that may be evaluated in this article, or claim that may be made by its manufacturer, is not guaranteed or endorsed by the publisher.
We gratefully acknowledge helpful discussions with Jimmy Gonzalez Nuñez, Jordan Collignon, Mikhal Banwarth-Kuhn, and Suzanne Sindi. We gratefully acknowledge computing time on the Multi-Environment Computer for Exploration and Discovery (MERCED) cluster (NSF Grant No. ACI-1429783).
1. Marchetti MC, Joanny JF, Ramaswamy S, Liverpool TB, Prost J, Rao M, et al. Hydrodynamics of Soft Active Matter. Rev Mod Phys (2013) 85:1143–89. doi:10.1103/revmodphys.85.1143
2. Needleman D, Dogic Z. Active Matter at the Interface between Materials Science and Cell Biology. Nat Rev Mater (2017) 2:1–14. doi:10.1038/natrevmats.2017.48
3. Bricard A, Caussin J-B, Desreumaux N, Dauchot O, Bartolo D. Emergence of Macroscopic Directed Motion in Populations of Motile Colloids. Nature (2013) 503:95–8. doi:10.1038/nature12673
4. Cavagna A, Giardina I. Bird Flocks as Condensed Matter. Annu Rev Condens Matter Phys (2014) 5:183–207. doi:10.1146/annurev-conmatphys-031113-133834
5. Menon GI. Active Matter. In: Rheology of Complex Fluids. Berlin, Germany: Springer (2010). p. 193–218. doi:10.1007/978-1-4419-6494-6_9
6. Narayan V, Ramaswamy S, Menon N. Long-Lived Giant Number Fluctuations in A Swarming Granular Nematic. Sci. (2007) 317:105–108. doi:10.1126/science.1140414
7. DeCamp SJ, Redner GS, Baskaran A, Hagan MF, Dogic Z. Orientational Order of Motile Defects in Active Nematics. Nat Mater (2015) 14:1110–5. doi:10.1038/nmat4387
8. Kumar N, Zhang R, de Pablo JJ, Gardel ML. Tunable Structure and Dynamics of Active Liquid Crystals. Sci Adv (2018) 4:eaat7779. doi:10.1126/sciadv.aat7779
9. Duclos G, Garcia S, Yevick HG, Silberzan P. Perfect Nematic Order in Confined Monolayers of Spindle-Shaped Cells. Soft Matter (2014) 10:2346–53. doi:10.1039/c3sm52323c
10. Kawaguchi K, Kageyama R, Sano M. Topological Defects Control Collective Dynamics in Neural Progenitor Cell Cultures. Nature (2017) 545:327–31. doi:10.1038/nature22321
11. Saw TB, Doostmohammadi A, Nier V, Kocgozlu L, Thampi S, Toyama Y, et al. Topological Defects in Epithelia Govern Cell Death and Extrusion. Nature (2017) 544:212–6. doi:10.1038/nature21718
12. Maroudas-Sacks Y, Garion L, Shani-Zerbib L, Livshits A, Braun E, Keren K. Topological Defects in the Nematic Order of Actin Fibres as Organization Centres of hydra Morphogenesis. Nat Phys (2020) 1–9. doi:10.1038/s41567-020-01083-1
13. Giomi L, Bowick MJ, Ma X, Marchetti MC. Defect Annihilation and Proliferation in Active Nematics. Phys Rev Lett (2013) 110:228101. doi:10.1103/physrevlett.110.228101
14. Giomi L, Bowick MJ, Mishra P, Sknepnek R, Cristina Marchetti M. Defect Dynamics in Active Nematics. Phil Trans R Soc A (2014) 372:20130365. doi:10.1098/rsta.2013.0365
15. Shankar S, Ramaswamy S, Marchetti MC, Bowick MJ. Defect Unbinding in Active Nematics. Phys Rev Lett (2018) 121:108002. doi:10.1103/physrevlett.121.108002
16. Duclos G, Adkins R, Banerjee D, Peterson MSE, Varghese M, Kolvin I, et al. Topological Structure and Dynamics of Three-Dimensional Active Nematics. Science (2020) 367:1120–4. doi:10.1126/science.aaz4547
17. Wensink HH, Dunkel J, Heidenreich S, Drescher K, Goldstein RE, Löwen H, et al. Meso-scale Turbulence in Living Fluids. Proc Natl Acad Sci U.S.A. (2012) 109:14308–13. doi:10.1073/pnas.1202032109
18. Bär M, Großmann R, Heidenreich S, Peruani F. Self-propelled Rods: Insights and Perspectives for Active Matter. Annu Rev Condens Matter Phys (2020) 11:441–66. doi:10.1146/annurev-conmatphys-031119-050611
19. Schwarzendahl FJ, Mazza MG. Maximum in Density Heterogeneities of Active Swimmers. Soft Matter (2018) 14:4666–78. doi:10.1039/c7sm02301d
20. Wioland H, Woodhouse FG, Dunkel J, Kessler JO, Goldstein RE. Confinement Stabilizes a Bacterial Suspension into a Spiral Vortex. Phys Rev Lett (2013) 110:268102. doi:10.1103/physrevlett.110.268102
21. Wioland H, Lushi E, Goldstein RE. Directed Collective Motion of Bacteria under Channel Confinement. New J Phys (2016) 18:075002. doi:10.1088/1367-2630/18/7/075002
22. Copeland MF, Weibel DB. Bacterial Swarming: a Model System for Studying Dynamic Self-Assembly. Soft Matter (2009) 5:1174–87. doi:10.1039/b812146j
23. Dombrowski C, Cisneros L, Chatkaew S, Goldstein RE, Kessler JO. Self-concentration and Large-Scale Coherence in Bacterial Dynamics. Phys Rev Lett (2004) 93:098103. doi:10.1103/PhysRevLett.93.098103
24. Ishikawa T, Pedley TJ. Coherent Structures in Monolayers of Swimming Particles. Phys Rev Lett (2008) 100:088103. doi:10.1103/PhysRevLett.100.088103
25. Copenhagen K, Alert R, Wingreen NS, Shaevitz JW. Topological Defects Promote Layer Formation in Myxococcus Xanthus Colonies. Nat Phys (2021) 17:211–5. doi:10.1038/s41567-020-01056-4
26. Volfson D, Cookson S, Hasty J, Tsimring LS. Biomechanical Ordering of Dense Cell Populations. Proc Natl Acad Sci U.S.A. (2008) 105:15346–51. doi:10.1073/pnas.0706805105
27. Sengupta A. Microbial Active Matter: a Topological Framework. Front Phys (2020) 8:184. doi:10.3389/fphy.2020.00184
28. You Z, Pearce DJ, Sengupta A, Giomi L. Geometry and Mechanics of Microdomains in Growing Bacterial Colonies. Phys Rev X (2018) 8:031065. doi:10.1103/physrevx.8.031065
29. You Z, Pearce DJG, Sengupta A, Giomi L. Mono- to Multilayer Transition in Growing Bacterial Colonies. Phys Rev Lett (2019) 123:178001. doi:10.1103/physrevlett.123.178001
30. You Z, Pearce DJG, Giomi L. Confinement-induced Self-Organization in Growing Bacterial Colonies. Sci Adv (2021) 7:eabc8685. doi:10.1126/sciadv.abc8685
31. Doostmohammadi A, Thampi SP, Yeomans JM. Defect-mediated Morphologies in Growing Cell Colonies. Phys Rev Lett (2016) 117:048102. doi:10.1103/PhysRevLett.117.048102
32. Dell'Arciprete D, Blow ML, Brown AT, Farrell FDC, Lintuvuori JS, McVey AF, et al. A Growing Bacterial colony in Two Dimensions as an Active Nematic. Nat Commun (2018) 9:4190–9. doi:10.1038/s41467-018-06370-3
33. Farrell FDC, Hallatschek O, Marenduzzo D, Waclaw B. Mechanically Driven Growth of Quasi-Two-Dimensional Microbial Colonies. Phys Rev Lett (2013) 111:168101. doi:10.1103/physrevlett.111.168101
34. van Holthe tot Echten D, Nordemann G, Wehrens M, Tans S, Idema T. Defect Dynamics in Growing Bacterial Colonies. arXiv preprint arXiv:2003.10509 (2020).
35. Farrell FD, Gralka M, Hallatschek O, Waclaw B. Mechanical Interactions in Bacterial Colonies and the Surfing Probability of Beneficial Mutations. J R Soc Interf (2017) 14:20170073. doi:10.1098/rsif.2017.0073
36. Shimaya T, Takeuchi KA. 3D-induced Polar Order and Topological Defects in Growing Bacterial Populations. arXiv preprint arXiv:2106.10954 (2021).
37. Tan AJ, Roberts E, Smith SA, Olvera UA, Arteaga J, Fortini S, et al. Topological Chaos in Active Nematics. Nat Phys (2019) 15:1033–9. doi:10.1038/s41567-019-0600-y
38. Thampi SP, Golestanian R, Yeomans JM. Vorticity, Defects and Correlations in Active Turbulence. Phil Trans R Soc A (2014) 372:20130366. doi:10.1098/rsta.2013.0366
39. Giomi L. Geometry and Topology of Turbulence in Active Nematics. Phys Rev X (2015) 5:031003. doi:10.1103/physrevx.5.031003
40. Hallatschek O, Hersen P, Ramanathan S, Nelson DR. Genetic Drift at Expanding Frontiers Promotes Gene Segregation. Proc Natl Acad Sci U.S.A. (2007) 104:19926–30. doi:10.1073/pnas.0710150104
41. Korolev KS, Avlund M, Hallatschek O, Nelson DR. Genetic Demixing and Evolution in Linear Stepping Stone Models. Rev Mod Phys (2010) 82:1691–718. doi:10.1103/revmodphys.82.1691
42. Banwarth-Kuhn M, Collignon J, Sindi S. Quantifying the Biophysical Impact of Budding Cell Division on the Spatial Organization of Growing Yeast Colonies. Appl Sci (2020) 10:5780. doi:10.3390/app10175780
43. Lavrentovich MO, Korolev KS, Nelson DR. Radial Domany-Kinzel Models with Mutation and Selection. Phys Rev E Stat Nonlin Soft Matter Phys (2013) 87:012103. doi:10.1103/PhysRevE.87.012103
44. Edmonds CA, Lillie AS, Cavalli-Sforza LL. Mutations Arising in the Wave Front of an Expanding Population. Proc Natl Acad Sci U.S.A. (2004) 101:975–9. doi:10.1073/pnas.0308064100
45. Klopfstein S, Currat M, Excoffier L. The Fate of Mutations Surfing on the Wave of a Range Expansion. Mol Biol Evol (2006) 23:482–90. doi:10.1093/molbev/msj057
46. Mayr E. Systematics and the Origin of Species, from the Viewpoint of a Zoologist. Cambridge: Harvard University Press (1999).
47. Elena SF, Lenski RE. Evolution Experiments with Microorganisms: the Dynamics and Genetic Bases of Adaptation. Nat Rev Genet (2003) 4:457–69. doi:10.1038/nrg1088
48. Rudge TJ, Steiner PJ, Phillips A, Haseloff J. Computational Modeling of Synthetic Microbial Biofilms. ACS Synth Biol (2012) 1:345–52. doi:10.1021/sb300031n
49. Smith WP, Davit Y, Osborne JM, Kim W, Foster KR, Pitt-Francis JM. Cell Morphology Drives Spatial Patterning in Microbial Communities. Proc Natl Acad Sci U.S.A. (2017) 114:E280–E286. doi:10.1073/pnas.1613007114
50. Ghosh P, Mondal J, Ben-Jacob E, Levine H. Mechanically-driven Phase Separation in a Growing Bacterial colony. Proc Natl Acad Sci U.S.A. (2015) 112:E2166–73. doi:10.1073/pnas.1504948112
51. Brézin L, Risler T, Joanny JF. Spontaneous Flow Created by Active Topological Defects. arXiv preprint arXiv:2202.00646 (2022). doi:10.1140/epje/s10189-022-00186-2
52. Greschek M, Schoen M. Finite-size Scaling Analysis of Isotropic-Nematic Phase Transitions in an Anisometric Lennard-jones Fluid. Phys Rev E Stat Nonlin Soft Matter Phys (2011) 83:011704. doi:10.1103/PhysRevE.83.011704
53. Károlyi G, Péntek Á, Scheuring I, Tél T, Toroczkai Z. Chaotic Flow: the Physics of Species Coexistence. Proc Natl Acad Sci U.S.A. (2000) 97:13661–5. doi:10.1073/pnas.240242797
54. Benzi R, Nelson DR, Shankar S, Toschi F, Zhu X. Spatial Population Genetics with Fluid Flow. arXiv preprint arXiv:2112.09079 (2021).
55. Czárán T, Szathmáry E. Coexistence of Replicators in Prebiotic Evolution. In: The Geometry of Ecological Interactions: Simplifying Spatial Complexity. Cambridge: Cambridge University Press (2000). p. 116–34. doi:10.1017/cbo9780511525537.009
56. Monderkamp PA, Wittmann R, Cortes LBG, Aarts DGAL, Smallenburg F, Löwen H. Topology of Orientational Defects in Confined Smectic Liquid Crystals. Phys Rev Lett (2021) 127:198001. doi:10.1103/physrevlett.127.198001
57. Bechinger C, Di Leonardo R, Löwen H, Reichhardt C, Volpe G, Volpe G. Active Particles in Complex and Crowded Environments. Rev Mod Phys (2016) 88:045006. doi:10.1103/revmodphys.88.045006
58. Kurzthaler C, Mandal S, Bhattacharjee T, Löwen H, Datta SS, Stone HA. A Geometric Criterion for the Optimal Spreading of Active Polymers in Porous media. Nat Commun (2021) 12:7088–10. doi:10.1038/s41467-021-26942-0
59. Courcoubetis G, Xu C, Nuzhdin SV, Haas S. Avalanches during Epithelial Tissue Growth; Uniform Growth and a drosophila Eye Disc Model. Plos Comput Biol (2022) 18:e1009952. doi:10.1371/journal.pcbi.1009952
60. Reichhardt CJO, Reichhardt C. Avalanche Dynamics for Active Matter in Heterogeneous media. New J Phys (2018) 20:025002. doi:10.1088/1367-2630/aaa392
61. Möbius W, Murray AW, Nelson DR. How Obstacles Perturb Population Fronts and Alter Their Genetic Structure. Plos Comput Biol (2015) 11:e1004615. doi:10.1371/journal.pcbi.1004615
62. Beller DA, Alards KMJ, Tesser F, Mosna RA, Toschi F, Möbius W. Evolution of Populations Expanding on Curved Surfaces (A). Europhys Lett (2018) 123:58005. doi:10.1209/0295-5075/123/58005
63. Chu S, Kardar M, Nelson DR, Beller DA. Evolution in Range Expansions with Competition at Rough Boundaries. J Theor Biol (2019) 478:153–60. doi:10.1016/j.jtbi.2019.06.018
Keywords: active matter, active nematics, microbial evolution, neutral evolution, genetic mixing, liquid crystals, topological defects, range expansion
Citation: Schwarzendahl FJ and Beller DA (2022) Do Active Nematic Self-Mixing Dynamics Help Growing Bacterial Colonies to Maintain Local Genetic Diversity?. Front. Phys. 10:940980. doi: 10.3389/fphy.2022.940980
Received: 10 May 2022; Accepted: 20 June 2022;
Published: 12 July 2022.
Edited by:
Tyler N. Shendruk, University of Edinburgh, United KingdomReviewed by:
Charles Reichhardt, Los Alamos National Laboratory (DOE), United StatesCopyright © 2022 Schwarzendahl and Beller . This is an open-access article distributed under the terms of the Creative Commons Attribution License (CC BY). The use, distribution or reproduction in other forums is permitted, provided the original author(s) and the copyright owner(s) are credited and that the original publication in this journal is cited, in accordance with accepted academic practice. No use, distribution or reproduction is permitted which does not comply with these terms.
*Correspondence: Fabian Jan Schwarzendahl , ZmFiaWFuLnNjaHdhcnplbmRhaGxAaGh1LmRl; Daniel A. Beller , ZC5hLmJlbGxlckBqaHUuZWR1
Disclaimer: All claims expressed in this article are solely those of the authors and do not necessarily represent those of their affiliated organizations, or those of the publisher, the editors and the reviewers. Any product that may be evaluated in this article or claim that may be made by its manufacturer is not guaranteed or endorsed by the publisher.
Research integrity at Frontiers
Learn more about the work of our research integrity team to safeguard the quality of each article we publish.