 Kaimin Zou1,2
 Ze-Rui Peng
- 1Department of Mechanics, School of Aerospace Engineering, Huazhong University of Science and Technology, Wuhan, China
- 2Hubei Key Laboratory for Engineering Structural Analysis and Safety Assessment, Wuhan, China
The hydrodynamic coupling of inverted flexible flags in side-by-side, left triangular and right triangular configurations in a uniform flow is investigated numerically. Various arrangements can be characterized by the lateral and longitudinal gaps, i.e., H and G, respectively. For the side-by-side configurations, three typical modes are identified in flapping region, i.e., in-phase quasi out-of-phase (QOP) and out-of-phase (OP) modes, corresponding to 2P, irregular and 4(P + S) wake patterns, respectively. Further analysis on the mean drag coefficient
1 Introduction
Fluid-structure interaction (FSI) phenomenon is ubiquitous in our daily life, such as bird/insect flight [1], fish swimming [2], vascular flow [3], and vibration of vocal fold [4]. Due to its important signification for understanding the fundamental principles in nature, and its extensive engineering applications, the FSI has been a topic of great attentions for a long time [5–8]. The flow-induced vibrations of flexible plates or flags in a flow is one of the typical examples for FSI problems that have been widely studied in recent years [9–13]. For a long time, people have been working to eliminate or reduce the flow-induced vibration of the plate-fluid coupling system to alleviate its disadvantages in engineering production and life [9], such as the snoring induced by the soft tissue in the human upper airway [14], the flutter of paper during printing process [15], and the flutters in aeronautics [16]. While, a recent concern for the plate-fluid systems is how to achieve the hydro- or aerodynamic advantages and/or performance enhancements from FSI. For examples, a flapping plate/filament immersed in fluids, which is used to mimic the motion of biological propellers such as insect wings and fish fins, have been studied numerically and experimentally [1, 5, 17]. One of the most important issues in these studies is about the role of varying kinematics and passive deformations in optimizing the propulsive performances [17, 18], e.g., improving thrust and saving energy.
Besides their application as propellers, this kind of flapping-based systems are also adopted as the potential devices for harvesting energy from surrounding flows [20–22], such as the uniform streams, vortices, and free-surface waves. The earlier idea of the energy harvesting devices was proposed by using a flapping-foil system. The harvesting performance and the underlying mechanism of this system at different conditions have been investigated widely in literature [23–25]. It is noting that in the studies above, the flapping rigid foils were only forced to heave and/or pitch in the flow, but did not undergo a passive deformation. However, a variety of studies have indicated that the passive flexible deformation may affect many aspects of the flapping-based systems, including the wake structures and the hydrodynamic performances [18, 19, 26–28]. Therefore, an nature-inspired energy harvesting system using the conventional flapping flexible plate with a piezoelectric material attached to its surface has been proposed [29]. In this system, the flexible plate is fixed at the leading edge, while the remainder of plate are free. It is found that for realistic coupling coefficients, as much as 10% of the fluid kinetic energy flux can be transmitted to the output circuit at certain parameters, suggesting that the flexible flapping system may be a promising approach for energy harvesting.
Moreover, further researches indicates that compared to the conventional flexible plate, an inverted flexible plate or flag with a free leading edge and a fixed trailing edge may be a better intermediary for the conversion of fluid kinetic energy to elastic strain energy. Kim et al. [10] have been studied experimentally the dynamics of a inverted flexible plate in a uniform flow. It is found that the behaviors of inverted flag can be classified into three regimes, i.e., the straight, flapping, and deflected modes, respectively. It is also suggested that a inverted flag in flapping mode can produce elastic strain energy several times larger than a sheet of the deformed mode, and the energy conversion ratio R may reach to 0.4 in some cases. Further, the experimental results have been verified by Ryu et al. [30] through simulations. Meanwhile, by using a combination of mathematical theory, scaling analysis and measurement, Sader et al. [31] give out that the large-amplitude flapping motion of the inverted flag is a vortex-induced vibration. Inspired by Kim et al. [10], to further reveal the dynamics and underlying mechanisms, more analytical [32], numerical [33–35], and experimental studies [32, 36] on the inverted flag have been conducted.
To harvest kinetic energy of ambient fluid efficiently, the coupling dynamics and performances of multiple flags in various configurations should be studied in depth and systematically. In recent years, there are some works that have made efforts in this direction [37–45]. Huang al et [37]. have investigated numerically the performance of two inverted flags in tandem configurations. It is observed that the drag coefficient and bending energy of the rear flag were usually reduced due to the destructive merging mode of vortices. But in some cases, such as the periodic arrangement, they may be enhanced due to the flow interactions between the front–rear flags, which may be even higher than those of an isolated case. Further, the experimental study [38] on the side-by-side inverted flags have shown that there may be five typical states in the flapping regime, i.e., the in-phase, anti-phase, staggered, alternating, and decoupled flapping modes. Compared to a isolated flag scenario, the increases in flapping amplitude and frequency were observed for the two-flag system in side-by-side configuration. Ryu et al. [39] numerically investigated flapping dynamics of the two side-by-side inverted flags in a uniform flow using the immersed boundary method. It is observed that the flapping motions of the flags, including the in-phase and out-of-phase modes, were determined from the spanwise gap between the trailing edges of the two flags. The large peak-to-peak amplitude and mean strain energy were achieved due to the intensified flapping motions of each flag. These conclusions are consistent with those observed in the experimental investigation [38]. Jia et al. [41] studied the effects of the initial conditions on the motion state formations for two flags in side-by-side configurations. Hu et al. [42] proposed a linear analysis for parallel inverted flags as an extension of previous studies [46–48]. The theoretical results, which is consistent with the experiments, indicated that the range of the in-phase flapping mode becomes smaller with an increase in the separation distance, and a multiple flapping state may occur. For n ≥ 2 parallel inverted flags, the theoretical results show that two of all coupled flapping modes are dominant with most parameters. Mazharmanesh et al. [43] numerically investigated the energy harvesting ability of two inverted piezoelectric flags in the tandem, side-by-side and staggered arrangements. It is found that the largest overall electric power coefficient will be achieved in the staggered arrangement, which indicats that this arrangement may be optimal for energy harvesting of two inverted flags.
However, compared to the rich literature on the single or two inverted flags in a flow, the studies on multi-flag systems, which consist of multiple inverted flags with more complex configurations, are very rare [44]. At present, the in-depth understanding of the coupling dynamics and performances of multiple flags in various configurations is still lacking. The question arises how to arrange each flag in configuration to enhance and optimize the overall energy harvesting. In the present study, we have numerically investigated the coupling dynamics of flow past inverted flags in three type of arrangements, i.e., the side-by-side, left triangular, and right triangular configurations, respectively. The purpose of this study is to explore the possible hydrodynamic performance, and reveal the underlying mechanism of lateral and longitudinal flow interactions in multi-flag systems.
The outline of present paper is as follows. The physical problem and mathematical formulation are described in Section 2.1, the numerical method and validation are presented in Section 2.2, the results are discussed in Section 3, and the conclusion remarks are addressed in Section 4.
2 Problem Description and Numerical Method
2.1 Physical Problem and Mathematical Formulation
Schematic diagram for fluid flows past flexible inverted flags in side-by-side, left triangular, and right triangular configurations in the present study is shown in Figure 1. The plates with the length L are immersed in a uniform inflow with speed U in the x-direction. The trailing edges of the flags are fixed, and the other parts can move freely and deform passively due to the flow-structure interactions. The geometry of the three configurations can be characterized by H and G, where H is the vertical distance between the parallel inverted flags, and G is the horizontal distance from the trailing edge of the front flag to the leading edge of the rear flag at the initial positions. φ(t) is the instantaneous flapping angle that can be defined as the angle from the negative direction of the x-axis to the line joining the fixed edge and the free edge of the flag, as shown in Figure 1C.
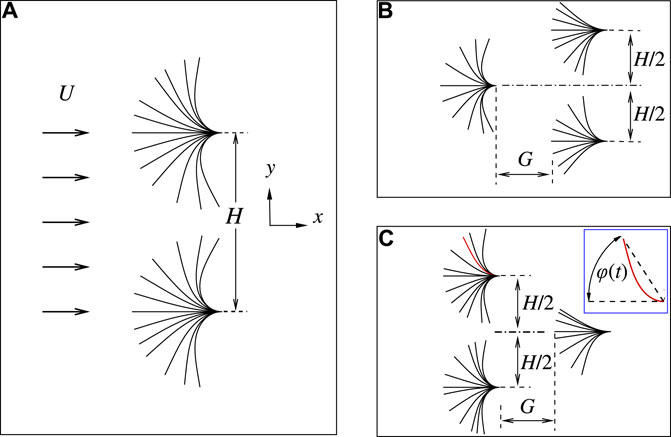
FIGURE 1. Schematic diagram for fluid flows past flexible inverted flags in side-by-side (A), left triangular (B) and right triangular (C) configurations. The plates are immersed in a uniform inflow with speed U in the x-direction. The trailing edges of the flags are fixed, and the remainders are free to move due to the flow-structure interaction. H is the vertical distance between the parallel inverted flags, and G is the horizontal distance from the trailing edge of the front flag to the leading edge of the rear flag at the initial positions. φ(t) is the instantaneous flapping angle that can be defined as the angle between the x-axis and the secant connecting the leading-edge to the trailing-edge.
In this system, the viscous fluid flow is governed by the incompressible Navier-Stokes equations,
where v = (u, v) is the velocity, v is the fluid velocity, ρ is the fluid density, p is the pressure, μ is the dynamic viscosity of the fluid, and f is the body force term. A uniform velocity U is set at the inlet boundary and the side boundaries of the fluid computational domain. A Neumann condition is specified at the outlet boundary. The flags are considered to be two-dimensional thin elastic beams and the deformation of the flags in a Lagrangian coordinate system can be described by the structure equation [37], i.e.,
where ρsh is the linear mass density of the flag, s is the Lagrangian coordinate along the flag, X is the position vector of the flag, FL is the Lagrangian force exerted on the flag by the surrounding fluid. Eh and EI are the stretching and bending stiffness, respectively. The boundary conditions at the free edge of the flag can be described as
At the fixed edge of the flag, the boundary condition is
where Xo is the coordinates of the fixed trailing edge of the flag [37].
The characteristic quantities, ρ, L, and U, are chosen to normalize the above equations. Thus the following dimensionless governing parameters are introduced: the Reynolds number Re = ρUL/μ, the bending stiffness K = EI/ρU2L3, the stretching stiffness S = Eh/ρU2L, the math ratio of the flag and the fluid M = ρsh/ρL, the vertical gap H/L, and the horizontal gap G/L. For the sake of simplicity, H and G is used to represent the dimensionless quantity H/L and G/L in the following descriptions.
2.2 Numerical Method and Validation
The governing equations of the fluid flow are solved numerically by the lattice Boltzmann method (LBM) [49]. The structure equation is solved by the finite element method (FEM). The boundary conditions mentioned above are imposed for each flag in the configurations. The immersed boundary method [50] is used to couple the motions of flag and fluid. The body force f in Eq. 1 represents an interaction force between the fluid and the immersed boundary to enforce the no-slip velocity boundary condition. The Lagrangian force FL in Eq. 3 can be obtained by the penalty scheme
where α and β are negative large penalty parameters which are selected based on the previous studies [17, 37, 51]. Here α = −10 and β = −1 are chosen by the parameter trials. Vs = ∂X/∂t is the velocity of the Lagrangian material point of the flag, and Vf is the fluid velocity at the position X obtained by interpolation
Then the body f on the Eulerian points is
Bases on our convergence studies with different computational domains, the computational domain for the fluid flow is chosen as 60L × 30L in the x and y directions. The domain is large enough so that the blocking effects of the boundaries are not significant. The mesh is uniform with spacing Δx = Δy = 0.01L. The flags is discretized with a mesh size of Δs = 0.01L. The time step here is Δt = T/10000 with T = L/U.
To further validate our numerical methods, an isolated inverted flag in a uniform flow is simulated with parameters Re = 250, K = 0.25, M = 1.0, S = 1,000. The parameters are identical to those in Huang et al. [37]. Figure 2A shows the time history of the lateral displacement of the leading edge of the inverted flag. It is seen that the results from our simulation are consistent with those in the work of Huang et al. [37].
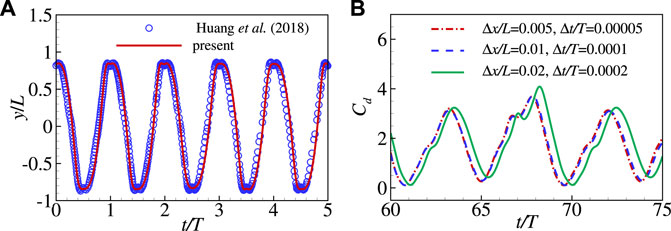
FIGURE 2. (A) Comparisons of the present and previous results [37] for the lateral displacement of the leading edge (yLE) of an inverted flag in a uniform (Re = 250, K = 0.25 and M = 1.0); (B) The time step and grid independence studies for case with Re = 200, M = 2.9, K = 0.3, and S = 1,000. Time variations of drag coefficient Cd calculated under Δx/L = 0.005, 0.01 and 0.02 and Δt/T = 0.00005, 0.0001 and 0.0002.
The time step and grid independence studies are also performed. Figure 2B shows the time-dependent drag coefficient calculated under the different grid spacings and time steps for the case with Re = 200, M = 2.9, K = 0.3, S = 1,000. It is confirmed that Δx/L = 0.01 and Δt/T = 0.0001 are sufficient to achieve accurate results. Hence, in all our simulations, Δx/L = 0.01 and Δt/T = 0.0001 are adopted.
In addition, the above numerical strategy has been successfully applied to a wide range of fluid-structure interaction problems, such as flow over a circle flexible plate [52], tandem flexible loops in a viscous flow [51], locomotion of one or more flexible flapping plates [19, 53–55].
3 Results and Discussion
In the present study, the flexible inverted flags in side-by-side, left triangular and right triangular configurations are considered. In our simulations, the gaps H and G are allowed to vary to achieve different configurations. The stretching stiffness is chosen a large value, i.e., S = 1,000, so that the flags can be regarded as unextensible. The Reynolds number and the mass ratio are fixed at Re = 200 and M = 2.9, respectively, which are consistent with those in Huang et al. [37]. When the above parameters are fixed, the flapping mode of an isolated flag would be achieved for the bending stiffness K ∈ (0.1, 0.4), according to the previous studies [30, 33, 37]. Thus, K = 0.3 is adopted in our simulations for two or more flags, at which the flapping modes with large amplitude are achieved.
The drag coefficient Cd(t) and the bending energy Eb(t) as functions of time are defined as
where Fx is the spatial integrated fluid force acting on flag projection along the x-direction and K is the bending coefficient. The mean drag coefficient Cd, bending energy Eb, and flapping angle Φ are defined as
In our study, the two flags in side-by-side configuration are investigated firstly. And then, an additional flag is placed in the front and rear of the two parallel flags to explore the dynamic performances of the flags in the left triangular and right triangular configurations, respectively.
3.1 Two Inverted Flags in Side-by-side Configurations
Based on a variety of simulations for the parameters considered here, we have identified three typical modes in flapping region, i.e., in-phase (IP), quasi out-of- phase (QOP) and out-of-phase (OP) modes, respectively. Figure 3A shows the time history of flapping angle φ(t) for each flag in the case with H = 0.2, corresponding to the IP mode. It is seen that, when the gap H is small, e.g., H ≤ 0.3, φ(t) experiences a small-amplitude and periodic variation with time in initial stage, and then flapping amplitudes rapidly increase at t/T ≈ 200. Meanwhile, the phase difference between φ1(t) and φ2(t) varies gradually from π to 0 (see Figure 3A), indicating that the two flags flap switching from antiphase to in-phase at last. This mode transition is more clear from the phase trajectory in the φ1-φ2 plane, as shown in Figure 3C. Figure 3B shows the structure envelops in one flapping period with the red solid lines denote the instantaneous shapes for both flags. It is seen that, although each flag flaps with a deflected average angle Φ, the two flags together with a small gap H behaves like a single one.
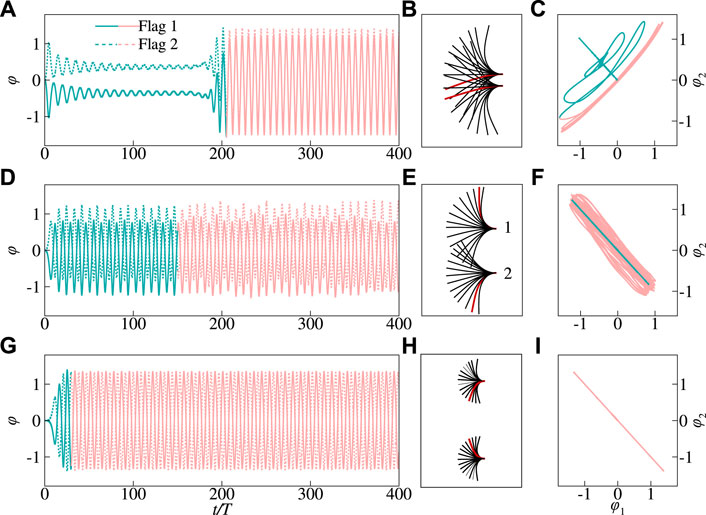
FIGURE 3. Time history of the instantaneous flapping angle φ on the left (A,D,G), the superimposed views of the flags on the middle (B,E,H), and the phase trajectories in φ1− φ2 planes on the right (C,F,I) for distinct modes in the side-by-side inverted flags, i.e., in-phase mode with H =0.2 (A,B,C), quasi out-of-phase mode with H =0.9 (D,E,F) and out-of-phase mode with H =3 (G,H,I). The other governing parameters are as follows: Re =200, M =2.9, K =0.3 and S =1,000. Flag 1 and Flag 2 represent the upper and lower flags, respectively. The red beams on the middle column represent the instantaneous position of the flags at a certain instant. The phase diagrams have been colored to represent time, with the curve being initially green and shifting to red as time advances.
As the gap increases, e.g., 0.3 < H ≤ 2.2, the system may operate in a quasi out-of-phase flapping mode as shown in Figures 3D,E,F. From the phase trajectory in the φ1-φ2 plane in Figure 3F, it is clear that the phase difference is close to π. It should be noted that for the quasi out-of-phase mode with narrow gap, the flags may collide with each other when they flap towards each other and reach the transverse maximum displacement (see Figure 3E), which is also observed in the previous simulations and experiments [30, 40, 44]. The collisions in these cases are harmful for bending energy enhancement, and thus the corresponding configurations should be excluded from the potential applications. When the gap H increases further, e.g., H ≥ 2.4, the two flags would flap in out-of-phase with the phase trajectory appearing as a straight line, as shown in Figures 3G,H,I. For each flag, the flapping amplitude is similar to that for the isolated flag due to the flow interaction between the two flags is greatly reduced (Figures 3G,H).
Figure 4 show the instantaneous vorticity contours for the typical cases of the three modes. For the case with H = 0.1 corresponding to the IP mode, the two vortices with opposite vorticity sheds from the leading and trailing edges of each flag, respectively, over the half flapping cycle, forming a vortex pair downstream in the wake. Thus, the vortical wake manifest itself in a 2P mode in the far wake (see Figure 4A). Whereas for the case with H = 0.9 corresponding to the QOP mode (see Figure 4B), the non-periodical vortex shedding leads to an irregular wake in the far field. Further, as illustrated in Figure 4C, the 4(P + S) mode of vortex shedding is observed along the entire wake of the flow field for the case with H = 3 corresponding to the OP mode. It is also noted that for this mode the arrangement of vortices is symmetric about y = 0.
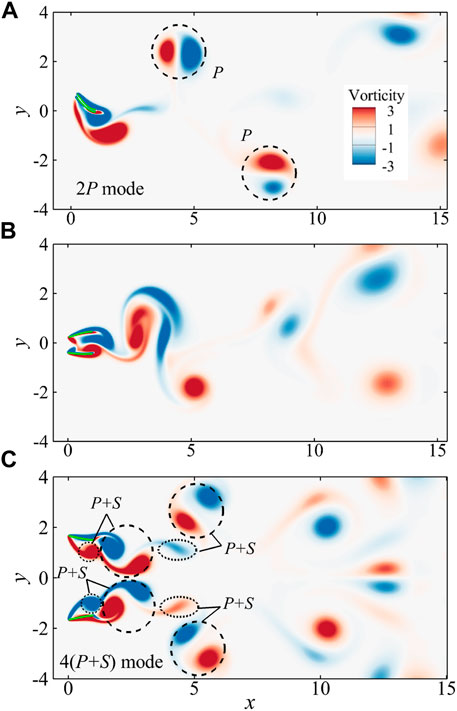
FIGURE 4. The instantaneous vorticity contours in side-by-side configurations: (A) the in-phase mode with H = 0.1; (B) the quasi out-of-phase mode with H = 0.9; (C) the out-of-phase mode with H = 3. The 2P and 4(P + S) mode are observed in the wakes for the in-phase and out-of-phase modes, respectively. The vortex shedding and movement are non-periodic for the quasi out-of-phase mode, which leads to an irregular wake.
To further explore the dynamic responses of the two side-by-side inverted flags in a flow, the mean drag coefficient
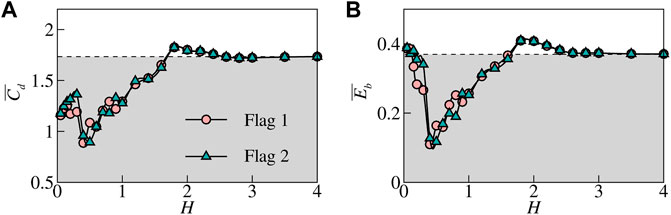
FIGURE 5. The mean drag coefficient
3.2 Three Inverted Flags in Left Triangle Configurations
In this section, an additional inverted flag will be placed in front of the side-by-side flags to form a three-flag system, which is denoted as the left triangle arrangement, as illustrated in Figure 1B. In this way, the longitudinal flow-mediated interaction among the front and rear flags, which may affect the coupling responses of the overall system, is considered. In the present study, the distinct left triangle arrangements are realized by varying the front-to-rear and up-to-down gaps, i.e., G and H, respectively, as shown in Figure 1B. Based on the results from our simulations, three typical modes of the coupling system can be identified for varying H and G, i.e., the regular-coupled (RC), irregular-coupled (IC) and decoupled (DC) modes, respectively.
Figure 6A shows the time history of the angle φ(t) for the typical case with G = 1 and H = 0.2, which corresponds to the RC mode. It is seen that, when the gap H is small, the flapping amplitudes of the rear flags, i.e., φ2 and φ3, experience anti-phase and periodic variations with time initially; Meanwhile, the flapping amplitudes increase obviously and the phase difference shifts from φ ≈ π to φ ≈ 0 after t/T ≈ 100, which is similar to that in the two-flag system (see Figure 3A). Also, it is noted that the flapping amplitude for each rear flag is much less than that in the two-flag system (Figure 3A). From the envelops in one flapping period as shown in Figure 6B, the flapping angles as well as the overall windward area of the rear flags are much less than those of the front one, leading to a decrease in bending energy harvesting by each flag (see Figure 8D). Further, the phase trajectories in the φ3 − φ2 and φ1 − φ2 planes are also shown in Figure 6C and Figure 6D, respectively. It is seen that the rear two flags flap in the same phase after a time (Figures 6A,C), whereas the front and rear flags flap in a fixed phase difference (Figure 6D).
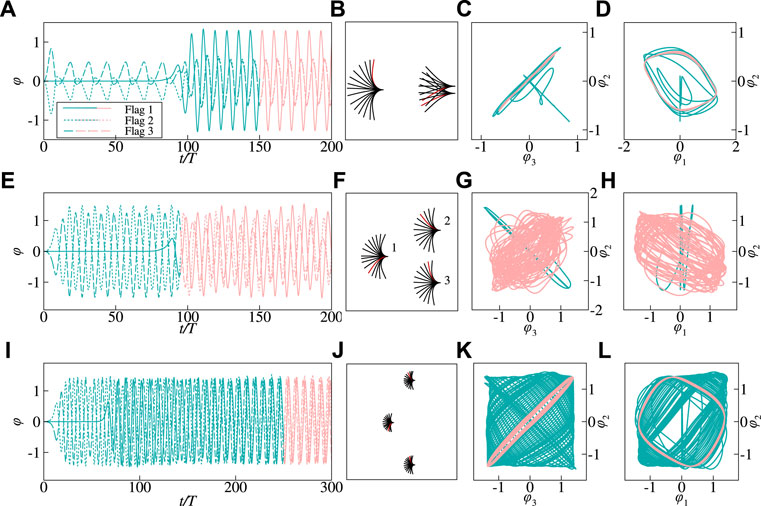
FIGURE 6. Time history of the instantaneous flapping angle φ (A,E,I), the superimposed views of the flags (B,F,J), and the phase trajectories in φ3− φ2 plane (C,G,K) and φ1− φ2 (d, h, l) plane for distinct modes in left triangle configurations, i.e., regular-coupled (RC) mode with G =1, H =0.2 (A,B,C,D), irregular-coupled (IC) mode with G =1, H =2 (E,F,G,H) and decoupled (DC) mode with G =1, H =8 (I, J, K, L). The other governing parameters are as follows: Re =200, M =2.9, K =0.3 and S =1,000. Flag 1 represents the front flag, and Flag 2 and 3 represent the rear upper and lower flags, respectively. The red beams in the second column figures represent the instantaneous position of the flags at a certain instant. The phase diagrams have been colored to represent time, with the curve being initially green and shifting to red as time advances.
Figures 6E–H show the behavior of system in IC mode for case with G = 1 and H = 2. In this mode, as shown in Figure 6E, the flags flap with irregularly varying amplitudes and frequencies. Also, it is shown in Figures 6G,H that the phase trajectories are chaotic, indicating that the flapping phase differences between the flags vary with time. Further, we note that for the rear flags, the max amplitude is comparable to that of the isolated one (see Figure 6F), whereas the mean flapping amplitude is much less because the flags can not reach the pick in φ for most of the time (see Figure 6E). This would result in a decrease in the mean drag
For the case with G = 1 and H = 8, corresponding to the decoupled (DC) mode, all the flags flap with the constant and identical amplitudes as shown Figures 6I,J. Thus, the
Figure 7 shows the phase diagrams for the three typical modes in the G − H plane. The symbols △, □ and ○ denote the cases in regular-coupled (RC), irregular-coupled (IC) and decoupled (DC) modes, respectively. As one can see, the distinct mode regions can be divided roughly by H when G ≥ 1, namely, the RC, IC and DC modes mainly distributed in the regions with lower (e.g., H < 0.6), moderate (e.g., 1 < H < 3) and larger (e.g., H > 4) lateral spacing, respectively.
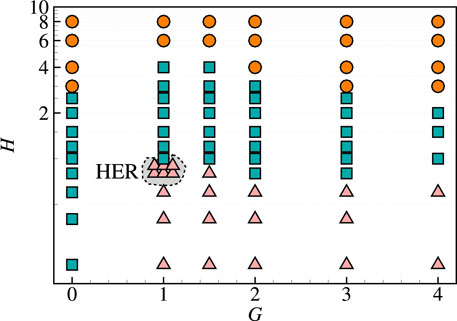
FIGURE 7. Overview of the typical mode regions on the G-H plane for the three flags in left triangle configurations. The symbols △, □ and ○ denote the regular-coupled (RC), irregular-coupled (IC) and decoupled (DC) modes, respectively. The harvest enhancement region (HER), where the average bending energy of the system is enhanced due to the favorable arrangements. The other governing parameters are as follows: Re =200, M =2.9, K =0.3 and S =1,000.
To provide a quantitative description for the system performances, the
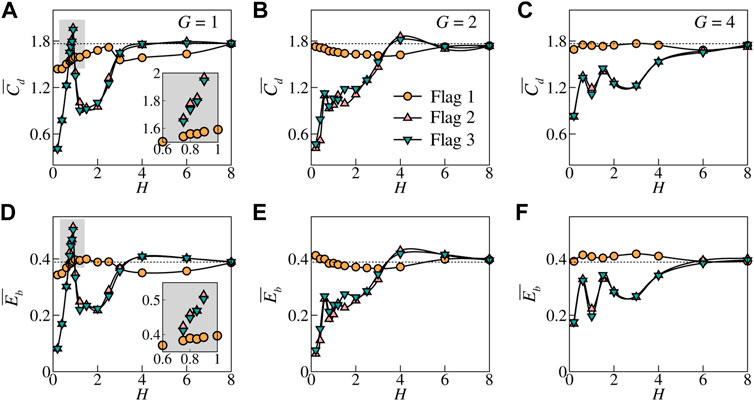
FIGURE 8. Drag coefficient
It is worthy noting that by interacting with the vortical wake shedding from the front flag, the bending energy achieved by the rear flags are much less than that of isolated flag for the cases with H < 4 except for H ∈ (0.7, 1) (see Inset in Figure 8D). For the cases with G = 1 and 0.7 < H < 1, the average bending energy of the rear flags is enhanced greatly (up to
To further explore the underlying mechanisms of the bending energy enhancement of the flags in HER, Figure 9 shows the unsteady behaviors for the case with G = 1, H = 0.9, where the most enhancement for the rear flags is achieved. Figures 9A,B,C shows the time variations of φ, Cd and Eb for each flag, respectively. It is seen that although the amplitudes of φ are almost identical for the front and rear flags (see Figure 9A), the mean values and amplitude of Cd and Eb of the rear flags are much larger than those of the front one, respectively (see Figures 9B,C). It is noted that the peaks in the Cd and Eb curves are mostly occur at the same time for the rear flags, respectively, due to the in-phase flapping.
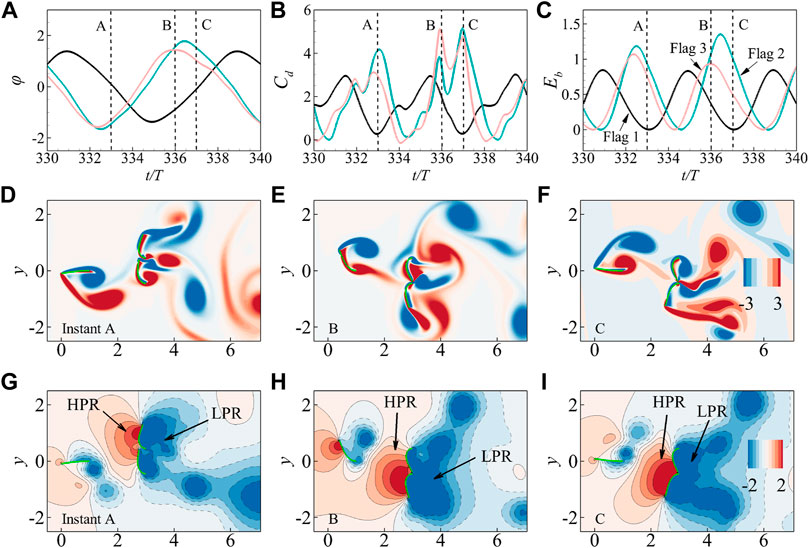
FIGURE 9. The angle ϕ (A), instantaneous drag coefficient Cd (B) and bending energy Eb (C) for the case with H =0.9 and G =1 in harvest enhancement region (HER), with the instantaneous vorticity (D,E,F) and pressure (G,H,I) contours for the typical instant A (D,G), B (E,H) and C (F,I), which are marked by the dashed lines in (A,B,C). It is seen that the higher pressure region (HPR) and the lower pressure region (LPR) are marked by the arrows in (G,H,I).
Further, Figures 9D–L show the instantaneous vorticity and pressure contours for the typical instants, i.e., A, B, and C, which correspond to the peaks in drag curves. It is seen that the leading edges of rear flags almost reach their maximum transverse displacement at the instants (A, B, and C), leading to a larger windward area (nearly doubled) compared to that of the front flag. Thus, the lower pressure region (LPR) and higher pressure region (HPR) on the front and back sides of the rear flags are much enlarged and enhanced, as shown in Figures 9G–I. Also, we note that at the instant A, B and C, the gap between edges of rear flags are very small, and the flow across the gap is nearly obstructed for this case with H = 0.9; This flow blocking effect is greatly beneficial to the enhancement of the LPR and HPR, and thus leads to a higher peak in the curves of Cd and Eb. Whereas, a larger H would lead to a wider gap between the rear flags and cause the transition from RC mode to IC mode, which may weaken the flow blocking effects; and a smaller gap of the rear flags would hinder the flapping of flags, resulting in the reduction of the flapping amplitude. This is reason why the bending energy enhancement appears merely at a narrow range of H ∈ (0.7, 1) (see insets in Figures 8A,D).
3.3 Three Inverted Flags in Right Triangle Configurations
In this section, an additional inverted flag is placed in the wake of the front side-by-side flags to investigate the effect of flow-mediated interaction among flags on the hydrodynamic performance of the system. Here, we denote this type of the arrangements as “right triangle configurations”, which is illustrated in Figure 1C. The gaps, G and H, are variable, and the other parameters are fixed and consistent with those in Sec. B. Based on the results from our simulations, the RC, IC and DC modes can also be identified in the G − H phase plane.
Figure 10A shows the time-variations of φ for each flag in the case with H = 0.2 and G = 1, corresponding to the RC mode. Similar to the side-by-side configurations, the two front flags behaves like a single one flapping in the flow due to the narrow lateral spacing (H = 0.2). It is noted that the flapping amplitude is suppressed when the rear flag is located in the vortical wake of the front flags. Further, it can be seen in Figures 10C,D that the front side-by-side flags flap approximately in-phase, whereas the front-rear flags flap approximately out-of-phase.
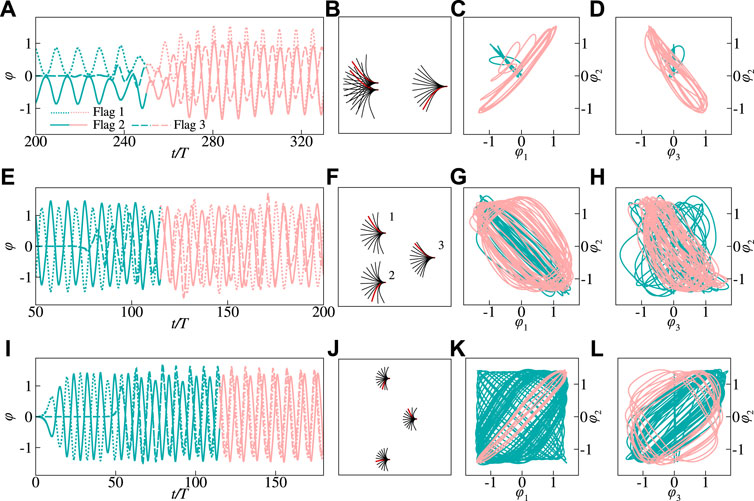
FIGURE 10. Time history of the instantaneous flapping angle ϕ (A,E,I), the superimposed views of the flags (B,F,J), and the phase trajectories in ϕ1− ϕ2 plane (C,G,K) and ϕ3− ϕ2 (d, h, l) plane for distinct modes in right triangle configurations, i.e., the regular-coupled (RC) mode with G =1, H =0.2 (A,B,C,D), the irregular-coupled (IC) mode with G =1, H =2 (E,F,G,H) and decoupled (DC) mode with G =1, H =6 (I, J, K, L). The other governing parameters are as follows: Re =200, M =2.9, K =0.3 and S =1,000. Flag 1 and 2 represent the front upper and lower flags, respecitvely; Flag 3 represents the rear flag. The red beams in the second column figures represent the instantaneous position of the flags at a certain instant. The phase diagrams have been colored to represent time, with the curve being initially green and shifting to red as time advances.
When H increases larger, e.g., the case with H = 2 and G = 1 as shown in Figures 10E–H, the front flags switch from in-phase flapping (see Figures 10A–C) to a quasi out-of-phase flapping; Meanwhile, due to the strongly wake-plate coupling effects, the rear flag flaps in an irregularly varying phase with respect to the front flags (Figures 10E,H). Further, for the case with a sufficiently large spacing (see Figures 10I–L), there seems no strong correlation between the flags’ motions for a long period from the initial. This observation is similar to the DC mode in the left triangle configurations (see Figures 6K,L).
We note that compared to the isolated flag, the flapping motion of the rear flag may be suppressed in the vortical wake of front abreast flags (see Figure 10B,J), This may lead to smaller windward area of rear flag, and reduce its fluid drag and bending energy harvesting from the surrounding fluid.
Figure 11 shows the phase diagram for the three typical patterns in the G − H plane. Each symbol in the phase diagram represents one case we simulated. It is illustrated clearly that the RC, IC and DC modes occur in succession as the increase of H for a certain G; And as one can see, the IC mode region undergoes gradual expansions as the increase of G. Further, it is worth noting that, unlike the left triangle configurations (see Figure 7), the harvest enhancement region (HER), in which the overall bending energy harvesting is enhanced due to the favorable flow interactions, is not observed in the G − H plane.
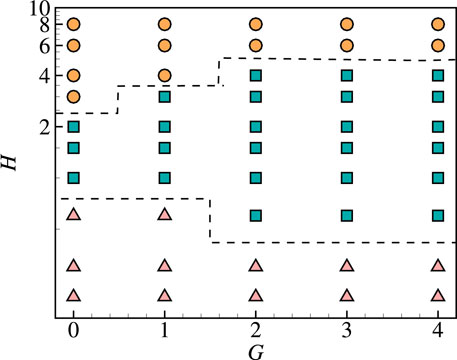
FIGURE 11. Overview of the typical mode regions on the G-H plane for the three flags in right triangle configurations. The symbols △, □ and ○ denote the regular-coupled (RC), irregular-coupled (IC) and decoupled (DC) modes, respectively. The other governing parameters are as follows: Re =200, M =2.9, K =0.3 and S =1,000.
Figure 12 shows the variations of
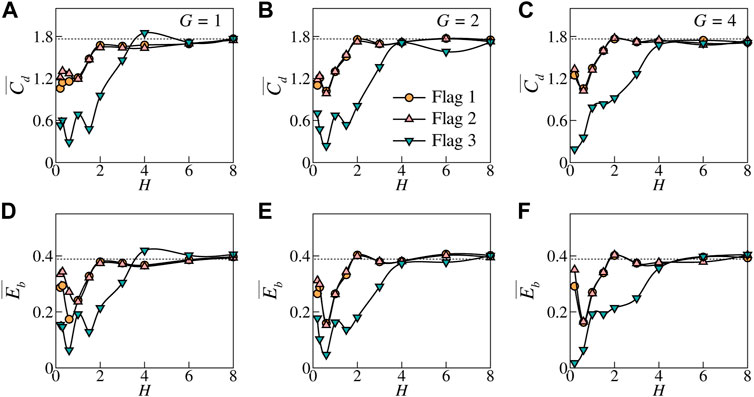
FIGURE 12. The mean drag coefficient
Figure 13 shows the unsteady dynamics of the system for two typical cases with G = 1, H = 0.2 and 2, respectively. From the time variations of flags’ Cd and Eb for the two cases (see Figures 13A,D,G), it is clearly seen that the peaks in the Cd- or Eb-curves of rear flag are much lower than those of the front flags, which results in the obvious reductions in mean fluid drag and the bending energy achieved by the rear flag (see Figure 12). To explore the underlying mechanism for the hydrodynamic performance, the instantaneous vorticity (Figures 13B,E,H) and pressure contours (Figure 13C,F,L) are examined at the typical instants (A, B and C) where the peaks in Cd-curves are observed for the rear flag. Results indicate that when the local maximum Cd are achieved for the rear flag, the vortices shedding from the front flags move just to the vicinity of the leading edge of rear flag for both cases with H = 0.2 and 2, e.g., V1 and V2 at instant A (Figure 13B), V3 at instant B (Figure 13E) or V4 at instant C (Figure 13H). These vortices may induce lower pressure regions (LPRs) between the rear and front flags, and weaken and compress the higher pressure regions (HPRs) on the windward surface of the rear flag. From Figure 13C,F,I, the intensity and area of HPRs on the surfaces of rear flags are greatly reduced compared to those of the front flags. This vortex-flag interaction causes a massive reduction in pressure difference across the rear flag and thus leads to a lower peak of Cd-curves (Figures 13A,G). Also, a lower pressure difference is not conducive to increasing the flapping amplitude, and thus causes a reduction in the bending energy harvesting (Figure 13D).
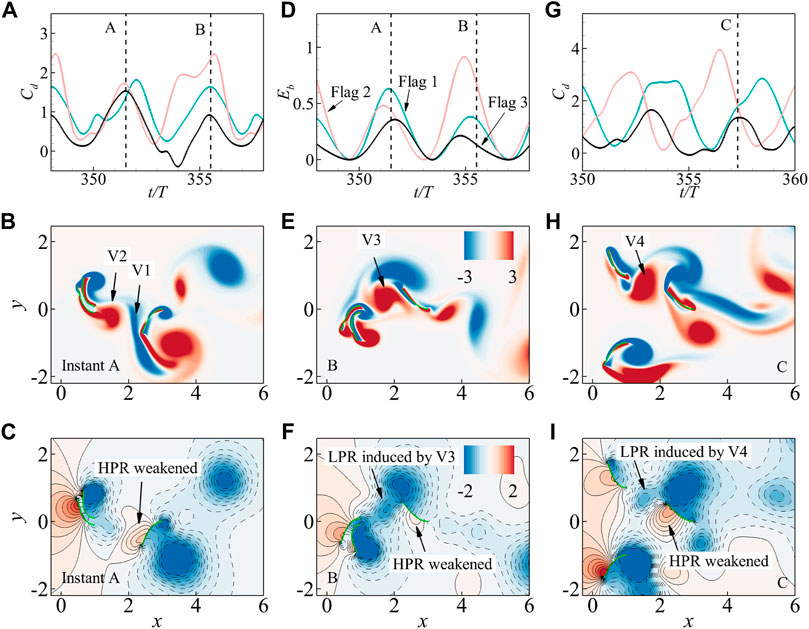
FIGURE 13. The unsteady dynamics of the system for the typical cases with G =1, H =0.2 (A–F) and 2 (G–I). For case with G =1 and H =0.2, the instantaneous drag coefficient Cd (A) and the bending energy Eb (D) as a function of time for each flag are provided; Also, the instantaneous vorticity (B,E) and pressure (C,F) contours at the typical instant A (B,C) and B (E,F) are plotted. For case with G =1 and G =2, the time-variation of Cd for each flag (G), and the instantaneous vorticity (H) and pressure (I) contours at the typical instant C are provided.
4 Conclusion
In summary, we carried out a numerical investigation on the dynamics of fluid flow past inverted flexible flags by an immersed boundary-lattice Boltzmann method for the fluid flow and a finite element method for the flag motion. For the inverted flags, their ends are fixed with their heads freely flapping. Large flapping amplitude as well as large drag force is preferred to achieve more bending energy. To explore the hydrodynamic performance of the flags in various arrangements, the flags are arranged in side-by-side, left triangular, and right triangular configurations, which can be obtained by varying H and G.
For the side-by-side configurations, three typical modes are identified, i.e., in-phase (IP), quasi out-of-phase (QOP) and out-of-phase (OP) modes, which correspond to 2P, irregular and 4(P + S) wake patterns, respectively. Further, an additional inverted flag is placed in front or rear of the side-by-side flags to explore possible favorable arrangements for bending energy enhancement. Based on our numerical results, three typical modes can be identified for both left and right triangular configurations, i.e., the regular-coupled (RC), irregular-coupled (IC) and decoupled (DC) modes, respectively; meanwhile, the phase diagrams for the typical modes in the G − H planes are provided. It is found that the RC, IC and DC modes mainly occur in the regions with lower, moderate and larger lateral spacings (H), respectively.
For left triangular configurations, it is found that the overall system may experience significant enhancement of bending energy in some favorable configurations, which are marked in harvest enhancement region (HER) in the G − H phase plane. For the case in HER, with respect to those of isolated one, the
Our results suggest that more bending energy can be generated when coupled inverted flags are arranged properly; whereas, it is also indicated that the favorable flow-mediated interaction is closely related and highly sensitive to the geometric parameters of arrangements (e.g., G and H), indicating that the parametric studies for different arrangements are essential for seeking optimal configurations. An appealing extension of the present findings would be the consideration of larger groups with more complex arrangements and three-dimensional flows, so as to approach practical applications. The present study may shed some light on understanding the hydrodynamic performances of multi-flag systems, and provide a guide for design of energy harvesting device using inverted flags.
Data Availability Statement
The original contributions presented in the study are included in the article/Supplementary Material, further inquiries can be directed to the corresponding author.
Author Contributions
KZ: conducted the numerical simulations, performed the data analyses and visualization, wrote the first draft of the manuscript. Z-RP: designed the study, interpreted results and revised the manuscript. BC, HD, YX, and LW contributed to manuscript revision, read, and approved the submitted version.
Funding
This work was supported by the National Natural Science Foundation of China (Grant no. 11902120).
Conflict of Interest
The authors declare that the research was conducted in the absence of any commercial or financial relationships that could be construed as a potential conflict of interest.
Publisher’s Note
All claims expressed in this article are solely those of the authors and do not necessarily represent those of their affiliated organizations, or those of the publisher, the editors and the reviewers. Any product that may be evaluated in this article, or claim that may be made by its manufacturer, is not guaranteed or endorsed by the publisher.
References
1. Shyy W, Kang C-K, Chirarattananon P, Ravi S, Liu H. Aerodynamics, Sensing and Control of Insect-Scale Flapping-wing Flight. Proc R Soc A (2016) 472:20150712. doi:10.1098/rspa.2015.0712
2. Pan Y, Dong H. Computational Analysis of Hydrodynamic Interactions in a High-Density Fish School. Phys Fluids (2020) 32:121901. doi:10.1063/5.0028682
3. Perktold K, Rappitsch G. Computer Simulation of Local Blood Flow and Vessel Mechanics in a Compliant Carotid Artery Bifurcation Model. J Biomech (1995) 28:845–56. doi:10.1016/0021-9290(95)95273-8
4. Li Z, Chen Y, Chang S, Luo H. A Reduced-Order Flow Model for Fluid-Structure Interaction Simulation of Vocal Fold Vibration. J Biomech Eng (2019) 142:021005. doi:10.1115/1.4044033
5. Dowell EH, Hall KC. Modeling of Fluid-Structure Interaction. Annu Rev Fluid Mech (2001) 33:445–90. doi:10.1146/annurev.fluid.33.1.445
6. Griffith BE, Patankar NA. Immersed Methods for Fluid-Structure Interaction. Annu Rev Fluid Mech (2020) 52:421–48. doi:10.1146/annurev-fluid-010719-060228
7. Paidoussis MP. Fluid-structure Interactions: Slender Structures and Axial Flow, Volume 1. New York: Elsevier Academic Press (2004).
8. Naudascher E, Rockwell D. Flow-induced Vibration: An Engineering Guide. New York: Dover Publications (2012).
9. Yu Y, Liu Y, Amandolese X. A Review on Fluid-Induced Flag Vibrations. Appl Mech Rev (2019) 71(1). doi:10.1115/1.4042446
10. Kim D, Cossé J, Huertas Cerdeira C, Gharib M. Flapping Dynamics of an Inverted Flag. J Fluid Mech (2013) 736:R1. doi:10.1017/jfm.2013.555
11. Park JW, Ryu J, Sung HJ. Effects of the Shape of an Inverted Flag on its Flapping Dynamics. Phys Fluids (2019) 31:021904.
12. Ait Abderrahmane H, Paidoussis MP, Fayed M, Ng HD. Flapping Dynamics of a Flexible Filament. Phys Rev E Stat Nonlin Soft Matter Phys (2011) 84:066604. doi:10.1103/PhysRevE.84.066604
13. Tian F-B, Luo H, Zhu L, Lu X-Y. Coupling Modes of Three Filaments in Side-By-Side Arrangement. Phys Fluids (2011) 23:111903. doi:10.1063/1.3659892
14. Huang L. Flutter of Cantilevered Plates in Axial Flow. J Fluids Structures (1995) 9:127–47. doi:10.1006/jfls.1995.1007
15. Watanabe Y, Suzuki S, Sugihara M, Sueoka Y. An Experimental Study of Paper Flutter. J Fluids Structures (2002) 16:529–42. doi:10.1006/jfls.2001.0435
16. Tang DM, Yamamoto H, H. Dowell E. Flutter and Limit Cycle Oscillations of Two-Dimensional Panels in Three-Dimensional Axial Flow. J Fluids Structures (2003) 17:225–42. doi:10.1016/s0889-9746(02)00121-4
17. Hua R-N, Zhu LD, Lu X-Y. Locomotion of a Flapping Flexible Plate. Phys Fluids (2013) 25:2979–87. doi:10.1063/1.4832857
18. Shelley MJ, Zhang J. Flapping and Bending Bodies Interacting with Fluid Flows. Annu Rev Fluid Mech (2011) 43:449–65. doi:10.1146/annurev-fluid-121108-145456
19. Peng Z-R, Sun Y, Yang D, Xiong Y, Wang L, Wang L. Scaling Laws for Drag-To-Thrust Transition and Propulsive Performance in Pitching Flexible Plates. J Fluid Mech (2022) 941:R2. doi:10.1017/jfm.2022.268
20. Orrego S, Shoele K, Ruas A, Doran K, Caggiano B, Mittal R, et al. Harvesting Ambient Wind Energy with an Inverted Piezoelectric Flag. Appl Energ (2017) 194:212–22. doi:10.1016/j.apenergy.2017.03.016
21. Chen Y, Ryu J, Liu Y, Sung HJ. Flapping Dynamics of Vertically Clamped Three-Dimensional Flexible Flags in a Poiseuille Flow. Phys Fluids (2020) 32:071905. doi:10.1063/5.0010835
22. Huang G, Xia Y, Dai Y, Yang C, Wu Y. Fluid-structure Interaction in Piezoelectric Energy Harvesting of a Membrane wing. Phys Fluids (2021) 33:063610. doi:10.1063/5.0054425
23. Schnipper T, Andersen A, Bohr T. Vortex Wakes of a Flapping Foil. J Fluid Mech (2009) 633:411–23. doi:10.1017/s0022112009007964
24. Shrestha B, Ahsan SN, Aureli M. Experimental Study of Oscillating Plates in Viscous Fluids: Qualitative and Quantitative Analysis of the Flow Physics and Hydrodynamic Forces. Phys Fluids (2018) 30:013102. doi:10.1063/1.5001330
25. Mandujano F, Málaga C. On the Forced Flow Around a Rigid Flapping Foil. Phys Fluids (2018) 30:061901. doi:10.1063/1.5026102
26. Connell BSH, Yue DKP. Flapping Dynamics of a Flag in a Uniform Stream. J Fluid Mech (2007) 581:33–67. doi:10.1017/s0022112007005307
27. Michelin S, Llewellyn Smith SG, Glover BJ. Vortex Shedding Model of a Flapping Flag. J Fluid Mech (2008) 617:1–10. doi:10.1017/s0022112008004321
28. Zhang J, Childress S, Libchaber A, Shelley M. Flexible Filaments in a Flowing Soap Film as a Model for One-Dimensional Flags in a Two-Dimensional Wind. Nature (2000) 408:835–9. doi:10.1038/35048530
29. Doaré O, Michelin S. Piezoelectric Coupling in Energy-Harvesting Fluttering Flexible Plates: Linear Stability Analysis and Conversion Efficiency. J Fluids Structures (2011) 27:1357–75. doi:10.1016/j.jfluidstructs.2011.04.008
30. Ryu J, Park SG, Kim B, Sung HJ. Flapping Dynamics of an Inverted Flag in a Uniform Flow. J Fluids Structures (2015) 57:159–69. doi:10.1016/j.jfluidstructs.2015.06.006
31. Sader JE, Cossé J, Kim D, Fan B, Gharib M. Large-amplitude Flapping of an Inverted Flag in a Uniform Steady Flow - a Vortex-Induced Vibration. J Fluid Mech (2016) 793:524–55. doi:10.1017/jfm.2016.139
32. Tavallaeinejad M, Salinas MF, Païdoussis MP, Legrand M, Kheiri M, Botez RM. Dynamics of Inverted Flags: Experiments and Comparison with Theory. J Fluids Structures (2021) 101:103199. doi:10.1016/j.jfluidstructs.2020.103199
33. Tang C, Liu N-S, Lu X-Y. Dynamics of an Inverted Flexible Plate in a Uniform Flow. Phys Fluids (2015) 27:073601. doi:10.1063/1.4923281
34. Wang L, Fang Z, Hua R-N, Peng Z-R. Numerical Simulations of an Inverted Flexible Plate in Linear Shear Flows. Phys Fluids (2020) 32:043104.
35. Lim SH, Park SG. Numerical Analysis of Energy Harvesting System Including an Inclined Inverted Flag. Phys Fluids (2022) 34:013601. doi:10.1063/5.0072204
36. Huertas-Cerdeira C, Goza A, Sader JE, Colonius T, Gharib M. Dynamics of an Inverted Cantilever Plate at Moderate Angle of Attack. J Fluid Mech (2021) 909:A20. doi:10.1017/jfm.2020.922
37. Huang H, Wei H, Lu X-Y. Coupling Performance of Tandem Flexible Inverted Flags in a Uniform Flow. J Fluid Mech (2018) 837:461–76. doi:10.1017/jfm.2017.875
38. Huertas-Cerdeira C, Fan B, Gharib M. Coupled Motion of Two Side-By-Side Inverted Flags. J Fluids Structures (2018) 76:527–35. doi:10.1016/j.jfluidstructs.2017.11.005
39. Ryu J, Park SG, Sung HJ. Flapping Dynamics of Inverted Flags in a Side-By-Side Arrangement. Int J Heat Fluid Flow (2018) 70:131–40. doi:10.1016/j.ijheatfluidflow.2018.02.009
40. Kim H, Kim D. Stability and Coupled Dynamics of Three-Dimensional Dual Inverted Flags. J Fluids Structures (2019) 84:18–35. doi:10.1016/j.jfluidstructs.2018.10.005
41. Jia K, Fang L, Huang W-X. Coupled States of Dual Side-By-Side Inverted Flags in a Uniform Flow. J Fluids Structures (2019) 91:102768. doi:10.1016/j.jfluidstructs.2019.102768
42. Hu Y-W, Feng L-H, Wang J-J. Passive Oscillations of Inverted Flags in a Uniform Flow. J Fluid Mech (2020) 884:A32. doi:10.1017/jfm.2019.937
43. Mazharmanesh S, Young J, Tian F-B, Lai JCS. Energy Harvesting of Two Inverted Piezoelectric Flags in Tandem, Side-By-Side and Staggered Arrangements. Int J Heat Fluid Flow (2020) 83:108589. doi:10.1016/j.ijheatfluidflow.2020.108589
44. Hu Y-W, Feng L-H, Wang J-J. Flow-structure Interactions of Multiple Inverted Flags in Different Arrangements. Exp Fluids (2021) 62:254.
45. Hu Y-W, Feng L-H, Wang J-J. Flow-structure Interactions of Two Tandem Inverted Flags in a Water Tunnel. Phys Fluids (2020) 32:087114. doi:10.1063/5.0012544
46. Shelley M, Vandenberghe N, Zhang J. Heavy Flags Undergo Spontaneous Oscillations in Flowing Water. Phys Rev Lett (2005) 94:094302. doi:10.1103/PhysRevLett.94.094302
47. Jia L-B, Li F, Yin X-Z, Yin X-Y. Coupling Modes between Two Flapping Filaments. J Fluid Mech (2007) 581:199–220. doi:10.1017/s0022112007005563
48. Schouveiler L, Eloy C. Coupled Flutter of Parallel Plates. Phys Fluids (2009) 21:081703. doi:10.1063/1.3204672
49. He X, Shan X, Doolen GD. Discrete Boltzmann Equation Model for Nonideal Gases. Phys Rev E (1998) 57:R13–R16. doi:10.1103/physreve.57.r13
50. Peskin CS. The Immersed Boundary Method. Acta Numerica (2002) 11:479–517. doi:10.1017/s0962492902000077
51. Ye H, Wei H, Huang H, Lu X-Y. Two Tandem Flexible Loops in a Viscous Flow. Phys Fluids (2017) 29:021902. doi:10.1063/1.4975592
52. Hua R-N, Zhu L, Lu X-Y. Dynamics of Fluid Flow over a Circular Flexible Plate. J Fluid Mech (2014) 759:56–72. doi:10.1017/jfm.2014.571
53. Peng Z-R, Huang H, Lu X-Y. Collective Locomotion of Two Closely Spaced Self-Propelled Flapping Plates. J Fluid Mech (2018) 849:1068–95. doi:10.1017/jfm.2018.447
54. Peng Z-R, Huang H, Lu X-Y. Collective Locomotion of Two Self-Propelled Flapping Plates with Different Propulsive Capacities. Phys Fluids (2018) 30:111901. doi:10.1063/1.5053662
Keywords: flow structure interactions, vortex interactions, drag reductions, immersed boundary method (IB method), lattice Boltzmann method (LBM), energy harvesting (EH)
Citation: Zou K, Peng Z-R, Chen B, Dai H, Xiong Y and Wang L (2022) Hydrodynamic Coupling of Inverted Flags in Side-by-Side, Left Triangular and Right Triangular Configurations in a Uniform Flow. Front. Phys. 10:936268. doi: 10.3389/fphy.2022.936268
Received: 05 May 2022; Accepted: 13 May 2022;
Published: 01 June 2022.
Edited by:
Haibo HuangHaibo Huang, University of Science and Technology of China, ChinaReviewed by:
Fang-Bao Tian, University of New South Wales Canberra, AustraliaChengyao Zhang, Southern University of Science and Technology, China
Copyright © 2022 Zou, Peng, Chen, Dai, Xiong and Wang. This is an open-access article distributed under the terms of the Creative Commons Attribution License (CC BY). The use, distribution or reproduction in other forums is permitted, provided the original author(s) and the copyright owner(s) are credited and that the original publication in this journal is cited, in accordance with accepted academic practice. No use, distribution or reproduction is permitted which does not comply with these terms.
*Correspondence: Ze-Rui Peng, emVydWlwZW5nQGh1c3QuZWR1LmNu