- 1School of Cyberspace, Hangzhou Dianzi University, Hangzhou, China
- 2ZhuoYue Honors College, Hangzhou Dianzi University, Hangzhou, China
The diffusion of negative information, such as rumours, misinformation and computer viruses on Online Social Networks (OSNs), may lead to serious losses and consequences. And there are always some rational malicious spreaders, who strategically spread negative information. Therefore, how to control the information diffusion of the malicious spreader is a great challenge. In recent years, some studies have analyzed the controlling problem which belongs to the issue of influence blocking maximization (IBM) from the perspective of the large-scale strategy set on the game theory. However, the aforementioned methods cannot timely solve the controlling diffusion problem on high-speed OSNs. In this study, we achieve the purpose of effectively controlling diffusion on OSNs by blocking information under typical strategies. Based on the existing two-player Stackelberg zero-sum game model and evaluation methods of node’s importance on the network, we analyze the typical strategic dynamic game in which the blocker moves first and the spreader moves later on scale-free networks with different power exponent. Experimental results show that the absolute dominance strategy of the blocker is Leader Rank with 90.16% probability. And using Leader Rank can be relatively effective against malicious spreaders with 98.33% probability. When the power exponent of the network is smaller, it is more conducive to blocking information dissemination with fewer seed nodes.
Introduction
With the advent of social media platforms, such as Facebook, Twitter, Weibo, etc., any piece of information has the potential to spread to millions of people in a few minutes [15, 31]. The rapid spread of information over OSNs poses a problem: public opinion and misinformation may greatly affect different aspects of our lives, such as the economy, national defense, fashion, politics, and even personal affairs. For example, public opinion can damage the image of a candidate, potentially altering the outcome of an election [35]. During crisis situations (e.g., terrorist attacks, earthquakes, etc.), misinformation can cause wide spread panic and general chaos [1]. Information diffusion on OSNs is achieved via diverse types of users, which typically have various motives, some unwittingly, however, some with particular motives. Since any potentially malicious influence upon the opinion distribution in a society is undesirable, it is important to design methods to prevent external attacks upon it. In order to counter the rational malicious spreader efficiently, we need to deploy the information blocking strategy in advance and analyze the robustness of the OSNs against the malicious information diffusion.
Referring to previous work on controlling information diffusion which belongs to the influence blocking maximization (IBM) problem [2, 19, 24, 32, 37, 38, 40], we define our model as a two-party dynamic game. The purpose of the controlling information diffusion problem is to block the path of influence diffusion through a selected set of nodes or edges [12, 13, 21, 36, 39, 41]. Some studies [17, 29] have analyzed controlling diffusion problem from the perspective of large-scale strategy set using game theory, but the computational complexity of this method increases exponentially with the increase of network size. Jason Tsai et al. (2012) designed an algorithm called Double Oracle to solve the problem [29, 30], whose major advantage is the ability to divide the problem into best-response components. However, using this algorithm still requires the design of heuristic Oracle for both sides, and sophisticated heuristic Oracle is needed for less interconnected social networks. Now we propose a game-theoretic method to solve this controlling diffusion problem from another perspective. In real life, players do not necessarily use large-scale policy sets to find the best strategies. The calculation results of the above methods are the best, but the blocker and the spreader are more likely to use representative typical strategies to get effective results quickly [27, 34].
The meaning of a typical strategy is to select the most influential nodes to combine into a seed node set. So far, the academic community has proposed many typical methods for identifying high-impact nodes of influence in networks, including Degree Centrality (DC) [8], Betweenness Centrality (BC) [25], Closeness Centrality (CC) [28] and Eigenvector Centrality (EC) [20]. In addition, K-shell [14], H-index [10], Leader Rank [16], Semi-local Centrality (LC) [5] and Eccentricity Centrality (ECC) [26] are also commonly used methods. In this study, we establish a Stackelberg dynamic game model to solve the previous challenge [9, 18], based on the existing node influence evaluation methods. In our work the blocker is on the right side and the spreader is on the wrong side, so we focus on which typical strategies the blocker uses better. Our works and contributions can be summarized as:
• Firstly, we build a Stackelberg dynamic game model in which the blocker selects the seed nodes first. And we uses the maximum and minimum backward induction method to find the equilibrium path.
• Secondly, we select seven typical point selection strategies with low similarity, and the random (R) point selection strategy is added as the total research object.
• Finally, we conduct extensive experiments on scale-free network by changing the number of seed nodes on both parties and the power exponent of the network. We analyzed the absolute dominance strategy and the utility values at equilibrium under different conditions.
Online Information Diffuse Dynamic Game Model
We formulate the controlling diffusion problem as a Stackelberg zero-sum game, in which the players are one blocker and one spreader. The blocker chooses a subset of nodes to block, and then the spreader chooses some nodes to spread in the target network. Both players are assumed to have the complete information of the target network and the spreader have the full knowledge of the blocker. In other words, the spreader solves the influence maximization problem after observing a network modified by the blocker. For each seed node selected by the blocker, all edges of that node are broken off [13] and then the spreader selects its seed nodes on the new modified network.
Let G = (V, E) be an online social undirected graph. Each node v ∈ V represents an agent where V is the set of nodes in the network. An edge eij = (vi, vj) ∈ E denotes the friendship between vi and vj, while E ⊆ V × V is the set of edges. Suppose n = |V| be the number of nodes in the network. We denote
And then a spreader selects an initial set of seeds Vs to maximize the influence. The number of seed nodes selected by the blocker is
Strategy
For the blocker, a pure strategy B =< bv > is a selection of the seed nodes Vb = {v ∈ V|bv = 1}, that is, ∑v∈Vbv = Kb, where bv ∈ {0, 1}. bv = 1 indicates the node v is chosen by the blocker and will never take that view. The blocker’s strategy space is defined as
Utility
Now we define the utilities for both players in terms of the results of adversarial influence on the network. To formalize, we denote the utilities of the blocker and the spreader as
A key concept in this model is the influence maximization problem, the spreader’s problem. To make our problem more tractable, we transform the number of affected nodes resulting from a diffusion model into the cardinality of the dominated node set with respect to
where
Hence, the utility function of the spreader
and the blocker’s utility function
All together, we define them as (us, ub).
Equilibrium
After the utility matrix is obtained, we begin to solve this zero-sum game and find its equilibrium. The aim of the blocker is to control the spread of public opinion to maximize his minimum utility and minimum the spreader’s maximum utility. The optimization object is defined as follows:
In the paper, we use backward induction (BI) to solve this zero-sum game and find its equilibrium [4]. Every strategy of the blocker or the spreader is a BI choice, and hence all possible outcomes of the game are BI outcomes.
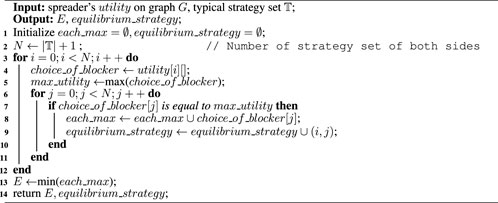
In the dynamic game, the blocker select seed nodes first while the strategy selection of the spreader in the later step must be taken into account. The spreader make a direct choice of strategy without constraint. When the seed node selection strategy of the spreader in the later stage is determined, the seed node selection strategy of the blocking party in the previous step can be easily determined. We give the algorithm to solve the equilibrium path and the equilibrium utility value of our dynamic game model by backward induction. It is sketched in Algorithm 1.
Algorithm 1. The algorithm of backward induction to find the equilibrium path.
In the Algorithm 1, Line4-Line5 gets the maximum spreader utility of blocker under each defined strategy. And then Line7-Line9 records the best response and maximum utility of spreader under each blocker’s strategy. Line13 gets the minimum utility from the spreader’s best response, i.e., the equilibrium utility E. All blocker and spreader’s antagonistic strategy pairs equal to this utility are equalization strategies.
An example is given in Figure 1 to demonstrate the process of solving dynamic equilibrium, in which the size of the strategy set for both players N is only three. Firstly, each backward induction tree is obtained under the premise of the same network and fixed number of seed nodes Kb, Ks. Since we are a zero-sum game, blocker’s utility ub is the maximum when spreader’s utility us is the minimum. If the blocker chooses strategy 1, then the spreader chooses strategy 1, because (0.9, −0.9) > (0.8, −0.8) > (0.6, −0.6); If the blocking party chooses strategy 2, then the spreader chooses strategy 2, because (0.8, −0.8) > (0.7, −0.7) > (0.6, −0.6); If the blocker chooses strategy 3, then the spreader chooses strategy 3, because (0.7, −0.7) > (0.5, −0.5) > (0.4, −0.4). Then, among the choices of the spreader, the least choice for the blocker is strategy 3, because (0.7, −0.7) < (0.8, −0.8) < (0.9, 0.9). The equilibrium return is (0.7, −0.7), and the equilibrium path is blocker (strategy3) − spreader (strategy3).
In this case, only one equilibrium path exists, and the rest are disequilibrium paths. However, when the strategy set increases, there may be multiple equilibrium paths, that is, there are multiple equilibrium solutions.
Typical Node Selection Strategies
Now let’s talk about typical node selection strategies. We first explain the process of calculating the utility matrix, and then introduce seven node influence evaluation methods used in our model. Note that these are measures for node influence, not strategies. Strategies are chosen according to a specific measure.
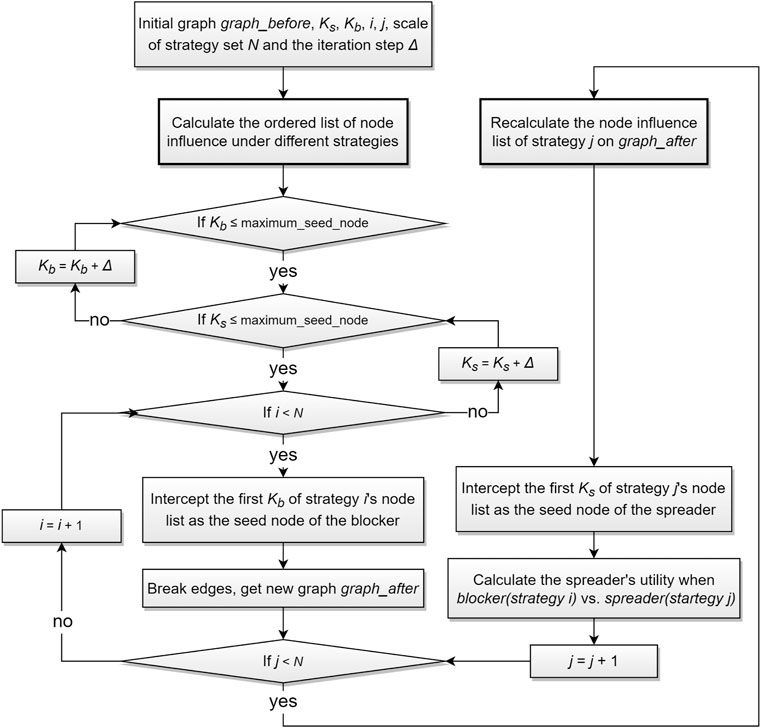
The algorithm process of calculating the utility matrix in our model is shown in Figure 2. In the calculation process, we redefine i and j as index variables, and define Δ as the iteration step of the number of seed nodes. Specifically, in the following experiment we initialize Δ = 50, Kb = Ks = 50, i = j = 0, N = 8 and n = 1000. According to the definition of Kb and Ks in Typical Node Selection Strategies, we know that maximum_seed_node is equal to
The content of the two parts in bold and black boxes in Figure 2 is to rank the influence of all nodes in the network by using different evaluation methods of node influence. By comparing the similarity of node influence rankings obtained by different influence evaluation methods, we select the following seven typical methods as typical strategies
Closeness Centrality
Closeness Centrality (CC) depends on the average distance between each node and every other node in the network [28]. We can use the following formula to represent the node’s Closeness Centrality Ccc:
where d (vi, vj) represents the shortest distance of node vi and vj. The larger Ccc (vi) is, the more influence this node vi has.
H-Index
The H-index [10] of the node vi can be determined as follows: Step1. Sort all of its neighbor nodes N(vi) by degree from highest to lowest; Step2. Find the sorted list from front to back until the sequence number of a node is greater than the degree of itself. And the sequence number minus 1 is Ch−index (vi). The larger Ch−index (vi) is, the more influence this node vi has.
K-Shell
Nodes are assigned to k shells according to their remaining degree, which is obtained by successive pruning of nodes with degree smaller than the Ck−shell value of the current layer [14]. Start by removing all nodes with degree k = 1. After removing all the nodes with k = 1, some nodes may be left with one link, so we continue pruning the system iteratively until there is no node left with k = 1 in the network. The removed nodes, along with the corresponding links, form a k shell with index Ck−shell = 1. Similarly, iteratively remove the next k shell, Ck−shell = 2, and continue removing higher k shells until all nodes are removed. The higher the Ck−shell value of a node, the greater its influence will be.
Eigenvector Centrality
Eigenvector Centrality (EC) measures the importance of a node by the importance of its neighbors [20]. Let
where c is a proportionality constant. The larger Cec(vi) is, the more influence this node vi has.
Leader Rank
The Leader Rank (LR) algorithm adds a node g to the network and connects it with all nodes in the network, thus obtaining a new network with n + 1 nodes which is strongly connected [16]. The process is iterated continuously according to the following formula until a stable state is reached:
where kj represents the degree of node j and aij/kj representing the probability that a random walker at vi goes to vj in the next step. In the initial state, l (0) = 1 for all nodes except l (0) = 0 for g. In steady state, the resource value of node g is evenly distributed to other n nodes. Thus we define the final score Clr of a node as follows:
where lg (tc) is the score of the ground node at steady state and tc represents the number of iterations when convergence is reached. The higher the leadership score of a node, the greater the influence of this node.
Semi-local Centrality
Semi-local C entrality (LC) involves the fourth-order neighbor information of a node [5]. The Semi-local Centrality Clc of node vi is defined as follows:
where D (vw) is the second-order neighbor degree of node vw, that is, the number of neighbors of nodes vw within two units distance. The larger Clc(vi) is, the more influence this node vi has.
Eccentricity Centrality
The Eccentricity Centrality (ECC) Cecc of node vi is expressed as [26].
The smaller the value of Cecc (vi), the greater the influence of node vi.
Experimental Results and Analysis
Based on the above model definition, we conduct experiments on different networks with different initial numbers of seed nodes Kb, Ks. The complex networks that exist in real life are currently more often abstracted by scale-free network models, and many practical scale-free networks have a power exponent γ of degree distribution distributed between two and 3 [6, 33]. A power-law distribution of node degrees indicates that the network contains a few nodes that have a very high degree and many with low degree. Specially, the power exponents of social networks are mostly distributed between 2 and 2.5, such as the WWW network with γwww = 2.1, actor collaboration network with γactor = 2.3 [33]. In addition, the power exponent of the classical BA scale-free network model is γba = 3.0 [3]. Therefore, it is more suitable to use the degree heterogeneity scale-free network with different power exponents γ.
Now, we define the power exponents γ of the networks used in our experiments as 2.0, 2.1, 2.2, 2.3, 2.4, 2.5 respectively, and the number of nodes n of the networks as 1000. We use the following two steps to generate degree heterogeneous networks with different power-law distributions: Step1. Generate a power-law distribution of node degree sequences with given node number n and power-law exponent γ; Step2. Generate a random network that matches the node degree sequences as closely as possible [7, 23]. Then, we simulate the Stackelberg game based on the spreading and blocking strategies on each network, and the equilibrium utility value and all equilibrium strategies are solved by backward induction. We iterated the number of seed nodes on both players 50 → 500 in steps of 50. For example, we use Kb: Ks to indicate that the blocker chooses Kb seed nodes and the spreader chooses Ks seed nodes.
Absolute Dominance Strategy for The Blocker at Equilibrium
After experimentation, we obtained the equilibrium strategies for both players in different cases, as shown in Figure 3. In which, the combinations of strategy adversaries with the same blocker strategy we mark with the same colour. It can be found that the absolute dominant strategy of the blocker is mostly LR for different networks and different number of seed nodes. Also, when
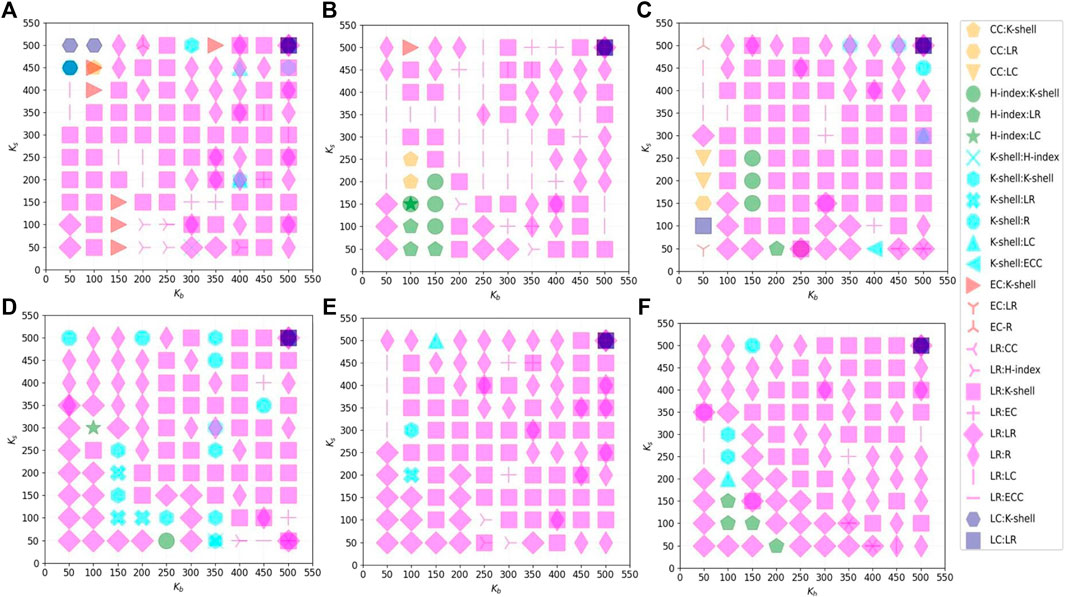
FIGURE 3. The adversarial strategy pair at dynamic equilibrium obtained by backward induction solving. Where the horizontal axis denotes the number of seed nodes Kb for the blocker and the vertical axis denotes the number of seed node Ks for the spreader. Each subplot shows the experimental results on the same scale-free network. (A) Power exponent γ = 2.0; (B) power exponent γ = 2.1; (C) power exponent γ = 2.2; (D) power exponent γ = 2.3; (E) power exponent γ = 2.4; (F) power exponent γ = 2.5.
For the cases when the blocker doesn’t choose Leader Rank as his point selection strategy, we analyse them below. The total number of cases where the blocker doesn’t choose LR at equilibrium is 59, representing 9.83% of the total. By analysing the equilibrium utility values in these cases and the max _utility (Algorithm 1) under the branch of the decision tree where the blocker chooses the Leader Rank, we can find that their difference is only 0.067 at the maximum and 83.05% of these 59 cases’ difference is within the range [0.001, 0.020], as shown in Figure 4. Therefore, in these cases, the blocker can also obtain a desired blocking effect by adopting Leader Rank.

FIGURE 4. The difference between the maximum utility value and the equilibrium utility value under the branch of the Leader Rank decision tree for the 59 cases where the blocker doesn’t choose the Leader Rank strategy.
In conclusion, in the cases of different networks and seed resources, the dominant strategy of the blocker in blocking the dissemination of adverse information is LR (Leader Rank). The probability that LR (Leader Rank) is the optimal strategy is 90.16%, and the probability of blocking adverse information effectively using LR (Leader Rank) is 98.33%.
Analysing the process of evaluating the influence of nodes using the Leader Rank algorithm, we can see that it is actually quite similar to the process that public opinion spreads through online social networks. In the design thinking of the Leader Rank algorithm, not only the transmission of information from high-influence nodes to low-influence nodes is considered, but also the opposite flow of information [16]. Meanwhile, the design of Leader Rank is based on the overall network topology, while the other six typical point selection strategies are evaluated based only on the shortest path or number of neighbours. Most typically, both CC (Closeness Centrality) and ECC (Eccentricity Centrality) only consider the shortest distance between nodes and do not consider the number of neighbours of different orders of nodes. The Closeness Centrality algorithm is designed based on the average shortest path of the nodes [28], while the Eccentricity Centrality algorithm is designed based on the longest shortest path of the nodes [26]. The former is more comprehensive in extracting information about the network topology than the latter, which may also be the reason why ECC has never been chosen by blockers as the absolute dominant strategy as shown in Figure 3.
Effect of Different Parameters on Equilibrium Utility Value
We draw the contour diagrams according to equilibrium utility values E. By analysing Figure 5, we can see that the equilibrium utility value is significantly influenced by Ks. The equilibrium utility value increases significantly as Ks increases, with the maximum variation spanning around the range [0.4, 0.5], while the maximum variation span of the equilibrium utility value due to Kb changes is only around the range [0.2, 0.4]. However, when the value of Ks is not very large, the blocker can still control the value of the spreader’s utility at equilibrium to
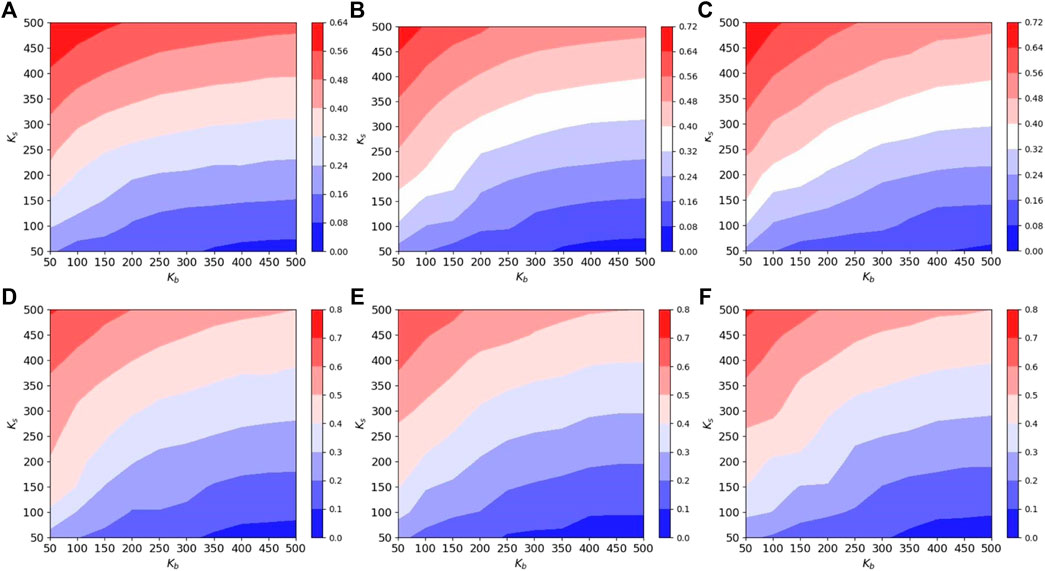
FIGURE 5. Contour plots of equilibrium utility values with the number of blocker’s and spreader’s seed nodes Kb, Ks on degree heterogeneous networks with different power exponents. (A) Power exponent γ = 2.0; (B) power exponent γ = 2.1; (C) power exponent γ = 2.2; (D) power exponent γ = 2.3; (E) power exponent γ = 2.4; (F) power exponent γ = 2.5.
We plot line graphs of the change in equilibrium utility values for networks with different power exponents Figure 6. It can be found that the size of the power exponent γ of the network has a relatively large effect on the equilibrium utility value when the number of seed node resources Kb of the blocker is small. And when the number of seed node resources Kb of the blocker is larger, the size of the power exponent γ of the network has almost no effect on the equilibrium utility value.
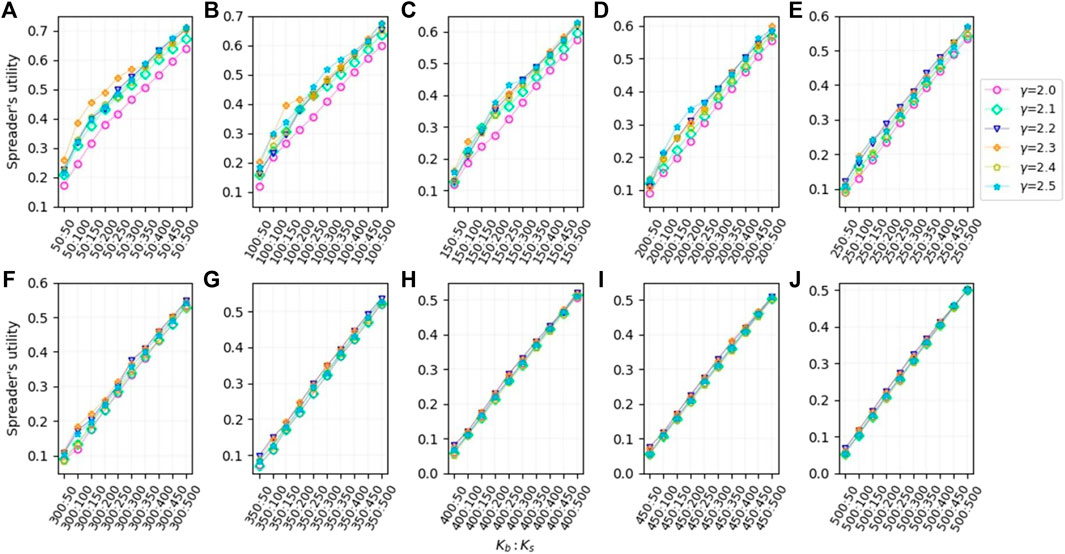
FIGURE 6. Plot of the growth of equilibrium gain values for different numbers of blocker’s seed nodes Kb on scale-free networks with different power exponents γ as the number of spreader’s seed nodes Ks increases. (A) Kb = 50; (B) Kb = 100; (C) Kb = 150; (D) Kb = 200; (E) Kb = 250; (F) Kb = 300; (G) Kb = 350; (H) Kb = 400; (I) Kb = 450; (J) Kb = 500.
Simulation of Adversarial Dissemination on Real Networks
To verify the correctness and effectiveness of the blocker’s choice of Leader Rank strategy to block the spread of public opinion, we conducted the dynamic game on a real online social network (Facebook [22]). The statistics of the online social network are shown in Figure 7.
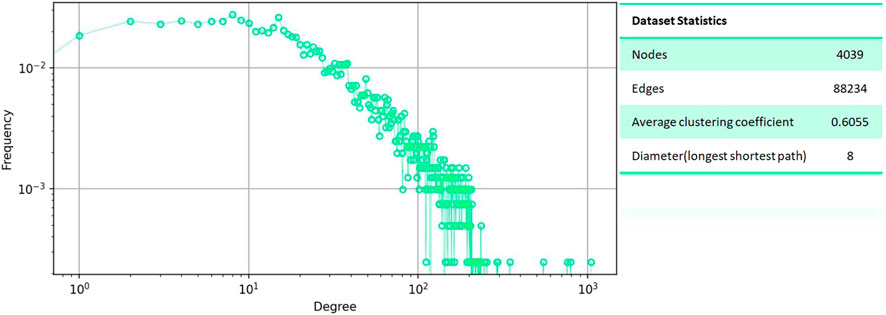
FIGURE 7. Main statistical properties of the Facebook online social network. The URL to obtain this network data is http://snap.stanford.edu/data/ego-Facebook.html.
We iterate the number of seed nodes of the blocker 50 → 2019 in steps of 50. Consider the imbalance in the impact of the number of seed nodes on the equilibrium utility value for both spreader and blocker observed in Figure 5, we iterate the number of seed nodes of the spreader 50 → 2019 in steps of 50. Based on the analysis in Simulation of Adversarial Dissemination on Real Networks, we removed the point selection strategy based on the ECC method from both sides of the strategy set.
Through experiments, we obtain the absolute dominant strategy pair at equilibrium as shown in Figure 8. In which the blocker has 86.88% probability of choosing the Leader Rank strategy and sometimes also chooses the Closeness Centrality strategy when Kb is small, with 13.12%. We analyse the cases where the blocker doesn’t choose the Leader Rank strategy in Table 1. It can be found that the maximum utility values under the LR branch are still mostly not very different from the equilibrium utility values, and the difference is within [0.001, 0.020] in 14 cases out of 21 cases, i.e. the effect of using Leader Rank to select seed nodes for blocking is also possible in these conditions. Thus, overall, there is a 95.63% probability that the blocker will achieve good blocking results on the real network by choosing the Leader Rank strategy.

FIGURE 8. The adversarial strategy pair at dynamic equilibrium obtained by backward induction solving on real online social network from Facebook. Where the horizontal axis denotes the number of seed nodes Kb for the blocker and the vertical axis denotes the number of seed node Ks for the spreader.

TABLE 1. The equilibrium utility value when the blocker doesn’t selected Leader Rank and the maximum spreader’s utility value under the blocker’s Leader Rank branch in the decision tree. And their differences.
Observe and analyse the equilibrium utility values for both players with different numbers of seed nodes, as shown in Figure 9. We can find that as the number of spreader’s seed nodes grows, the increment of blocker’s seed nodes is much larger than the increment of spreader’s if we want to achieve the same equilibrium utility value.

FIGURE 9. Contour plots of equilibrium utility values with the number of blocker’s and spreader’s seed nodes Kb, Ks on real online social network from Facebook.
Discussion
We focus on the hot issue of controlling information diffusion on OSNs and analyze several typical selection strategies by establishing a dynamic game model. Firstly, we select seven typical point selection methods as the typical strategy set. Then we carry out dynamic game experiments on scale-free networks with different power exponent. We use the backward induction tree to analyze the equilibrium utility value and the absolute dominance strategy of the blocker. Through our experiments, we found that the absolute dominance strategy for the blocker is Leader Rank with 90.16% probability and using Leader Rank can be relatively effective against malicious spreaders with 98.33% probability. At the same time, since the equilibrium utility value is much more sensitive to the number of seed nodes of the malicious spreader than that of the blocker, opinion control can be performed by typical strategy only when there are fewer malicious spreaders. In addition, when the number of seed node resources of the blocking party is small, the network with a smaller power exponent of the degree distribution will facilitate the blocking of dissemination.
Note that our experiment assumes that both players know all the information of the target network, and the spreader can get the defensive node deployment information of the blocker. However, in the real-life setting, malicious spreaders on the network may not be able to obtain complete information about the target network and defensive deployment. This assumption may be a limitation in the model we have developed, but the blocker should be more effective in blocking public opinion in situations where the spreader does not have access to defensive and network information.
Data Availability Statement
The raw data supporting the conclusion of this article will be made available by the authors, without undue reservation.
Author Contributions
YL was responsible for all aspects of the work. RZ contributed to the analysis of the dynamic game of typical strategies and the simulations in Results. ZW provided the ideas for the analysis of the dynamic game of typical strategies. LC and LH contributed to the analysis of simulations in Results.
Funding
This research was supported by the National Natural Science Foundation of China (grant no. 62176080).
Conflict of Interest
The authors declare that the research was conducted in the absence of any commercial or financial relationships that could be construed as a potential conflict of interest.
Publisher’s Note
All claims expressed in this article are solely those of the authors and do not necessarily represent those of their affiliated organizations, or those of the publisher, the editors and the reviewers. Any product that may be evaluated in this article, or claim that may be made by its manufacturer, is not guaranteed or endorsed by the publisher.
Supplementary Material
The Supplementary Material for this article can be found online at: https://www.frontiersin.org/articles/10.3389/fphy.2022.934741/full#supplementary-material
References
1. Al-khateeb S, Agarwal N. Examining botnet behaviors for propaganda dissemination: A case study of isil’s beheading videos-based propaganda. In IEEE International Conference on Data Mining Workshop (ICDMW) (2015). p. 51. doi:10.1109/ICDMW.2015.41
2. Amelkin V, Singh AK. Fighting opinion control in social networks via link recommendation. In: Proceedings of the 25th ACM SIGKDD international conference on knowledge discovery & data mining. Anchorage, AK: KDD ’19 (2019). p. 677–85. doi:10.1145/3292500.3330960
3. Barabasi AL, Albert R. Albert, r.: Emergence of scaling in random networks. science (1999) 286:509–12. doi:10.1126/science.286.5439.509
4. Bonanno G. Behavior and deliberation in perfect-information games: Nash equilibrium and backward induction. Int J Game Theor (2018) 47:1001–32. doi:10.1007/s00182-017-0595-5
5. Chen D, Lü L, Shang M-S, Zhang Y-C, Zhou T. Identifying influential nodes in complex networks. Physica A: Stat Mech its Appl (2012) 391:1777–87. doi:10.1016/j.physa.2011.09.017
6. Faloutsos M, Faloutsos P, Faloutsos C. On power-law relationships of the internet topology. Poceedings of Acm Sigcomm (1999) 29:251–62. doi:10.1145/316188.316229
7. Fan C, Lu L. Connected components in random graphs with given expected degree sequences. Ann Combinatorics (2002) 6:125–45. doi:10.1007/pl00012580
8. Freeman LC. Centrality in social networks conceptual clarification. Social Networks (1978) 1:215–39. doi:10.1016/0378-8733(78)90021-7
9. Hajaj C, Yu S, Joveski Z, Vorobeychik Y. Adversarial coordination on social networks (2018). doi:10.48550/ARXIV.1808.01173
10. Hirsch J. An index to quantify an individual’s scientific research output that takes into account the effect of multiple coauthorship. Scientometrics (2010) 85:741–54. doi:10.1007/s11192-010-0193-9
11. Jia F, Zhou K, Kamhoua C, Vorobeychik Y. Blocking adversarial influence in social networks (2020). doi:10.48550/ARXIV.2011.01346
12. Kimura M, Saito K, Motoda H. Minimizing the spread of contamination by blocking links in a network. In: National conference on artificial intelligence (2008).
13. Kimura M, Saito K, Motoda H. Blocking links to minimize contamination spread in a social network. ACM Trans Knowl Discov Data (2009) 3:1–23. doi:10.1145/1514888.1514892
14. Kitsak M, Gallos LK, Havlin S, Liljeros F, Muchnik L, Stanley HE, et al. Identification of influential spreaders in complex networks. Nat Phys (2010) 6:888–93. doi:10.1038/nphys1746
15. Kumar S, Shah N. False information on web and social media. A Surv (2018). doi:10.48550/ARXIV.1804.08559
16. Lü L, Zhang YC, Yeung CH, Zhou T. Leaders in social networks, the delicious case. Plos One (2011) 6:e21202. doi:10.1371/journal.pone.0021202
17. Li Y, Xiao Y, Li Y, Wu J. Which targets to protect in critical infrastructures - a game-theoretic solution from a network science perspective. IEEE Access (2018) 6:56214–21. doi:10.1109/ACCESS.2018.2872767
18. Li Y-P, Tan S-Y, Deng Y, Wu J. Attacker-defender game from a network science perspective, 28. Woodbury, N.Y: Chaos (2018). p. 051102. doi:10.1063/1.5029343
19. Ling CA, Yz A, Yc B, Bl A, Wei LA. Negative influence blocking maximization with uncertain sources under the independent cascade model. Inf Sci (2021) 564:343–67. doi:10.1016/j.ins.2021.02.063
20. Lloyd BP, Lloyd P. Eigenvector-like measures of centrality for asymmetric relations. Soc Networks (2001) 23:191–201. doi:10.1016/s0378-8733(01)00038-7
21. Mai VS, Abed EH. Optimizing leader influence in networks through selection of direct followers. IEEE Trans Automat Contr (2019) 64:1280–7. doi:10.1109/TAC.2018.2850287
22. Mcauley JJ, Leskovec J. Learning to discover social circles in ego networksIn: Neural Information Processing Systems. Red Hook, NY: Curran Associates Inc (2012).
23. Miller JC, Hagberg AA. Efficient generation of networks with given expected degrees. Algorithms and Models for the Web Graph (2011) 115–26. doi:10.1007/978-3-642-21286-4_10
24. Mirosław L, Henryk L, Puzniakowska–Galuch E. Elbieta, PDiffusive and anti-diffusive behavior for kinetic models of opinion dynamics. Symmetry (2019) 11:1024. doi:10.3390/sym11081024
25. Newman MEJ. A measure of betweenness centrality based on random walks. Soc Networks (2005) 27:39–54. doi:10.1016/j.socnet.2004.11.009
26. Qin Q, Wang D. Evaluation method for node importance in complex networks based on eccentricity of node. IEEE Int Conf Comput Commun (Iccc) (2016) 2499–502. doi:10.1109/CompComm.2016.7925149
27. Ruan Z, Yu B, Shu X, Zhang Q, Xuan Q. The impact of malicious nodes on the spreading of false information. Chaos (2020) 30:083101. doi:10.1063/5.0005105
28. Sabidussi G. The centrality index of a graph. Psychometrika (1966) 31:581–603. doi:10.1007/bf02289527
29. Tsai J, Nguyen TH, Tambe M. Security games for controlling contagion. In: Proceedings of the twenty-sixth AAAI conference on artificial intelligence (2012).
30. Tsai J, Nguyen TH, Weller N, Tambe M. Game-theoretic target selection in contagion-based domains. Comput J (2014) 57:893–905. doi:10.1093/comjnl/bxt094
31. Vosoughi S, Roy D, Aral S. The spread of true and false news online. Science (2018) 359:1146–51. doi:10.1126/science.aap9559
32. Wang B, Ge C, Fu L, Li S, Wang X. Drimux: Dynamic rumor influence minimization with user experience in social networks. IEEE Trans Knowl Data Eng (2017) 29:2168–81. doi:10.1109/TKDE.2017.2728064
33. Wang X, Li X, Guanrong C. Introduction to network science. Beijing, China: Higher Education Press (2012).
34. Waniek M, Michalak T, Alshamsi A. Strategic attack & defense in security diffusion games. ACM Trans Intell Syst Technol (2020) 11:1–35. doi:10.1145/3357605
35. Wilder B, Vorobeychik Y. Controlling elections through social influence (2017). doi:10.48550/ARXIV.1711.08615
36. Yang D, Liao X, Shen H, Cheng X, Chen G. Dynamic node immunization for restraint of harmful information diffusion in social networks. Physica A: Stat Mech its Appl (2018) 503:640–9. doi:10.1016/j.physa.2018.02.128
37. Zhang Y, Adiga A, Saha S, Vullikanti A, Prakash BA. Near-optimal algorithms for controlling propagation at group scale on networks. IEEE Trans Knowl Data Eng (2016) 28:3339–52. doi:10.1109/TKDE.2016.2605088
38. Zhang Y, Adiga A, Vullikanti A, Prakash BA. Controlling propagation at group scale on networks. In: 2015 IEEE international conference on data mining (ICDM) (2015). p. 619–28. doi:10.1109/ICDM.2015.59
39. Zhu J, Ni P, Wang G. Activity minimization of misinformation influence in online social networks. IEEE Trans Comput Soc Syst (2020) 7:897–906. doi:10.1109/TCSS.2020.2997188
40. Zhu J, Ni P, Wang G, Li Y. Misinformation influence minimization problem based on group disbanded in social networks. Inf Sci (2021) 572:1–15. doi:10.1016/j.ins.2021.04.086
Keywords: online social network, control diffusion, node importance, typical strategy, stackelberg game
Citation: Liu Y, Zeng R, Chen L, Wang Z and Hu L (2022) An Adversarial Dynamic Game to Controlling Information Diffusion under Typical Strategies on Online Social Networks. Front. Phys. 10:934741. doi: 10.3389/fphy.2022.934741
Received: 03 May 2022; Accepted: 13 June 2022;
Published: 31 August 2022.
Edited by:
Matjaž Perc, University of Maribor, SloveniaReviewed by:
Marija Mitrovic Dankulov, University of Belgrade, SerbiaSoumen Majhi, Bar-Ilan University, Israel
Copyright © 2022 Liu, Zeng, Chen, Wang and Hu. This is an open-access article distributed under the terms of the Creative Commons Attribution License (CC BY). The use, distribution or reproduction in other forums is permitted, provided the original author(s) and the copyright owner(s) are credited and that the original publication in this journal is cited, in accordance with accepted academic practice. No use, distribution or reproduction is permitted which does not comply with these terms.
*Correspondence: Liqin Hu, aHVsaXFpbkBoZHUuZWR1LmNu
 Yifan Liu
 Ruinan Zeng
 Lili Chen
 Zhen Wang
 Liqin Hu