 Sol M. Fernández Arancibia
 Andrew C. Oates2
 Stefan Schulte-Merker
 Luis G. Morelli
94% of researchers rate our articles as excellent or good
Learn more about the work of our research integrity team to safeguard the quality of each article we publish.
Find out more
ORIGINAL RESEARCH article
Front. Phys., 02 September 2022
Sec. Biophysics
Volume 10 - 2022 | https://doi.org/10.3389/fphy.2022.933915
This article is part of the Research TopicPattern Formation in BiologyView all 13 articles
The vertebrate axis is segmented into repetitive structures, the vertebrae. In fish, these segmented structures are thought to form from the paraxial mesoderm and the adjacent notochord. Recent work revealed an autonomous patterning mechanism in the zebrafish notochord, with inputs from the segmented paraxial mesoderm. The notochord pattern is established in a sequential manner, progressing from anterior to posterior. Building on this previous work, here, we propose a reaction wavefront theory describing notochord patterning in zebrafish. The pattern is generated by an activator–inhibitor reaction–diffusion mechanism. Cues from the paraxial mesoderm are introduced as a profile of inhibitor sinks. Reactions are turned on by a wavefront that advances from anterior to posterior. We show that this reaction wavefront ensures that a pattern is formed sequentially, in register with the cues, despite the presence of fluctuations. We find that the velocity and shape of the reaction wavefront can modulate the prevalence of defective patterns. Normal patterning is supported in a wide range of sink profile wavelengths, while a minimum sink strength is required for the pattern to follow the cues. The theory predicts that distinct defect types occur for small or large wavelengths. Thus, the reaction wavefront theory provides a possible scenario for notochord patterning, with testable predictions that prompt future experiments.
Biological pattern formation underlies the structure of tissues and organs that form during embryonic development [1]. The formation of these structures results from an interplay between gene expression patterns and cell movements [2–5]. In developing tissues, cells regulate the expression of different genes and communicate with neighboring cells by means of signals. Biochemical noise due to fluctuations in molecule number and the stochastic nature of gene expression hamper the formation of patterns [6]. However, embryonic development is a very reproducible process. Thus, a general question is how patterns form reliably despite the presence of biochemical fluctuations.
The vertebrate body plan is organized around the vertebral column, a structure of repetitive segments—the vertebrae—running from the head to tail. An early pattern of axial segments is laid out during somitogenesis. Somites form from the paraxial mesoderm tissue on both sides of the embryo midline. Somitogenesis occurs from anterior to posterior in a rhythmic manner and is controlled by a molecular genetic oscillator called the segmentation clock [7–11]. Later in development, the bone-forming cells derived from the somites are reorganized in a process termed re-segmentation, and this pattern is eventually translated into an array of vertebrae [12].
In some vertebrates, such as amniotes, it is thought that the segmented vertebral structure derives entirely from previously established somites [13]. However, fish mutants that have an impaired segmentation clock show normal formation of the majority of their vertebral centra [14–16]. This suggests that, at least in fish, normal somites are not required to determine the structure of the vertebral centrum. Still, a mutant which has a slower segmentation clock produces fewer vertebrae [17], indicating that vertebral structure does receive information from segmentation clock-derived somite segments.
Recently, it was shown that vertebral patterning is concomitantly driven by the notochord in zebrafish [16]. The notochord is an unsegmented cylinder formed by mesoderm cells that lie along the anteroposterior axis of the embryo and is flanked to both sides by somites (Figure 1A). In teleosts—fish with bones—the notochord comprises a layer of epithelial sheath cells, called chordoblasts, enveloping a column of large vacuolated cells that provide mechanical support [18, 19]. New evidence indicates that there is an autonomous patterning mechanism in the notochord that is influenced but not determined by the pre-existing somite pattern in the adjacent tissue [16].
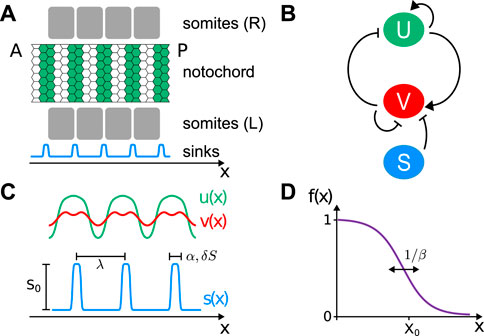
FIGURE 1. (A) Scheme showing the dorsal view of a portion of the segmented notochord (green bands) extending from anterior (A) to posterior (P). In the embryo, somites (gray squares) are located on the left and right sides relative to the notochord. The sink profile (light blue line) matches somite boundaries. (B) Interactions between activator U, inhibitor V, and the inhibitor sinks S. Pointed arrows indicate activation, and blunt-ended arrows indicate inhibition. (C) Activator (green line) and inhibitor (red line) activities. Inhibitor sinks profile (light blue line) of sink strength S0, wavelength λ, steepness α, and width 2δS. (D) Reaction wavefront profile f(x) of steepness β.
Although the nature of the zebrafish notochord patterning mechanism remains unknown, an autonomous reaction–diffusion system with an activator and an inhibitor operating in the notochord sheath cells has been proposed [16]. The cues provided by the paraxial mesoderm pattern were introduced as a distribution of inhibitor sinks. Starting from an anteriorly localized perturbation, this theory proved capable of producing an autonomous pattern, sequentially adding notochord segments from anterior to posterior in register with the cues. However, this theory did not explicitly account for random perturbations and their effects on patterning.
Here, we extend this previous theory, introducing a wavefront that moves from anterior to posterior, turning on reactions in its wake. Such reaction wavefront could have a biological origin in a molecular maturation gradient invading the notochord from the anterior. Introducing measures to characterize defective patterns, we analyze the robustness of the reaction wavefront theory upon random initial perturbations and dynamic fluctuations. We explore how the shape and velocity of the reaction wavefront modulate defect rate and analyze the effects of fluctuations in the sink positions and strength.
Here, we describe the notochord as a one-dimensional system. To describe pattern formation in the notochord sheath cells, we propose a reaction–diffusion system with an activator U and an inhibitor V. As we do not know the molecular components involved and their interactions, here, we follow [16] and consider a generic FitzHugh–Nagumo model to describe activator and inhibitor dynamics [20].
where DU and DV are diffusion coefficients, and ki are reaction rate constants. The effective variables U (x, t) and V (x, t) depend on position x and time t and represent activity levels that could be associated with actual physical concentrations through an unknown non-linear mapping.
Both species have positive linear terms for the activator and negative linear terms for the inhibitor. There is a cubic term for the activator that limits growth and enables stabilization of steady states (Figure 1B). The effect of the segmentation clock input is introduced as an additional degradation term for the inhibitor, spatially modulated by S = S(x) (Figures 1A–C). This spatial modulation takes the form of an inhibitor sinks profile S(x) = S0s(x), where S0 is a rate constant representing the sink strength and s(x) is a dimensionless profile shape.
In order to reduce the number of parameters of the model, we introduce an activity scale U0 and a timescale T0 and define new dimensionless variables u, v, x′, and t′ that verify
where L0 is a fixed length that relates the notochord length with the dimensionless system size. We can rewrite Eqs 1, 2 in terms of the new variables. Dropping primes to simplify the notation and setting the source term k0 = 0,
These two equations have units of activity over time, so we multiply both by T0/U0 to render them dimensionless. Regrouping parameters:
Selecting a timescale and an activity scale through the relations
and introducing definitions for the remaining dimensionless groups
we obtain
For the inhibitor sinks profile shape s(x), we choose a combination of opposing tanh (…) functions that compose localized peaks of steepness α = 100 and width 2δs = 0.1 separated by a wavelength λ:
A first sink is placed at λ/2, and positions xi of consecutive sinks are determined by the wavelength λ (Figure 1C).
Starting from an anteriorly localized perturbation in otherwise uniform, vanishing initial conditions, the theory described so far is capable of producing an autonomous pattern, sequentially adding notochord segments from anterior to posterior in register with the cues [16]. However, it appears unlikely that activity values for the activator and inhibitor are perfectly uniform across the notochord. Random perturbations to the initial activities may occur, for example, due to leaky transcription causing stochastic bursts [21]. In the presence of such random initial perturbations, the theory cannot account for the observed sequential segmentation [16]. Moreover, stochasticity in gene expression may introduce noise in the dynamics of both the activator and the inhibitor [6, 22]. To account for such dynamic fluctuations, we include a white noise term
where ξu (x, t) and ξv (x, t) are Gaussian processes with zero mean and uncorrelated in space, time, and between themselves, and σ sets the noise strength.
Here, we extend this theory to restore sequential patterning in the presence of noise in the initial condition and dynamics. With the scaling that we chose in Eq. 8, all reaction rates are weighted by the dimensionless parameter γ, which sets the relative strength of reaction terms. By allowing γ to depend on position and time, this dimensionless formulation permits a spatiotemporal control of the balance between reaction rates and diffusion. We use this feature to introduce a wavefront that moves from anterior to posterior, turning reactions on in its wake. Ahead of such wavefront, reactions are disabled and cannot trigger spontaneous patterning from random fluctuations. Behind the wavefront, reactions turn on and can generate patterns. Thus, we implement a reaction wavefront in the theory through the space and time dependence in parameter γ:
where γ(x, t) is a wavefront of invariant shape
moving from anterior to posterior with a velocity ν. Thus, γ(x, t) = γ0f (x − νt), where γ0 is the relative strength of reactions. The wavefront profile f(x) is a dimensionless sigmoidal function that takes values between 0 and 1, with front steepness β, and centered at X0 (Figure 1D).
Next, we solve partial differential equations using a custom Python implementation of the Heun method [23]. Spatial discretization length is Δx = 0.01, and time discretization is Δt = 0.9Δx2/(2.103). Unless something else is specified, default parameter values are given in Table 1.
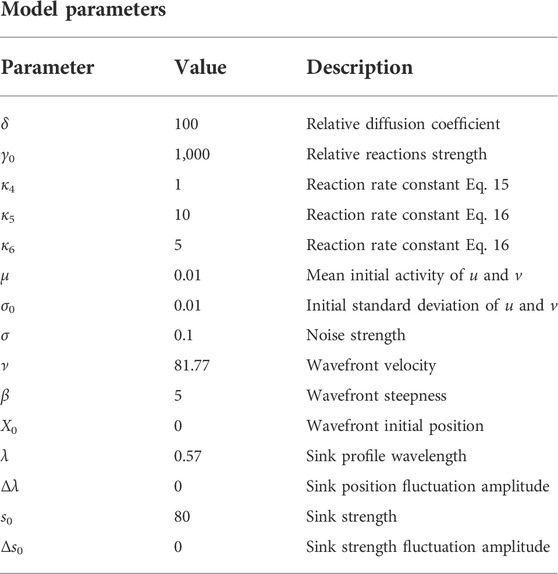
TABLE 1. Reaction wavefront theory dimensionless parameters: default values and description.
Solutions to the reaction wavefront theory with random initial conditions and noise can produce a segmented pattern sequentially (Figure 2A). Without a reaction wavefront, random perturbations are quickly amplified in the entire domain and trigger non-sequential defective pattern formation (Figure 2B and Supplementary Video S2). This suggests a possible test for the wavefront scenario that could, in principle, be implemented in an embryonic experiment. A small perturbation within the posterior region of the domain representing the notochord dies out in a reaction wavefront scenario (Figure 3A). In contrast, in the absence of a reaction wavefront, such perturbation is amplified and trigger segment formation occurs in both directions, disrupting the sequential segmentation from anterior to posterior and likely generating a defective pattern (Figure 3B and Supplementary Video S3). Thus, introducing a bead soaked in the activator within the posterior region of the unsegmented notochord would provide a test for the wavefront hypothesis. In the next section, we study how fluctuations induce pattern formation defects in the reaction wavefront theory.
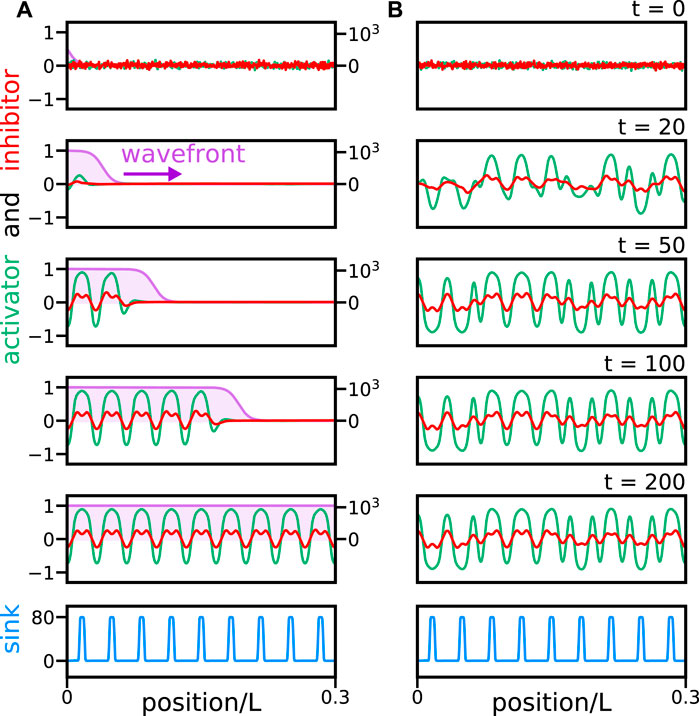
FIGURE 2. Reaction wavefront theory can produce a sequential pattern without defects in the presence of noise. Snapshots of solutions (A) of reaction wavefront theory Eqs 15, 16, and (B) Eqs 13, 14 lacking a reaction wavefront. Activator (green line) and inhibitor (red line) dimensionless activities (left axis scale) together with reaction wavefront γ(x, t) (purple line and shade, right axis scale) at different times. The bottom panel shows the inhibitor sink profile (light blue line). Position is scaled by the dimensionless system size, L = 30λ = 17.1, which is chosen to accommodate 30 segments, similar to the 31 segments in zebrafish [17, 24]. Time is expressed in frames and 1 frame
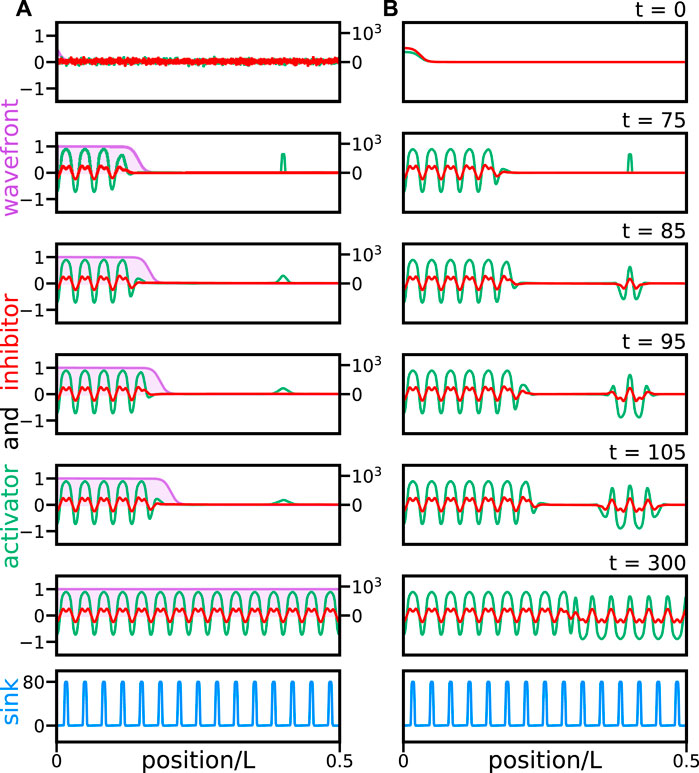
FIGURE 3. A perturbation in the posterior region of the notochord vanishes in a reaction wavefront scenario. Snapshots of solutions (A) of reaction wavefront theory Eqs 15, 16, and (B) Eqs 13, 14 with σ = 0, without a reaction wavefront. A perturbation is introduced in the activator at frame t = 75. Color coding and plot layout are as in Figure 2. Initial conditions are (A) random with mean μ = 0.01 and standard deviation σ0 = 0.05 and (B) vanishing except for the anterior perturbation. Other parameters are as in Table 1. Time is expressed in frames and 1 frame
A normal pattern is here defined by a one-to-one correspondence between sinks and activator peaks (Figure 2A). When this correspondence is broken, we call the pattern defective (Figure 2B). One source of defects is local pattern inversions, where a trough occurs at a sink position in place of a peak (Figure 4A). These pattern inversions occur because solutions to the partial differential Eqs. 15 and 16 have an inversion symmetry: if (u, v) is a solution, then so is (−u, − v). Consequently, in the presence of noise, the pattern may switch locally between peaks and troughs at sink positions. Solutions and their inverses are separated by an unstable vanishing solution (0, 0). For initial conditions with a vanishing mean value μ = 0, the resulting patterns often switch between the two solutions. Thus, the value of μ may affect the formation of normal patterns. We also expect that increasing noise strength σ will interfere with the formation of normal patterns. Thus, we first set to explore pattern robustness when these parameters change, with the aim of constructing quantitative maps that we can use to guide further exploration of the theory (Figure 4).
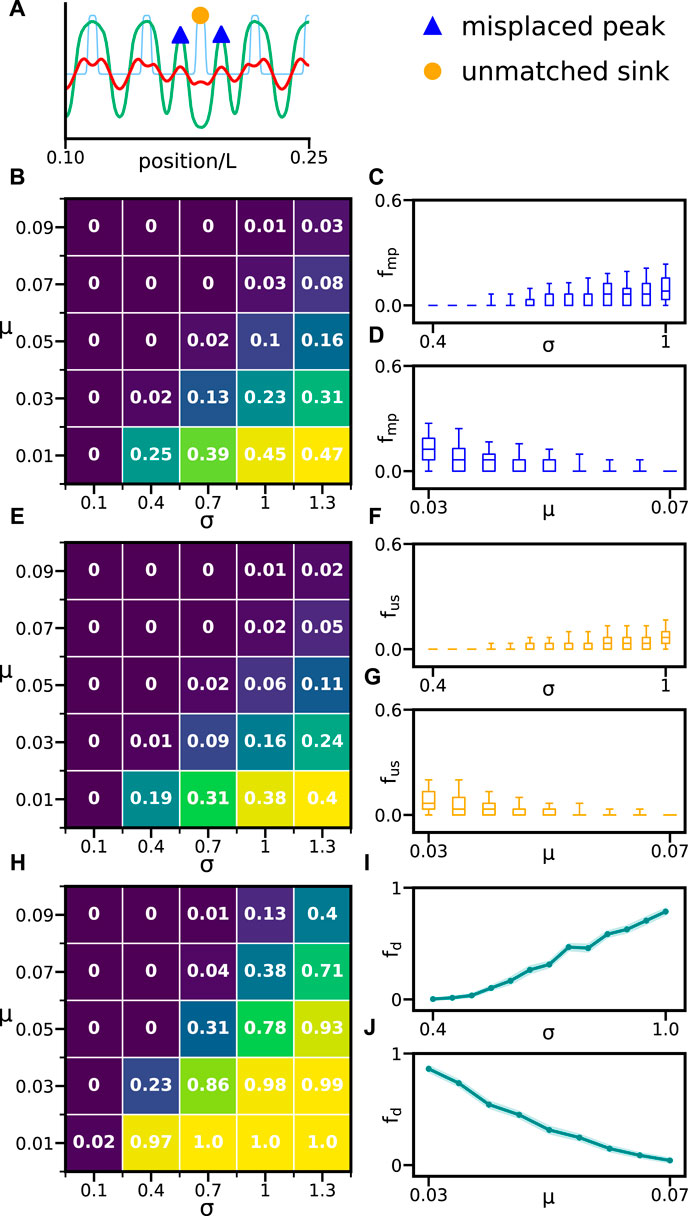
FIGURE 4. Effects of initial activity and noise in pattern formation. (A) Activator (green line), inhibitor (red line) patterns, and inhibitor sink profile (light blue line) showing misplaced peaks (blue triangles) and an unmatched sink (orange dot). (B) ⟨fmp⟩ for different values of μ and σ. (C) fmp vs. σ for fixed μ = 0.05. (D) fmp vs. μ for fixed σ = 0.7. (E)⟨fus⟩ for different values of μ and σ. (F)fus vs. σ for fixed μ = 0.05. (G)fus vs. μ for fixed σ = 0.7. (H) fd for different values of μ and σ. (I) fd vs. σ for fixed μ = 0.05. (J) fd vs. μ for fixed σ = 0.7. (I and J) Errors in fd (dark cyan shade) are the standard deviation determined using a statistical bootstrap. (C,D,F, and G) Middle line marks the median, box limits are 25 and 75 percentiles, and whiskers are 5 and 95 percentiles. Brackets ⟨.⟩ denote average over realizations. Other parameters are as in Table 1. In all cases, we performed 300 realizations for each parameter combination.
Two types of pattern defects occur: 1) misplaced peaks are not aligned with any inhibitor sink, and 2) unmatched sinks do not have a matching activator peak (Figure 4A). In this work, we have set a threshold distance between sinks and peaks for segments to be classified as normal or defective. When the distance between an activator peak and a sink is less than 10% of the mean distance between sinks, we consider this a match, and it is classified as a normal segment. Peaks without a match are defined as misplaced peaks, and sinks without a match are defined as unmatched sinks. The frequencies of these two defect types provide measures for the number of errors in the resulting pattern: fmp is the ratio between the number of misplaced peaks and the total number of peaks in the pattern, and fus is the ratio between the number of unmatched sinks and the total number of sinks. Both these measures take values between zero and one. We assess the effects of noise and initial activities on individual patterns by counting the occurrence of these defect types (Figures 4B–G). The fraction of misplaced peaks fmp and unmatched sinks fus increases with noise strength (Figures 4C,F). This means that individual patterns deteriorate with increasing noise. However, defect frequencies fmp and fus decrease with increasing initial activity μ (Figures 4D,G).
While fmp and fus characterize the frequency of defects in individual patterns, we are also interested in quantifying defective patterns at the population level. Thus, we introduce the fraction of defective patterns fd as the ratio between the number of realizations that contain at least one defect to the total number of realizations. This fraction of defective patterns increases with noise strength σ and decreases with increasing initial activity μ (Figures 4H–J). We observe that fd can become large while fmp and fus remain relatively low (Figures 4B,E,H). In embryological terms, the fraction of defective patterns is a measure of phenotype penetrance at the population level, and the frequency of defects in individual patterns provides a measure of phenotype expressivity within individual embryos. While these quantities should be related to some extent, this relation is not straightforward since the occurrence of a defect in a pattern might favor further defects.
In summary, these results show how increasing noise causes more pattern defects and defective patterns. In contrast, shifting the mean of the initial condition away from the boundary of the unstable vanishing solution reduces defect prevalence (Figure 4). In the following sections, we use these maps to choose values of σ and μ to further explore other sources of noise and variability in the theory.
In addition to dynamic activity fluctuations, the other novel component in the theory is the reaction wavefront γ(x, t). This reaction wavefront moves with velocity ν, and its shape is determined by the wavefront profile steepness β (Eq. 17 and Figure 1D).
In the absence of noise and reaction wavefront, starting from a small anterior perturbation with otherwise vanishing initial conditions, a pattern forms sequentially, invading the unpatterned region with a natural propagation velocity ν0 [16]. To determine the value of ν0, we set a threshold activity value for the activator and determine the trajectory of the posterior-most position where the pattern activity exceeds this threshold. A linear fit of this trajectory returns the value ν0 = 81.77 that we use to scale velocities.
We find that decreasing the reaction wavefront velocity below ν/ν0 = 1 can reduce the fraction of defective patterns (Figure 5A). This indicates that retarding pattern propagation may be favorable for normal pattern formation. Normal pattern formation is also affected by the shape of the reaction wavefront (Figure 5B). The fraction of defective patterns peaks around β = 2, decaying both above and below this value. However, for small β, the wavefront profile becomes too gradual and sequential pattern formation is lost, compromising a key role of the reaction wavefront (Supplementary Video S5). Thus, a steeper reaction wavefront would be beneficial for normal pattern formation.
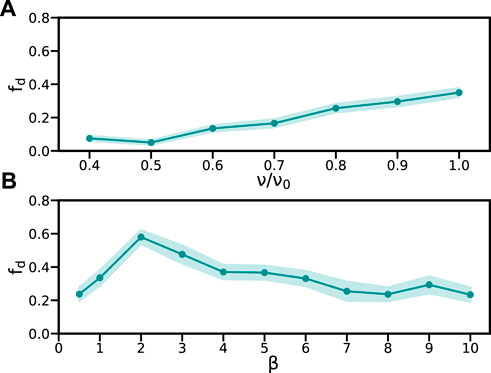
FIGURE 5. Reaction wavefront can modulate defect rates. Fraction of defective patterns fd vs. (A) relative velocity ν/ν0 and (B) steepness β. Errors in fd (dark cyan shade) are the standard deviation determined using a statistical bootstrap. Other parameters are as in Table 1, except μ = 0.05 and σ = 0.7. In all cases, we performed 300 realizations of each simulation.
In summary, both the velocity and shape of the reaction wavefront critically affect the fraction of defective patterns. A slower and steeper wavefront could have a dual role: 1) allowing for sequential pattern formation and 2) rendering patterning more robust in the presence of random fluctuations.
The forming notochord segments should align with previously formed somites in the adjacent tissue. It is thought that the adjacent paraxial mesoderm provides signals that influence notochord segment formation to be in register with somites [16]. In the theory, paraxial mesoderm signals are introduced as an inhibitor sinks profile s(x) with a characteristic wavelength and strength s0 (Eq. 12). In the following section, we explore how the reaction wavefront theory responds to changes in this sinks profile. To decouple defects due to dynamic noise while perturbing sink wavelength and strength, we set parameters σ = 0.1 and μ = 0.01 with a very low fraction of defective realizations fd ≈ 0.02 (Figure 4H).
Alterations to the segmentation clock can induce changes in somite length, as in the case of hes6 mutant [17]. Therefore, we next explore whether pattern formation can adapt to different sink profile wavelengths. In the absence of a wavefront and noise, Eqs 10, 11, and for a vanishing sink profile s0 = 0, the unforced reaction–diffusion system selects a natural wavelength λ0 = 0.398 that is determined by parameters values (Supplementary Material). Thus, we compute defect fractions for different sink profile wavelengths λ, taking this natural wavelength as a reference (Figure 6C). We find that for small profile wavelengths, the predominant type of defect is unmatched sinks (Figures 6A,C and Supplementary Video S6A). The reason for this may be that the system often fails to produce activator peaks at the short distances imposed by the sinks. In contrast, for sufficiently large wavelengths, the predominant type of defect is misplaced peaks (Figures 6B,C and Supplementary Video S6B). Here the reason maybe that, with enough space in between sinks, the system tries to produce a segment of the shorter natural wavelength, so activator peaks are often intercalated. For intermediate profile wavelength values, we find a broad range where no defects occur (Figure 6C). It is interesting that this defect-free range is centered at λ/λ0 ≈ 1.4, which is away from the natural wavelength λ0. This may result from a non-trivial interplay between sinks and the unforced reaction–diffusion system, which alters the patterning mode.
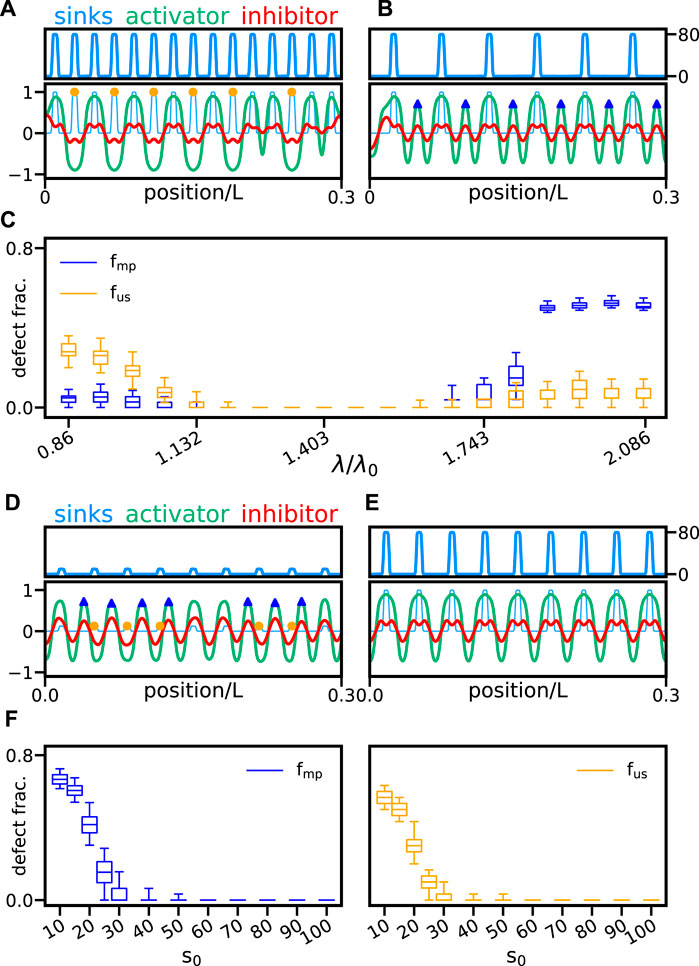
FIGURE 6. Sink profile wavelength and strength. Activator (green line) and inhibitor (red line) patterns together with the scaled sink profile (faint light blue line) are shown for sink profiles of wavelength (A) λ/λ0 = 0.86 and (B) λ/λ0 = 2.086. Here, λ0 = 0.398 is the wavelength of the unforced pattern. Sink profile (light blue line) is also shown separately in the top panels for clarity. (C) Fraction of misplaced peaks fmp (blue box plot) and unmatched sinks fus (orange box plot) vs. relative sink profile wavelength λ/λ0. Activator and inhibitor patterns for sink profiles of strength (D) s0 = 10 and (E) s0 = 80. Color coding and plot layout are as in panels (A and B). (F) Fraction of misplaced peaks fmp (blue box plot) and unmatched sinks fus (orange box plot) vs. sink profile strength s0. Box plots in (C) and (F) are as in Figure 4. Other parameters are as in Table 1. In all cases, we performed 300 realizations for each parameter combination.
In addition to wavelength fluctuations, another possible source of sink profile variability is the sink strength s0. To characterize the effects of sink strength on pattern formation, we first alter s0 uniformly across the axis. For large sink strength, the fractions of defects are vanishing (Figures 6E,F). As the sink strength is reduced, defect fractions abruptly grow to large values (Figures 6D,F). When the sink strength is small, it may be insufficient to entrain the formation of a segment at that position. With this resolution, the onset of defects appears to occur at a sink strength threshold s0 = 30.
Thus, segments form normally above a critical sink strength and for a wide range of sink profile wavelengths. This tolerance for different wavelengths is consistent with the hes6 mutant phenotype. For short sink profile wavelengths, defects are predominantly unmatched sinks, while for large wavelengths, misplaced peaks dominate the defective patterns.
So far, we have considered sink profiles with a fixed wavelength, where sink positions are regularly spaced. However, the segmentation clock that drives somite formation is subject to fluctuations that may cause segment length variability [16, 24, 25]. Thus, we next ask how the pattern responds to local fluctuations in individual sink positions. To introduce sink position fluctuations, we generate the sink profile sequentially, placing sinks at perturbed positions a distance λ + δλ from the previous sink. Here, δλ is a random variable uniformly distributed in the interval ±Δλ, and Δλ controls the amplitude of sink position fluctuations. We find that the reaction wavefront theory is robust against small position fluctuations (Figure 7A). Up to Δλ/λ = 0.25, we see a vanishing fraction of both defect types, which then appear to grow gradually (Figures 7B and C). Here, fluctuations in sink position are relative to a mean wavelength λ = 0.57, so λ/λ0 ≈ 1.43 is close to the midpoint of the defect-free region in Figure 6C. The defect-free region spans a range that extends about 20% above and below this midpoint, so fluctuations of up to 25% of the mean wavelength are mostly included in the defect-free region of Figure 6C. Thus, the observed onset of defects in Figure 7C may be due to the fact that fluctuations of about 25% can cause consecutive sinks that are either closer or further apart than the supported wavelengths in the defect-free region.
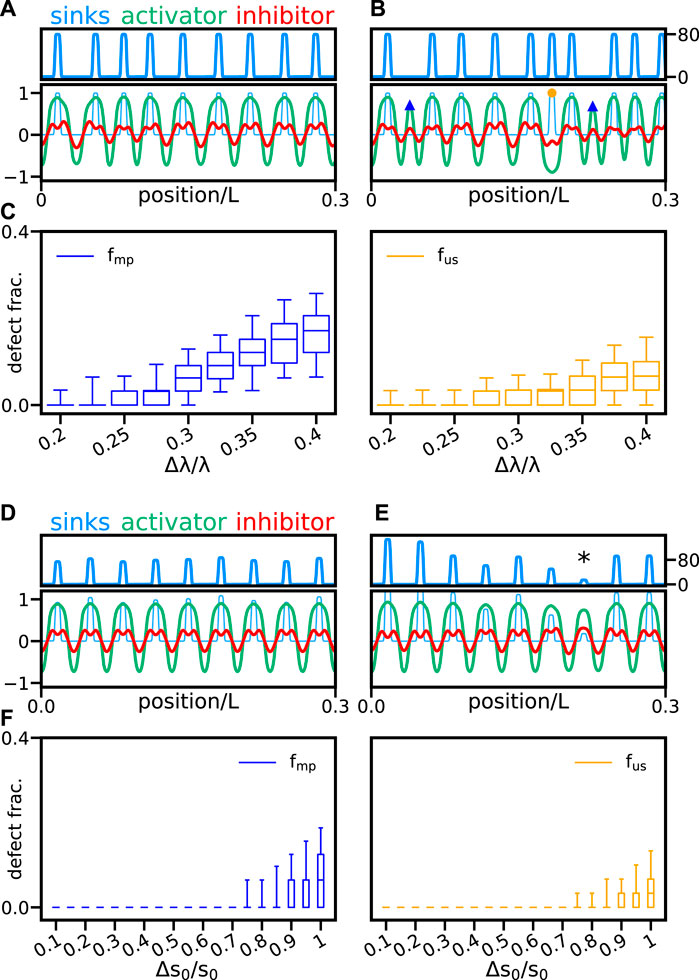
FIGURE 7. Fluctuations in sink position and strength. Activator (green line) and inhibitor (red line) patterns together with the scaled sink profile (faint light blue line) are shown for sink profiles with relative sink position fluctuation amplitudes (A) Δλ/λ = 0.2 and (B) Δλ/λ = 0.4. We choose a mean wavelength λ = 0.57, so λ/λ0 ≈ 1.43 is close to the center of the defect free region in Figure 6C. Sink profile (light blue line) is also shown separately in the top panels for clarity. (C) Fraction of misplaced peaks fmp (blue box plot) and unmatched sinks fus (orange box plot) vs. relative sink position fluctuation amplitudes Δλ/λ. Activator and inhibitor patterns for sink profiles with relative sink strength fluctuation amplitudes (D) Δs0/s0 = 0.1 and (E) Δs0/s0 = 1, with mean sink strength s0 = 80. Color coding and plot layout are as in panels (A and B). (E) Asterisk marks a sink of strength s0 ≈ 15. (F) Fraction of misplaced peaks fmp (blue box plot) and unmatched sinks fus (orange box plot) vs. relative sink strength fluctuation amplitude Δs0/s0. Box plots in (C) and (F) are as in Figure 4. Other parameters are as in Table 1. In all cases, we performed 300 realizations for each parameter combination.
In the embryo, the information provided by the paraxial mesoderm could be variable along the segmenting axis. Thus, a relevant question is how the reaction wavefront theory responds to sink strength variability. We set individual sink strengths to s0 + δs, where δs is a random variable uniformly distributed in the interval ±Δs0, and Δs0 controls the amplitude of sink strength fluctuations. The fraction of defects is vanishing or very small for a wide range of the relative fluctuations amplitude Δs0/s0 (Figures 7D–F). For relatively large fluctuations Δs0/s0 = 1, the pattern can correctly entrain to the sink profile even when individual sink strength falls way below the critical threshold for uniform profiles, asterisk in Figure 7E.
In summary, the system can buffer fluctuations in sink position up to 25%. Stronger sink position fluctuations can disturb the patterns inducing defects of both types. Additionally, the median of defective fractions vanishes up to a relative sink strength fluctuation Δs0/s0 = 0.85 (Figure 7F). With this value, sinks may be as weak as s0 = 12, which in uniform patterns generate large defect fractions (Figure 6F). This indicates that nonuniform sink profiles display a high tolerance for large sink strength fluctuations.
We presented a reaction wavefront theory describing notochord pattern formation in zebrafish. Building on a one-dimensional activator–inhibitor reaction–diffusion system subject to external cues [16], we introduced a reaction wavefront that travels from anterior to posterior and enables reactions in its path. Although we do not know the nature of this reaction wavefront, we can speculate that a maturation gradient progressing posteriorly could trigger synthesis reactions. The gradient progression could control the synthesis of an adaptor molecule that binds DNA at the promoter of the activator and the inhibitor, allowing binding and action of the activator. Alternatively, the gradient could be an inhibitor of U and V that is initially present across the notochord and then gradually degraded as cells stop synthesizing it—or start degrading it actively. Such mechanisms would make the activation terms turn on when the maturation wavefront arrives at the cell. In the context of our model, this could be described effectively by parameters k1, k3, and k5 in Eqs 1and 2. In the dimensionless theory, since γ ∝ k1, the wavefront γ(x, t) could be caused by a posteriorly decreasing synthesis rate for the activator and other coupled reactions.
First put forward by Turing [26] and later rediscovered by Gierer and Meinhardt [27], reaction diffusion systems have been applied to a variety of biological pattern formations [20]. Specific molecular components and their interactions have been proposed in some cases, such as for skin patterns in angelfish [28] and zebrafish [29] and the primary hair follicle pattern formation in the skin of vertebrates [30, 31], among other examples [32]. While the conditions for pattern formation in reaction–diffusion systems have been thought to be very restrictive, recent efforts have shown that these conditions may be relaxed in a wide range of cases. Along this line is a proposal for a synthetic circuit architecture capable of patterning with quenched oscillators that might be implemented in synthetic multicellular systems or cell aggregates [33]. In another study, the presence of a binding immobile substrate was shown to relax the constraints on reaction kinetics for diffusion-driven instability [34]. The need for constraints on diffusion rates for Turing patterns was also challenged in a study that used an automated framework to identify cell autonomous features that allow for pattern formation [35]. More recently, the plausibility of network motifs to give rise to reaction–diffusion patterns was systematically surveyed by means of graph theory [36]. Here, we have not chosen a specific network motif to implement the cell autonomous component. Instead, we choose a generic model to describe the dynamics, given that we do not know the molecular components involved and their interactions. It may be interesting future work to study how more specific networks respond to the presence of cues and a wavefront.
In this article, we have considered a theory that can generate a pattern from an unstable homogeneous state. Another possibility could be a pushed front invading a stable homogeneous state that is perturbed beyond unstable fixed points and is attracted by non-vanishing stable fixed points [37, 38]. This can occur in the context of an amplitude equation with a quintic term introducing the possibility of a subcritical bifurcation. In our theory, the only nonlinear term is the stabilizing cubic term in the activator equation, so we expect that the amplitude equation will have only up to third-order terms [39]. We expect that an additional fifth-order term in the equation that contains the cubic nonlinearity would cause a subcritical bifurcation and allow patterning from a stable homogeneous state, without requiring a wavefront. This could constitute an alternative scenario for the notochord patterning, and it would be interesting to study how this instability responds to an external input source providing the cues for the segments.
In addition to the reaction wavefront, the theory accounts for stochastic gene expression incorporating both noise in the initial condition for the activities of the components and a dynamic noise term in the differential equations. The theory describes the sequential patterning of the notochord in register with cues, from anterior to posterior, as observed in zebrafish [16], even in the presence of noise (Figure 2). A perturbation in the posterior region of the notochord should die out in the presence of a reaction wavefront but grow and generate a non-sequential defective pattern in its absence (Figure 3). Thus, the reaction wavefront hypothesis could be tested by introducing a bead soaked in the activator within the posterior notochord region.
In the embryo, the wild-type notochord segments are in register with the previously patterned paraxial mesoderm: one notochord segment is formed for each adjacent pair of somites. Thus, in the theory, we hypothesize that cues from somite boundaries instruct the notochord patterning mechanism, taking the form of a sink profile for the inhibitor. A normal pattern is defined by a one-to-one correspondence between individual activator peaks and inhibitor sinks. Two types of defects can occur in the theory: an inhibitor sink without a corresponding peak and a peak that does not have a corresponding inhibitor sink. Such defects may be amenable to observation in the embryo since somite boundaries can be seen as morphological landmarks with a bright field microscope or the DMD transgenic line [40], and notochord segment precursors can be revealed using a reporter for entpd5 [16].
In the dimensionless theory that we considered here, the sink profile appears under the control of the wavefront γ(x, t) (see Eq. 16). However, note that if the spatiotemporal dependence of γ(x, t) is given by k1 as we hypothesize above, the sink term would be time-independent, since s0 = S0/k1 in the dimensionless theory (Eq. 9). This could be made explicit by keeping the sink term out of the wavefront in Eq. 7, by introducing an additional dimensionless parameter ζ = T0S0 that is constant in time and uniform in space, that is, not wavefront controlled.
Both wavefront velocity and steepness can modulate defect rate (Figure 5). We observe an interesting non-monotonic relation of the fraction of defective patterns with the wavefront steepness, peaking at β = 2. However, below this vale of β, the wavefront becomes very gradual, causing the pattern to trigger ahead of the wavefront middle point, with more than one activator peak forming simultaneously. We speculate that this might allow the reaction system to read the information of more than one sink in advance and accommodate the activator peaks more reliably. We also observe that slower wavefront velocities cause a decrease in the fraction of defective patterns, suggesting that this could be beneficial for embryonic patterning. A slower wavefront may allow the reaction system to average out fluctuations introduced by the dynamic noise source, and this may prevent defect formation. It is intriguing that while zebrafish somitogenesis takes about 12 h, notochord patterning is relatively much slower, taking about 3 weeks [16]. The theory predicts that accelerating the wavefront in a wild-type context may induce segment defects. A possible test of this prediction could be to slow down the wavefront in an experimental condition that is prone to making defects. Presumably, transcriptional noise levels would be increased in a heterozygous mutant for a component of the notochord patterning system. In this context, the notochord pattern would be expected to make more defective segments, and we could ask whether a slower wavefront can partially rescue the phenotype.
The hes6 mutant has larger somite segments and still patterns the notochord in register with these [17]. Consistent with this, here, we find a broad range of sink profile wavelengths where no defects occur (Figure 6C). Different defect types dominate for large and small wavelengths. For sufficiently small wavelengths, the system fails to produce peaks at such short distances, so it often misses every other sink. For large wavelengths, the pattern often intercalates a peak in between sinks. These characteristic defective patterns could be tested experimentally in conditions with altered somite lengths. Very small somites would cause notochord defects that skip adjacent somite boundaries, while large somites would cause misplaced notochord segments to happen more often. The transient modulation of Fgf or Wnt signaling during somitogenesis may provide a means to locally induce the formation of a small number of somites with altered length [41, 42], offering a way to test these predictions for segment lengths outside the range observed in the known segmentation clock period mutants.
We found an abrupt transition to defective patterns as a function of sink strength (Figure 6F). To decouple defects due to dynamic noise while perturbing sink strength, in this work, we have chosen a low dynamic noise strength σ = 0.1. There may be an interplay between sink strength and dynamic noise strength in determining both the onset and shape of this transition. This remains an interesting open question for future work.
Sink profile alterations may involve sink strength and wavelength fluctuations. There is a minimum sink strength required for the pattern to follow sink cues normally (Figure 6). However, in a sink profile with fluctuating strengths, sink strength values below the threshold do not cause pattern defects as long as they are surrounded by stronger sinks (Figure 7). Furthermore, fluctuations of up to 20% in the distance between sinks do not cause pattern defects (Figure 7). This is important because, in the embryo, we can expect some variability both in the intensity of cues provided by somite boundaries and in the distances between them [25]. We have not considered the changes to sink width and steepness, that is, sink shape fluctuations, which may be an interesting topic for future work.
The role of the notochord in vertebral column development seems to differ in different species, such as amniotes and teleosts [19]. The amniote notochord lacks the layer of epithelial cells and is formed by vacuolated cells only, surrounded by an extracellular matrix [43]. In chicks, vertebrae are thought to derive entirely from somite cells, while a cross-talk between somites and notochord ensures that the notochord contribution to vertebral discs is in register with vertebral bodies [43]. In teleosts, the inner part of the vertebral bodies derives from notochord cells [13]. In particular, zebrafish notochord sheath cells are the initial substrate for the vertebral bodies patterning and formation. A sequential ring-like pattern of entpd5 expression is observed in the notochord sheath cells as the first sign of vertebral patterning [16]. In this work, we considered the notochord as a one-dimensional tissue for simplicity. In future work, it would be interesting to study ring pattern formation considering the notochord as a cylindrical surface. This geometry might support a richer variety of patterns, for example, helical defects.
The notochord tissue has remarkable mechanical properties. It is thought that the notochord serves as a hydrostatic scaffold during embryonic development [44, 45]. The particular structural configuration of the notochord, with the central vacuolated cells and its enveloping sheath cells, provides it with mechanical support as well as elasticity [18, 46]. Caveolae located in the vacuolated cells are essential for notochord structural integrity [47]. The arrangement of vacuolated cells is achieved by a self-organizing mechanical process and has been realized in a physical notochord model [48]. Here, we have considered a purely biochemical mechanism of notochord patterning. An interesting question for future enquiry is whether mechanical signaling has a role in providing either the sink cues or some other aspect of the patterning mechanism.
In summary, we have presented a possible scenario for an autonomous notochord patterning mechanism. The reaction wavefront theory is consistent with the observed spatiotemporal pattern in the notochord. We expect that this work will motivate future experimental designs to test the distinct predictions from this theory.
The raw data supporting the conclusion of this article will be made available by the authors, without undue reservation.
All authors contributed to conceptualization and research design. SFA designed and implemented software, performed numerical simulations, and produced plots and figures. All authors contributed to formal analysis and validated the data and figures. All authors wrote and revised the manuscript.
This work was supported by ANPCyT grants PICT 2017 3753 and PICT 2019 0445 awarded to LGM and FOCEM-Mercosur (COF 03/11) to IBioBA. SFA was supported by a CONICET fellowship, and LGM is a researcher of CONICET.
The authors are grateful to D. Arribas, F. Fabris, and D. Tenenbaum for their thoughtful comments on the manuscript.
The authors declare that the research was conducted in the absence of any commercial or financial relationships that could be construed as a potential conflict of interest.
All claims expressed in this article are solely those of the authors and do not necessarily represent those of their affiliated organizations, or those of the publisher, the editors, and the reviewers. Any product that may be evaluated in this article, or claim that may be made by its manufacturer, is not guaranteed or endorsed by the publisher.
The Supplementary Material for this article can be found online at: https://www.frontiersin.org/articles/10.3389/fphy.2022.933915/full#supplementary-material
1. Wolpert L, Smith J, Jessell T, Lawrence P, Robertson E, Meyerowitz E. Principles of development. 3rd ed. Oxford University Press (2006).
2. Howard J, Grill SW, Bois JS. Turing's next steps: The mechanochemical basis of morphogenesis. Nat Rev Mol Cel Biol (2011) 12:392–8. doi:10.1038/nrm3120
3. Uriu K, Morelli LG, Oates AC. Interplay between intercellular signaling and cell movement in development. Semin Cel Dev Biol (2014) 35:66–72. doi:10.1016/j.semcdb.2014.05.011
4. Gross P, Kumar KV, Grill SW. How active mechanics and regulatory biochemistry combine to form patterns in development. Annu Rev Biophys (2017) 46:337–56. doi:10.1146/annurev-biophys-070816-033602
5. Petrungaro G, Morelli LG, Uriu K. Information flow in the presence of cell mixing and signaling delays during embryonic development. Semin Cel Dev Biol (2019) 93:26–35. doi:10.1016/j.semcdb.2018.09.008
6. Raser JM, O’Shea EK. Noise in gene expression: Origins, consequences, and control. Science (2005) 309:2010–3. doi:10.1126/science.1105891
7. Palmeirim I, Henrique D, Ish-Horowicz D, Pourquié O. Avian hairy gene expression identifies a molecular clock linked to vertebrate segmentation and somitogenesis. Cell (1997) 91:639–48. doi:10.1016/s0092-8674(00)80451-1
8. Masamizu Y, Ohtsuka T, Takashima Y, Nagahara H, Takenaka Y, Yoshikawa K, et al. Real-time imaging of the somite segmentation clock: Revelation of unstable oscillators in the individual presomitic mesoderm cells. Proc Natl Acad Sci U S A (2006) 103:1313–8. doi:10.1073/pnas.0508658103
9. Soroldoni D, Jörg DJ, Morelli LG, Richmond DL, Schindelin J, Jülicher F, et al. A Doppler effect in embryonic pattern formation. Science (2014) 345:222–5. doi:10.1126/science.1253089
10. Pourquié O. Vertebrate segmentation: From cyclic gene networks to scoliosis. Cell (2011) 145:650–63. doi:10.1016/j.cell.2011.05.011
11. Oates AC, Morelli LG, Ares S. Patterning embryos with oscillations: Structure, function and dynamics of the vertebrate segmentation clock. Development (2012) 139:625–39. doi:10.1242/dev.063735
12. Bagnall K, Higgins SJ, Sanders E. The contribution made by a single somite to the vertebral column: Experimental evidence in support of resegmentation using the chick-quail chimaera model. Development (1988) 103:69–85. doi:10.1242/dev.103.1.69
13. Fleming A, Kishida MG, Kimmel CB, Keynes RJ. Building the backbone: The development and evolution of vertebral patterning. Development (2015) 142:1733–44. doi:10.1242/dev.118950
14. Fleming AF, Keynes R, Tannahill D. A central role for the notochord in vertebral patterning. Development (2004) 131:873–80. doi:10.1242/dev.00952
15. Agrawal S, Archer C, Schaffer DV. Computational models of the notch network elucidate mechanisms of context-dependent signaling. Plos Comput Biol (2009) 5:e1000390. doi:10.1371/journal.pcbi.1000390
16. Lleras Forero L, Narayanan R, Huitema LF, Vanbergen M, Apschner A, Peterson-Maduro J, et al. Segmentation of the zebrafish axial skeleton relies on notochord sheath cells and not on the segmentation clock. eLife (2018) 7:e33843. doi:10.7554/elife.33843
17. Schröter C, Oates AC. Segment number and axial identity in a segmentation clock period mutant. Curr Biol (2010) 20:1254–8. doi:10.1016/j.cub.2010.05.071
18. Stemple DL. Structure and function of the notochord: An essential organ for chordate development. Development (2005) 132:2503–12. doi:10.1242/dev.01812
19. Bagnat M, Gray RS. Development of a straight vertebrate body axis. Development (2020) 147:dev175794.
20. Murray JD. Mathematical biology II: Spatial models and biomedical applications. In: Interdisciplinary applied mathematics. 3rd ed., 18. New York: Springer (2003).
21. Chubb JR, Trcek T, Shenoy SM, Singer RH. Transcriptional pulsing of a developmental gene. Curr Biol (2006) 16:1018–25. doi:10.1016/j.cub.2006.03.092
22. Tsimring LS. Noise in biology. Rep Prog Phys (2014) 77:026601. doi:10.1088/0034-4885/77/2/026601
23. San Miguel M, Toral R. Instabilities and nonequilibrium structures VI. In: E Tirapegui, J Martínez, and R Tiemann, editors. Nonlinear phenomena and complex systems. Kluwer Academic Publishers (2000). p. 35–130. doi:10.1007/978-94-011-4247-2
24. Gomez C, Özbudak EM, Wunderlich J, Baumann D, Lewis J, Pourquié O. Control of segment number in vertebrate embryos. Nature (London) (2008) 454:335–9. doi:10.1038/nature07020
25. Schröter C, Herrgen L, Cardona A, Brouhard GJ, Feldman B, Oates AC. Dynamics of zebrafish somitogenesis. Dev Dyn (2008) 237:545–53. doi:10.1002/dvdy.21458
26. Turing AM. The Chemical Basis of Morphogenesis. Philosophical Trans R Soc Lond Ser B (1952) 237:37–72.
27. Gierer A, Meinhardt H. A theory of biological pattern formation. Kybernetik (1972) 12:30–9. doi:10.1007/bf00289234
28. Kondo S, Asai R. A reaction–diffusion wave on the skin of the marine angelfish Pomacanthus. Nature (1995) 376:765–8. doi:10.1038/376765a0
29. Yamaguchi M, Yoshimoto E, Kondo S. Pattern regulation in the stripe of zebrafish suggests an underlying dynamic and autonomous mechanism. Proc Natl Acad Sci U S A (2007) 104:4790–3. doi:10.1073/pnas.0607790104
30. Mou C, Jackson B, Schneider P, Overbeek PA, Headon DJ. Generation of the primary hair follicle pattern. Proc Natl Acad Sci U S A (2006) 103:9075–80. doi:10.1073/pnas.0600825103
31. Klika V, Baker RE, Headon D, Gaffney EA. The influence of receptor-mediated interactions on reaction-diffusion mechanisms of cellular self-organisation. Bull Math Biol (2012) 74:935–57. doi:10.1007/s11538-011-9699-4
32. Kondo S, Miura T. Reaction-diffusion model as a framework for understanding biological pattern formation. Science (2010) 329:1616–20. doi:10.1126/science.1179047
33. Hsia J, Holtz WJ, Huang DC, Arcak M, Maharbiz MM. A feedback quenched oscillator produces turing patterning with one diffuser. Plos Comput Biol (2012) 8:e1002331. doi:10.1371/journal.pcbi.1002331
34. Korvasová K, Gaffney EA, Maini PK, Ferreira MA, Klika V. Investigating the Turing conditions for diffusion-driven instability in the presence of a binding immobile substrate. J Theor Biol (2015) 367:286–95. doi:10.1016/j.jtbi.2014.11.024
35. Marcon L, Diego X, Sharpe J, Müller P. High-throughput mathematical analysis identifies Turing networks for patterning with equally diffusing signals. eLife (2016) 5:e14022. doi:10.7554/elife.14022
36. Diego X, Marcon L, Müller P, Sharpe J. Key features of turing systems are determined purely by network topology. Phys Rev X (2018) 8:021071. doi:10.1103/physrevx.8.021071
38. Cross MC, Greenside HS. Pattern formation and dynamics in nonequilibrium systems. Cambridge University Press (2009).
39. Kuznetsov M, Kolobov A, Polezhaev A. Pattern formation in a reaction-diffusion system of Fitzhugh-Nagumo type before the onset of subcritical Turing bifurcation. Phys Rev E (2017) 95:052208. doi:10.1103/physreve.95.052208
40. Ruf-Zamojski F, Trivedi V, Fraser SE, Trinh LA. Spatio-temporal differences in dystrophin dynamics at mRNA and protein levels revealed by a novel FlipTrap line. PLoS One (2015) 10:e0128944. doi:10.1371/journal.pone.0128944
41. Sawada A, Shinya M, Jiang Y-J, Kawakami A, Kuroiwa A, Takeda H. Fgf/MAPK signalling is a crucial positional cue in somite boundary formation. Development (2001) 128:4873–80. doi:10.1242/dev.128.23.4873
42. Bajard L, Morelli LG, Ares S, Pécréaux J, Jülicher F, Oates AC. Wnt-regulated dynamics of positional information in zebrafish somitogenesis. Development (2014) 141:1381–91. doi:10.1242/dev.093435
43. Ward L, Pang AS, Evans SE, Stern CD. The role of the notochord in amniote vertebral column segmentation. Developmental Biol (2018) 439:3–18. doi:10.1016/j.ydbio.2018.04.005
44. Ellis K, Bagwell J, Bagnat M. Notochord vacuoles are lysosome-related organelles that function in axis and spine morphogenesis. J Cel Biol (2013) 200:667–79. doi:10.1083/jcb.201212095
45. Bagwell J, Norman J, Ellis K, Peskin B, Hwang J, Ge X, et al. Notochord vacuoles absorb compressive bone growth during zebrafish spine formation. eLife (2020) 9:e51221. doi:10.7554/elife.51221
46. Adams DS, Keller R, Koehl MAR. The mechanics of notochord elongation, straightening and stiffening in the embryo of Xenopus laevis. Development (1990) 110:115–30. doi:10.1242/dev.110.1.115
47. Garcia J, Bagwell J, Njaine B, Norman J, Levic DS, Wopat S, et al. Sheath cell invasion and trans-differentiation repair mechanical damage caused by loss of caveolae in the zebrafish notochord. Curr Biol (2017) 27:1982–9.e3. doi:10.1016/j.cub.2017.05.035
Keywords: vertebrate segmentation, pattern formation theory, reaction–diffusion, activator–inhibitor, noise
Citation: Fernández Arancibia SM, Oates AC, Schulte-Merker S and Morelli LG (2022) Reaction wavefront theory of notochord segment patterning. Front. Phys. 10:933915. doi: 10.3389/fphy.2022.933915
Received: 01 May 2022; Accepted: 29 July 2022;
Published: 02 September 2022.
Edited by:
Pau Formosa-Jordan, Max Planck Institute for Plant Breeding Research, GermanyReviewed by:
James Cotterell, European Molecular Biology Laboratory, SpainCopyright © 2022 Fernández Arancibia, Oates, Schulte-Merker and Morelli. This is an open-access article distributed under the terms of the Creative Commons Attribution License (CC BY). The use, distribution or reproduction in other forums is permitted, provided the original author(s) and the copyright owner(s) are credited and that the original publication in this journal is cited, in accordance with accepted academic practice. No use, distribution or reproduction is permitted which does not comply with these terms.
*Correspondence: Luis G. Morelli, bW9yZWxsaS5sdWlzLmdAZ21haWwuY29t
Disclaimer: All claims expressed in this article are solely those of the authors and do not necessarily represent those of their affiliated organizations, or those of the publisher, the editors and the reviewers. Any product that may be evaluated in this article or claim that may be made by its manufacturer is not guaranteed or endorsed by the publisher.
Research integrity at Frontiers
Learn more about the work of our research integrity team to safeguard the quality of each article we publish.