- 1College of Education for the Future, Beijing Normal University, Zhuhai, China
- 2State Key Laboratory of Lunar and Planetary Sciences, Macau University of Science and Technology, Macao, China
- 3CNSA Macau Center for Space Exploration and Science, Macao, China
- 4Center for Cognition and Neuroergonomics, State Key Laboratory of Cognitive Neuroscience and Learning, Beijing Normal University, Zhuhai, China
We demonstrated numerically the generation of broadband, coherent supercontinuum (SC) spectra in the mid-infrared region using dispersion-engineered all-chalcogenide microstructured fibers (MOFs). The 1-cm-long hexagonal fiber can be made with Ge11.5As24S64.5 glass as a low-refractive-index material embedded in a Ge11.5As24Se64.5 glass matrix. By optimizing the structural parameters, we determined a broad and flat all-normal-dispersion characteristic up to 14 μm. A highly coherent broadband SC with an intensity greater than −3 dB in the range from 5973 to 8695 nm is obtained when the fiber is pumped by a 7 μm laser with pulse duration of 50 fs and peak power of 6 kW. Flat-top SC of −30 dB level can be observed utilizing identical pump pulse parameters, covering wavelengths from 3823 to 13577 nm (>1.5 octaves). This broadband coherent MIR SC source can be applied in frequency metrology, optical coherence tomography, biomedical imaging, and few-cycle pulse compression.
Introduction
Supercontinuum (SC) generation in the mid-infrared (MIR) spectral region has great potential because it offers unique capabilities in molecule detection and identification [1]. The development of broadband coherent MIR SC sources has improved technologies such as trace gas spectroscopy and optical sensing [2, 3], and boosted studies and applications in frequency metrology, optical coherence tomography, and biomedical imaging [4–6]. To achieve a coherent SC output with the broadest spectra, a common way is to pump the fiber in its anomalous dispersion regime and close to the zero-dispersion wavelength (ZDW) [7]. However, since the spectral broadening mechanism here is dominated by soliton-related dynamics, the generated SC spectra are strongly sensitive to fluctuations of the pump pulse intensity and present considerable fine structure throughout the bandwidth [8, 9]. Modulation instability processes also have a significant influence on SC coherence, where the initial spectral broadening is seeded from noise when pumping occurs in the anomalous dispersion regime [10]. Alternatively, the use of all-normal dispersion (ANDi) fibers based on the adjustment of group velocity dispersion (GVD) offers an opportunity to generate highly coherent, single-pulsed, stable SC spectra, where the broadening mechanism is mainly self-phase modulation (SPM) and optical wave breaking (OWB) [11, 12]. The coherence of the output SC thus is almost the same as that of the pump source, attributed to the fact that the SPM and OWB processes are self-seeded [8]. Therefore, SC spectra with better shot-to-shot coherence and spectral flatness over the bandwidth could be obtained when optical fibers are engineered in all-normal dispersion, and the single pulse preserved in the time domain is also essential for applications in time-resolved measurements and few-cycle pulse compression [13, 14].
Coherent SC generation that covers up to the near-infrared region based on ANDi microstructured fibers (MOFs) has been investigated numerically and experimentally [14–18]. However, the transmission loss beyond 2.7 μm and the relatively weak nonlinearity of commonly used silica glass tremendously limit the silica fibers reaching the MIR region [12, 19–22]. Chalcogenide (ChG) fibers have been demonstrated to be promising candidates due to their high intrinsic nonlinearity and low photon energies [14, 18, 23], and the long-wave transmission edge can be up to about 14 μm when selenide-based materials are used [24–27]. Compared to standard step-index fibers, MOFs, or photonic crystal fibers (PCFs), are more attractive because of their ability to adjust the waveguide dispersion so that material dispersion is compensated. Combining ruggedness, compactness, and excellent beam quality of fiber-based light sources, an ANDi profile is achievable in MOFs with enhanced nonlinear effects, controllable mode area, and desirable GVD properties through dispersion engineering [28]. Among all MOFs, all-solid microstructured cladding could avoid holey structure deformation and environmental gas impurities during thermal processing in fiber fabrication [29]. Recently, the generation of broadband SC spectra in the MIR region through all-solid MOFs has been demonstrated both experimentally [15, 16, 18, 30] and numerically [31–33]. Klimczak et al. experimentally demonstrated a MIR SC extending to 2.3 μm with a soft glass PCF made of boron-silicate glass and silicate glass, pumped with 75-fs pulses at 1550 nm [16]. Liu et al. experimentally reported a coherent MIR SC generation covering up to 3.3 μm based on a 2-cm-long AsSe2/As2S5 four-hole ChG MOF pumped by a 2.7 μm laser [15]. Ren et al. experimentally demonstrated a Ge12As24Se64/Ge10As24S66 MOF with an ultra-large mode area, generating MIR SC from 3.5 to 7.5 μm, pumped at 4 μm in the ANDi regime [30]. Yuan et al. experimentally reported a broadband coherent MIR SC generation up to 13.2 μm in an ANDi Te-based ChG MOF made from Ge20As20Se20Te40 and As2S3, under pumping at 5 μm [18]. Among the chalcogenide family, Ge11.5As24Se64.5 has gained considerable interest not only due to its relatively high nonlinearity (about 2.5 times that of As2S3), but also due to its higher thermal, optical, and chemical stability under intense illumination [34, 35]. Karim et al. numerically showed MIR SC spectral broadening extending beyond 15 μm in a Ge11.5As24Se64.5/Ge11.5As24S64.5 triangular-core fiber, pumped at 4 μm in the anomalous dispersion regime [31]. Huang designed a ChG MOF composed of hexagonal rings using As2Se3 and Ge11.5As24Se64.5, which supports SC generation from 3450 to 8015 nm when the fiber is pumped at 5 μm [32]. Medjouri et al. simulated a MIR SC with wavelengths ranging from 1.6 to 7 μm with an ANDi Ge15Sb15Se70/Ge20Se80 MOF, pumped with pulses of 50 fs at 3 μm [33].
In this work, we numerically demonstrate broadband and coherent MIR SC generation in a dispersion-engineered all-solid MOF using Ge11.5As24Se64.5 as the core embedded with low-refractive-index Ge11.5As24S64.5 rods in its cladding. The lasers can then be confined and propagated in the core region of the MOF obeying the guidance mechanism similar to that of conventional fibers. By optimizing structural parameters, ChG MOF with broad and flat all-normal dispersion profiles from 4 to 14 μm can be achieved, supporting the generation of broadband SC covering up to the transparency limit wavelength (∼14 μm) of the GeAsSe glass with perfect coherence when pumped by wavelength-tunable femtosecond lasers with peak powers of no more than 6 kW. The generalized nonlinear Schrödinger equation is used to model the spectral broadening, and the output bandwidth and coherence are studied when various pump pulse and fiber characteristics are applied. To the best of our knowledge, this is the broadest coherent SC generation in the ANDi MOF where the broadening mechanism is mainly SPM and OWB effects.
Concept and Fiber Structure
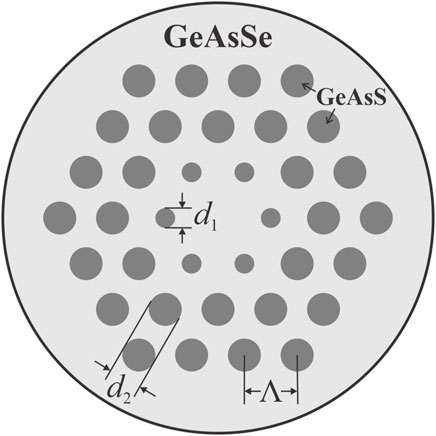
The schematic cross-section of the proposed all-chalcogenide MOF structure is depicted in Figure 1. In this study, we employed a three-ring hexagonal lattice all-solid MOF structure, which can be manufactured using the rod-in-tube drawing technique [36]. The gray regions denote low-index Ge11.5As24S64.5 glass rods, and the background region denotes high-index Ge11.5As24Se64.5 glass. The ChG MOF is modeled and optimized by varying the pitch
where
where c denotes the light speed in the vacuum. On the other hand, the imaginary part of the effective index
To study MIR SC generation in the ANDi regime, the pulse spectral evolution inside the proposed MOF is modeled by solving the generalized nonlinear Schrödinger equation (GNLSE) [7] including two-photon absorption (TPA) [40]:
The left-hand side of Eq. 5 models linear propagation effects, where
The coefficients
where
Angular brackets denote an ensemble average over independently generated pairs of SC spectra
Results and Discussion
Dispersion Engineering of Chalcogenide Fiber
The SC spectral evolution at the fiber output is significantly dependent on the dispersion optimization. To achieve coherent SC spectral broadening up to the MIR region, a flat GVD profile with a small magnitude spanning a wide wavelength range in the ANDi regime is a vital factor, which can be modified by varying the geometric parameters of the MOF [17]. To obtain suitable GVD curves for pumping in this regime, numerous simulations are carried out on the proposed MOF structure with variations in its pitch and rod diameters. Figures 2A–C illustrate the fundamental mode dispersion curves calculated from the mode effective index obtained by the CUDOS MOF Utilities package. The material dispersion curve of the core glass Ge11.5As24Se64.5 is also given as a reference, where the slope of the curve changes abruptly around 4 μm, and the zero dispersion of the material wavelength is located at approximately 7.1 μm. When the cladding region is embedded with Ge11.5As24S64.5 glass rods with a relatively low refractive index, the waveguide dispersion of the MOF can be significantly modified, and the ZDW of the fiber extends into the red spectral region. Figure 2A shows that for fixed rod diameters
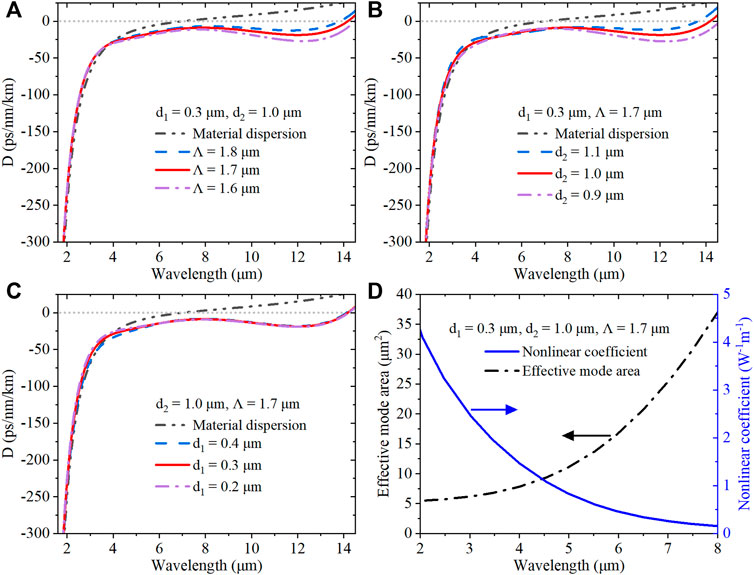
FIGURE 2. (A–C) Calculated material dispersion of GeAsSe glass and GVD characteristic curves of MOFs with various structural parameters. (D) Effective mode areas and their corresponding nonlinear coefficients for the MOF structure.
Broadband Coherent MIR Supercontinuum Generation
Pulse propagation in the proposed MOF is simulated using the split-step Fourier method to solve the GNLSE Eq. 5 through Python. Using the tunable pump source from 3 to 7 μm, the MIR SC spectral evolution in the ANDi regime is predicted using secant-shaped pulses of femtosecond duration in the MOFs with a low peak power of no more than 6 kW.
The spectral evolution on a logarithmic scale with the propagation distance in the fiber is shown in Figure 3A, where the pump pulse duration is 50 fs (FWHM) at 3 μm with a peak power of 1 kW. For a normal GVD pumping, the broadening process is initiated by the SPM, and the approximately symmetrical property is typical of what can be expected when SPM interacts with fiber’s normal dispersion [7]. The somewhat asymmetric SC spectral shapes are due to the influence of high-order dispersion, and the narrower spectrum bandwidth in the blue region is also the result of the much steeper GVD slope on this side of the pump as shown in Figure 2. The wave-breaking distance is introduced to calculate the propagation distance in fiber where the OWB starts to occur and spectral broadening begins to appear on both sides of the pump wavelength. For the secant-shaped pulse applied in our simulation, the estimated wave-breaking distance
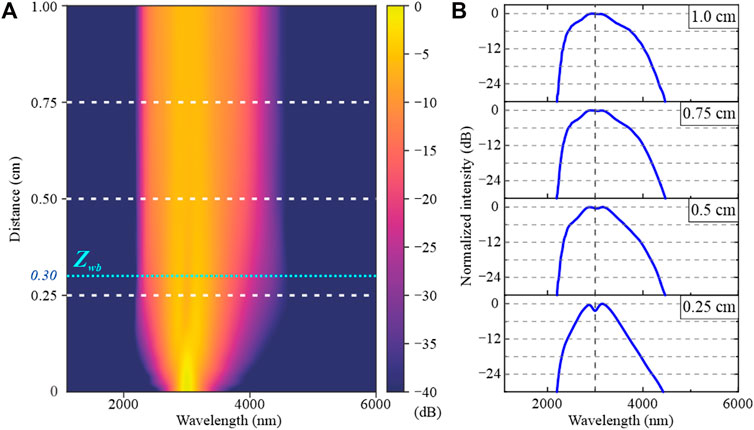
FIGURE 3. (A) Dependence of the spectrum evolution with the propagation distance. (B) Spectral profiles at different fiber propagation distances, with pump pulse wavelength at 3 μm marked as a vertical gray dashed line. The pump pulse duration and peak power are 50 fs and 1 kW, respectively.
The wave-breaking distance is 0.30 cm in this case as indicated in Figure 3A, which means that for fiber parameters and pumping conditions applied in our simulation, both OWB and SPM play a key role in the spectral broadening after 0.30 cm. Horizontal white dashed lines represent the fiber propagation distances where the spectral intensity profiles are investigated, as shown in Figure 3B, with every vertical interval divided by horizontal gray dashed lines representing a 6-dB variation in intensity. The pump pulse wavelength at 3 μm is marked as a vertical gray dashed line in Figure 3B. At a propagation distance of 0.25 cm, the spectrum bandwidth is narrow, and the peaks dominated by SPM are strong. After about 0.3 cm of propagation, sidelobes become apparent at both sides of the pump wavelength attributed to the effect of OWB, where the spectrum sidebands are obtained at the leading and trailing edges of the pulse by continually mixing the overlapping frequency components generated from SPM [11, 32]. Therefore, the spectral bandwidth is substantially maintained, and the spectral profile of the SC is well preserved during spectral broadening. At 0.5, 0.75, and 1.0 cm, the spectral profiles almost exhibit similar flatness and bandwidth, and a smoother profile is achieved with propagation. The spectral bandwidth with an intensity greater than −30 dB spans more than one octave, ranging from 2199 to 4465 nm.
The influence of pump pulse parameters on the spectral profiles is investigated to explore the spectral bandwidth and profiles of the generated SC. The spectral profiles of SC generation when pumping occurs at wavelengths tuning from 3 to 6 μm are shown in Figure 4A. The pulse FWHM and peak power are fixed at 50 fs and 1 kW, respectively. When pumping at 3 μm, the intensity in the short-wavelength region is slightly higher than that in the long-wavelength region due to the sharp increase in the magnitude of the dispersion below 3 μm, which generates an SC spectrum shifted toward the blue region. The spectral bandwidth with an intensity greater than −3 dB is 814 nm. As the pump wavelength moves further into the mid-infrared region, the spectral bandwidth becomes wider and more intensity is shifted toward the longer wavelength, and by combining a flat all-normal dispersion in this region, a spectral broadening with better smoothness is obtained. When pumping at 5 and 6 μm, the spectral bandwidth with an intensity greater than −3 dB achieves 1190 nm and 1180 nm, respectively. The relatively narrower 3-dB bandwidth when pumping occurs at 6 μm is due to the lower nonlinear coefficient and the smaller dispersion magnitude of the MOF at 6 μm, which induces more energy to be transferred to the far end of the spectrum by OWB. This process broadens the spectral bandwidth to 5.8 μm with an intensity greater than −30 dB when pumping at 6 μm. The impact of pump pulse duration on spectral profiles is investigated and shown in Figure 4B, when the pump pulse wavelength and peak power are fixed at 6 μm and 3 kW, respectively. In these cases, the broadest spectrum appears at the shortest pump duration of 50 fs. For longer pulse durations, a narrower bandwidth is generated with degraded flatness and smoothness, and peaks and dips emerge near the pump wavelength. This behavior can be attributed to the SPM effect at a longer pump pulse duration. As the wave-breaking distance is approximatively proportional to the pulse duration according to Eq. 9, OWB occurs later when longer pump pulses are employed, resulting in an SC spectrum with dips and peaks dominated by SPM. When the pump pulse with more peak power is applied, the SC spectrum becomes broader and extends to the transparency limit wavelength of the GeAsSe glass, as shown in Figure 4C, where the pulse wavelength and FWHM are fixed at 7 μm and 50 fs, respectively. By escalating pump pulse peak power from 3 to 6 kW, the spectra demonstrate better flatness and smoothness with increasing bandwidth. With higher peak power employed, more energy is transferred to new wavelengths at a broader spectral region due to the OWB effect. The spectral bandwidth with intensity above −30 dB achieves 9.8 μm, ranging from 3823 to 13577 nm, corresponding to more than 1.5 octaves. The 3-dB bandwidth is 2.7 μm, ranging from 5973 to 8695 nm. The generated broadband SC spectrum hence can be compressed to sub-cycle MIR pulses. Compared to previous works, including but not limited to [14–21, 32, 33], smooth SC spectra with a broader bandwidth are obtained from our proposed ANDi MOF with a relatively low pump peak power, based mainly on SPM and OWB effects. Such a broadband SC generation can be attributed to the combination of material nonlinearity and the optimized broad and flat all-normal dispersion profile. In all our simulations, the highest peak power density occurs when a 7 μm laser is applied with duration and peak power of 50 fs and 6 kW, respectively. Assuming the pump laser is focused on the MOF with a spot area the same as the mode area, which is 25.9 μm2 under 7 μm pumping, the peak power density is 23 GW/cm2, which is considered acceptable according to previous research [43, 46].
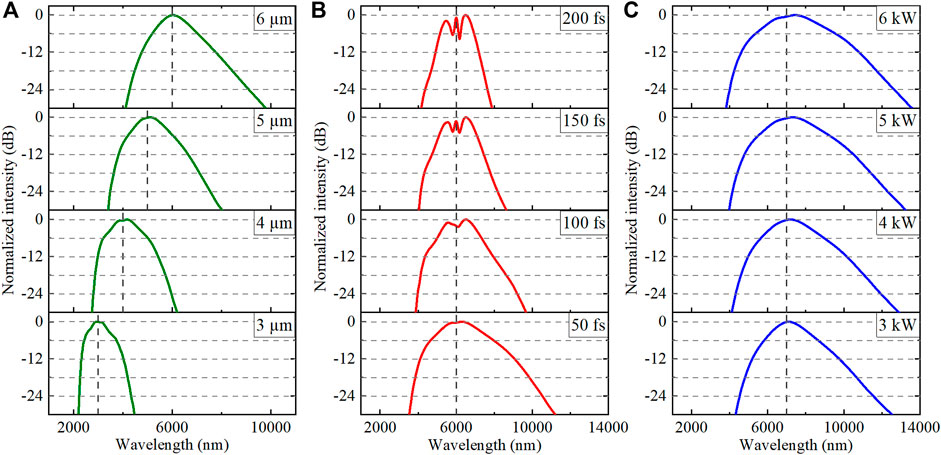
FIGURE 4. Supercontinuum generation in the 1-cm-long MOF with (A) pump wavelength from 3 to 6 μm, with a pulse FWHM of 50 fs and peak power of 1 kW; (B) pump pulse FWHM from 50 to 200 fs, with a pulse peak power of 3 kW at 6 μm; (C) pump pulse peak power from 3 to 6 kW, with a pulse FWHM of 50 fs at 7 μm. Pump pulse wavelengths are marked as vertical gray dashed lines.
The influence of the fiber parameters is also investigated since the deviation in geometric parameters usually occurs during fiber fabrication. Figures 5A–C show the SC output from the fibers with different pitch and rod diameters mentioned in Figure 2, where the pump pulse wavelength, FWHM, and peak power are fixed at 7 μm, 50 fs, and 6 kW, respectively. With a pitch deviation of
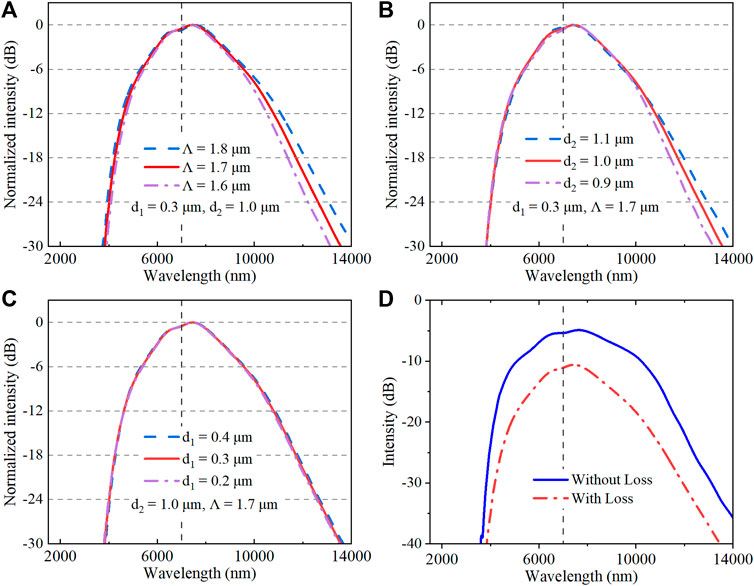
FIGURE 5. (A–C) Influence of the geometric parameters of the fiber on the spectral profiles. (D) SC generated with and without introducing transmission loss. The pump pulse wavelength (marked as vertical gray dashed lines), FWHM, and peak power are 7 μm, 50 fs, and 6 kW, respectively.
The coherence property of the SC generated is investigated according to Eq. 8 when the ChG MOF is pumped at 7 μm with 50 fs FWHM and 6 kW peak power. The SC spectrum is highly coherent over a broad bandwidth as shown in Figure 6, where zero denotes incoherent, and one is coherent on the scale bar. An ensemble average of over 200 pairs of independent SC spectra generated from input pulses with random quantum noise for the MOF structure of
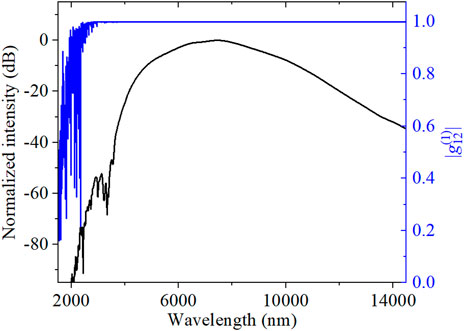
FIGURE 6. SC spectrum pumped at 7 μm with 50 fs FWHM and 6 kW peak power and its coherence property in all-chalcogenide MOF.
Conclusion
In this work, we propose a dispersion-engineered all-chalcogenide microstructured fiber, which could be fabricated using the rod-in-tube method. The optimized ChG fiber exhibits a broad and flat all-normal dispersion ranging from 4 to 14 μm, supporting the generation of a flat-top mid-infrared SC spectrum spanning over an octave. A highly coherent broadband SC in the range from 3.8 μm to the transparency limit of the material is generated from a 1-cm-long all-chalcogenide MOF pumped by a 7 μm laser. The influence of pump pulse wavelength, duration and peak power, and fiber geometric parameters on SC spectral profiles is systematically investigated. The results indicate that SC spectra from the near-infrared to MIR region with sufficient flatness can be obtained when the pump wavelength is tuned between 3 and 7 μm. The spectral bandwidth with an intensity greater than −3 dB and −30 dB achieves 2.7 and 9.8 μm when pumping at 7 μm, with the latter corresponding to more than 1.5 octaves. The broadband coherent SC spectra thus support compression to sub-cycle pulses at the MIR region. This work reveals the potential application of coherent, broadband laser sources in frequency metrology, optical coherence tomography, biomedical imaging, and few-cycle pulse compression.
Data Availability Statement
The raw data supporting the conclusion of this article will be made available by the authors, without undue reservation.
Author Contributions
KX designed the fiber structure and simulated and analyzed the supercontinuum spectra; YY competed with the Python codes throughout the simulation; RM participated in the discussion of the mechanism of the broadband SC generation. All authors approve of the final version and agree to be responsible for all aspects of the work.
Funding
This work was supported by grants from the Basic and Applied Basic Research Foundation of Guangdong Province (2021A1515110310) and the Research Platform and Project of Guangdong Province (2021KQNCX268).
Conflict of Interest
The authors declare that the research was conducted in the absence of any commercial or financial relationships that could be construed as a potential conflict of interest.
The handling editor SK declared a past co-authorship with the author RM.
Publisher’s Note
All claims expressed in this article are solely those of the authors and do not necessarily represent those of their affiliated organizations, or those of the publisher, the editors and the reviewers. Any product that may be evaluated in this article, or claim that may be made by its manufacturer, is not guaranteed or endorsed by the publisher.
References
1. Sorokina IT, Vodopyanov KL. Solid-State Mid-infrared Laser Sources. Berlin, Heidelberg: Springer (2003).
2. Grassani D, Tagkoudi E, Guo H, Herkommer C, Yang F, Kippenberg TJ, et al. Mid Infrared Gas Spectroscopy Using Efficient Fiber Laser Driven Photonic Chip-Based Supercontinuum. Nat Commun (2019) 10(1):1553. doi:10.1038/s41467-019-09590-3
3. Jahromi KE, Pan Q, Høgstedt L, Friis SMM, Khodabakhsh A, Moselund PM, et al. Mid-infrared Supercontinuum-Based Upconversion Detection for Trace Gas Sensing. Opt Express (2019) 27(17):24469–80. doi:10.1364/oe.27.024469
4. Zheng S, Bai Y, Xu Z, Liu P, Ni G. Optical Coherence Tomography for Three-Dimensional Imaging in the Biomedical Field: A Review. Front Phys (2021) 9:744346. doi:10.3389/fphy.2021.744346
5. Schliesser A, Picqué N, Hänsch TW. Mid-infrared Frequency combs. Nat Photon (2012) 6(7):440–9. doi:10.1038/nphoton.2012.142
6. Hermes M, Morrish RB, Huot L, Meng L, Junaid S, Tomko J, et al. Mid-IR Hyperspectral Imaging for Label-free Histopathology and Cytology. J Opt (2018) 20(2):023002. doi:10.1088/2040-8986/aaa36b
8. Dudley JM, Genty G, Coen S. Supercontinuum Generation in Photonic crystal Fiber. Rev Mod Phys (2006) 78(4):1135–84. doi:10.1103/RevModPhys.78.1135
9. Dudley JM, Coen S. Coherence Properties of Supercontinuum Spectra Generated in Photonic Crystal and Tapered Optical Fibers. Opt Lett (2002) 27(13):1180–2. doi:10.1364/ol.27.001180
10. Corwin KL, Newbury NR, Dudley JM, Coen S, Diddams SA, Weber K, et al. Fundamental Noise Limitations to Supercontinuum Generation in Microstructure Fiber. Phys Rev Lett (2003) 90(11):113904. doi:10.1103/PhysRevLett.90.113904
11. Tomlinson WJ, Stolen RH, Johnson AM. Optical Wave Breaking of Pulses in Nonlinear Optical Fibers. Opt Lett (1985) 10(9):457–9. doi:10.1364/ol.10.000457
12. Heidt AM. Pulse Preserving Flat-Top Supercontinuum Generation in All-normal Dispersion Photonic crystal Fibers. J Opt Soc Am B (2010) 27(3):550–9. doi:10.1364/josab.27.000550
13. Gu X, Xu L, Kimmel M, Zeek E, O’Shea P, Shreenath AP, et al. Frequency-resolved Optical Gating and Single-Shot Spectral Measurements Reveal fine Structure in Microstructure-Fiber Continuum. Opt Lett (2002) 27(13):1174–6. doi:10.1364/ol.27.001174
14. Xing S, Kharitonov S, Hu J, Brès C-S. Linearly Chirped Mid-infrared Supercontinuum in all-normal-dispersion Chalcogenide Photonic crystal Fibers. Opt Express (2018) 26(15):19627–36. doi:10.1364/oe.26.019627
15. Liu L, Cheng T, Nagasaka K, Tong H, Qin G, Suzuki T, et al. Coherent Mid-infrared Supercontinuum Generation in All-Solid Chalcogenide Microstructured Fibers with All-normal Dispersion. Opt Lett (2016) 41(2):392–5. doi:10.1364/ol.41.000392
16. Klimczak M, Siwicki B, Skibiński P, Pysz D, Stępień R, Heidt A, et al. Coherent Supercontinuum Generation up to 2.3 μm in All-Solid Soft-Glass Photonic crystal Fibers with Flat All-normal Dispersion. Opt Express (2014) 22(15):18824–32. doi:10.1364/oe.22.018824
17. Karim MR, Ahmad H, Rahman BMA. All-Normal Dispersion Chalcogenide PCF for Ultraflat Mid-infrared Supercontinuum Generation. IEEE Photon Technol Lett (2017) 29(21):1792–5. doi:10.1109/lpt.2017.2752214
18. Yuan Y, Yang P, Peng X, Cao Z, Ding S, Zhang N, et al. Ultrabroadband and Coherent Mid-infrared Supercontinuum Generation in All-normal Dispersion Te-Based Chalcogenide All-Solid Microstructured Fiber. J Opt Soc Am B (2020) 37(2):227–32. doi:10.1364/josab.37.000227
19. Heidt AM, Hartung A, Bosman GW, Krok P, Rohwer EG, Schwoerer H, et al. Coherent Octave Spanning Near-Infrared and Visible Supercontinuum Generation in All-normal Dispersion Photonic crystal Fibers. Opt Express (2011) 19(4):3775–87. doi:10.1364/oe.19.003775
20. Hooper LE, Mosley PJ, Muir AC, Wadsworth WJ, Knight JC. Coherent Supercontinuum Generation in Photonic crystal Fiber with All-normal Group Velocity Dispersion. Opt Express (2011) 19(6):4902–7. doi:10.1364/oe.19.004902
21. Sukhoivanov IA, Iakushev SO, Shulika OV, Andrade-Lucio JA, Díez A, Andrés M. Supercontinuum Generation at 800 Nm in All-normal Dispersion Photonic crystal Fiber. Opt Express (2014) 22(24):30234–50. doi:10.1364/oe.22.030234
22. Su N, Li P-X, Xiao K, Wang X-X, Liu J-G, Shao Y, et al. Supercontinuum Generation in Seven-Core Photonic crystal Fiber Pumped by a Broadband Picosecond Pulsed Fiber Amplifier. Chin Phys. B (2017) 26(7):074210. doi:10.1088/1674-1056/26/7/074210
23. Yin K, Zhang B, Yao J, Cai Z, Liu G, Hou J. Toward High-Power All-Fiber 2-5 μm Supercontinuum Generation in Chalcogenide Step-Index Fiber. J Lightwave Technol (2017) 35(20):4535–9. doi:10.1109/jlt.2017.2749268
24. Petersen CR, Møller U, Kubat I, Zhou B, Dupont S, Ramsay J, et al. Mid-infrared Supercontinuum Covering the 1.4-13.3 μm Molecular Fingerprint Region Using Ultra-high NA Chalcogenide Step-index Fibre. Nat Photon (2014) 8(11):830–4. doi:10.1038/nphoton.2014.213
25. Cheng T, Nagasaka K, Tuan TH, Xue X, Matsumoto M, Tezuka H, et al. Mid-infrared Supercontinuum Generation Spanning 2.0 to 15.1 μm in a Chalcogenide Step-index Fiber. Opt Lett (2016) 41(9):2117–20. doi:10.1364/ol.41.002117
26. Diouf M, Wague A, Zghal M. Numerical Investigation of an Ultra-broadband Coherent Mid-infrared Supercontinuum in a Chalcogenide AsSe2-As2S5 Multimaterial Photonic crystal Fiber. J Opt Soc Am B (2019) 36(2):A8–A14. doi:10.1364/josab.36.0000a8
27. Shiryaev VS, Churbanov MF. Recent Advances in Preparation of High-Purity Chalcogenide Glasses for Mid-IR Photonics. J Non-Crystalline Sol (2017) 475:1–9. doi:10.1016/j.jnoncrysol.2017.09.021
28. Feng X, Monro T, Petropoulos P, Finazzi V, Hewak D. Solid Microstructured Optical Fiber. Opt Express (2003) 11(18):2225–30. doi:10.1364/OE.11.002225
29. Toupin P, Brilland L, Mechin D, Adam J-L, Troles J. Optical Aging of Chalcogenide Microstructured Optical Fibers. J Lightwave Technol (2014) 32(13):2428–32. doi:10.1109/jlt.2014.2326461
30. Ren H, Qi S, Hu Y, Han F, Shi J, Feng X, et al. All-solid Mid-infrared Chalcogenide Photonic Crystal Fiber with Ultralarge Mode Area. Opt Lett (2019) 44(22):5553–6. doi:10.1364/ol.44.005553
31. Karim MR, Ahmad H, Rahman BMA. Design and Modeling of Dispersion-Engineered All-Chalcogenide Triangular-Core Fiber for Mid-infrared-region Supercontinuum Generation. J Opt Soc Am B (2018) 35(2):266–75. doi:10.1364/josab.35.000266
32. Huang C, Bi W, Zheng B, Zhang C, Wang J, Zheng S. Ring-shaped Microstructured Chalcogenide Optical Fiber for Octave-Spanning Flat-Top Mid-infrared Supercontinuum Generation. Appl Opt (2020) 59(18):5391–8. doi:10.1364/ao.391564
33. Medjouri A, Abed D. Modelling of All-Chalcogenide All-normal Dispersion Photonic Crystal Fiber for Ultraflat Mid-infrared Supercontinuum Generation. Opt Quant Electron (2021) 53(7):399. doi:10.1007/s11082-021-03027-2
34. Bulla DAP, Wang RP, Prasad A, Rode AV, Madden SJ, Luther-Davies B. On the Properties and Stability of Thermally Evaporated Ge-As-Se Thin Films. Appl Phys A (2009) 96(3):615–25. doi:10.1007/s00339-009-5293-0
35. Ma P, Choi D-Y, Yu Y, Gai X, Yang Z, Debbarma S, et al. Low-loss Chalcogenide Waveguides for Chemical Sensing in the Mid-infrared. Opt Express (2013) 21(24):29927–37. doi:10.1364/oe.21.029927
36. Cheng T, Kanou Y, Xue X, Deng D, Matsumoto M, Misumi T, et al. Mid-infrared Supercontinuum Generation in a Novel AsSe2-As2S5 Hybrid Microstructured Optical Fiber. Opt Express (2014) 22(19):23019–25. doi:10.1364/oe.22.023019
37. White TP, Kuhlmey BT, McPhedran RC, Maystre D, Renversez G, de Sterke CM, et al. Multipole Method for Microstructured Optical Fibers I Formulation. J Opt Soc Am B (2002) 19(10):2322–30. doi:10.1364/josab.19.002322
38. Kuhlmey BT, White TP, Renversez G, Maystre D, Botten LC, de Sterke CM, et al. Multipole Method for Microstructured Optical Fibers II Implementation and Results. J Opt Soc Am B (2002) 19(10):2331–40. doi:10.1364/josab.19.002331
39. Kuhlmey B, Renversez G, Maystre D. Chromatic Dispersion and Losses of Microstructured Optical Fibers. Appl Opt (2003) 42(4):634–9. doi:10.1364/ao.42.000634
40. Karim MR, Rahman BMA, Agrawal GP. Dispersion Engineered Ge11.5As24Se64.5 Nanowire for Supercontinuum Generation: A Parametric Study. Opt Express (2014) 22(25):31029–40. doi:10.1364/oe.22.031029
41. Wang T, Gai X, Wei W, Wang R, Yang Z, Shen X, et al. Systematic Z-Scan Measurements of the Third Order Nonlinearity of Chalcogenide Glasses. Opt Mater Express (2014) 4(5):1011–22. doi:10.1364/ome.4.001011
42. Blow KJ, Wood D. Theoretical Description of Transient Stimulated Raman Scattering in Optical Fibers. IEEE J Quan Electron. (1989) 25(12):2665–73. doi:10.1109/3.40655
43. Zhang M, Li L, Li T, Wang F, Tian K, Tao H, et al. Mid-infrared Supercontinuum Generation in Chalcogenide Fibers with High Laser Damage Threshold. Opt Express (2019) 27(20):29287–96. doi:10.1364/OE.27.029287
44. Kubat I, Bang O. Multimode Supercontinuum Generation in Chalcogenide Glass Fibres. Opt Express (2016) 24(3):2513–26. doi:10.1364/oe.24.002513
45. Anderson D, Desaix M, Lisak M, Quiroga–Teixeiro ML. Wave Breaking in Nonlinear-Optical Fibers. J Opt Soc Am B (1992) 9(8):1358–61. doi:10.1364/josab.9.001358
Keywords: nonlinear optics and fibers, dispersion, mid-infrared supercontinuum generation, microstructured fibers, chalcogenide glasses
Citation: Xiao K, Ye Y and Min R (2022) Broadband Coherent Mid-Infrared Supercontinuum Generation in All-Chalcogenide Microstructured Fiber With All-Normal Dispersion. Front. Phys. 10:933010. doi: 10.3389/fphy.2022.933010
Received: 30 April 2022; Accepted: 03 June 2022;
Published: 08 July 2022.
Edited by:
Santosh Kumar, Liaocheng University, ChinaReviewed by:
Dharmendra Kumar, Madan Mohan Malaviya University of Technology, IndiaMingjie Zhang, Jinan University, China
Copyright © 2022 Xiao, Ye and Min. This is an open-access article distributed under the terms of the Creative Commons Attribution License (CC BY). The use, distribution or reproduction in other forums is permitted, provided the original author(s) and the copyright owner(s) are credited and that the original publication in this journal is cited, in accordance with accepted academic practice. No use, distribution or reproduction is permitted which does not comply with these terms.
*Correspondence: Kun Xiao, eGlhb2t1bkBibnUuZWR1LmNu
 Kun Xiao