 Ganshang Si
 Jiaxiang Liu1
 Zhengang Li
94% of researchers rate our articles as excellent or good
Learn more about the work of our research integrity team to safeguard the quality of each article we publish.
Find out more
ORIGINAL RESEARCH article
Front. Phys., 05 July 2022
Sec. Optics and Photonics
Volume 10 - 2022 | https://doi.org/10.3389/fphy.2022.930007
This article is part of the Research TopicState-of-the-Art Laser Spectroscopy and its Applications : Volume IIView all 51 articles
Raman spectroscopy is widely used in many fields with the advantages of simultaneous species detection and molecular fingerprint characteristics, but the low detection sensitivity limits its further development, especially for highly scattering or turbid mediums. In this consideration, a new method called quartz tube enhanced Raman scattering spectroscopy was proposed for the first time in this paper. A quartz tube was inserted into the powder sample to improve the coupling of light into the medium and increase the interaction volume of the laser with the sample (“volume-excitation”), multiple scattering of the light within the turbid medium resulted in an increased Raman signal. In this paper, the effect of different sizes of quartz tubes on the sensitivity enhancement was studied. The results show that the enhancement factor of the signal intensity was nearly 5.37 (the Raman signal of HCO3−) compared to traditional Raman spectroscopy technology. Furthermore, the method was successfully applied to improve the Raman signal intensity of the mixed sample (1:5, m (PO43−):m (HCO3−)) and detect the baking soda powder buried under a 6 mm thick layer of potassium dihydrogen phosphate powder. The results show that the technology will open a new way for the quantitative analysis and detection of powder samples.
In recent years, laser spectroscopy technology has made great progress, and its application fields have been continuously expanded [1–3]. With the most significant advantages such as simplicity, high chemical specificity, multicomponent and nondestructive detection, spectroscopy has been used in many fields [4], e.g., food adulteration [5], hazardous chemical detection [6], and drug analysis [7]. However, the Raman-scattering signal was very weak, which has an intensity lower than (10–6) that of the excitation [8]. Therefore, approaches to enhance Raman scattering signals are always important to improve and realize related detection techniques. At present, the methods to improve the detection sensitivity mainly include UV resonance Raman spectroscopy (UV-RRS) [9], surface-enhanced Raman scattering (SERS) [10, 11], and tip-Enhanced Raman Spectroscopy (TERS) [12]. These methods were mainly developed for gas or liquid samples, and they are almost useless for powder samples. Thus, it is meaningful to explore new methods to enhance the Raman detection sensitivity for powder samples.
Many studies have been involved in approaches to improve the powder detection sensitivity of Raman spectroscopy. Mastousek et al. [13] suggested using a dielectric filter to selectively return reflected laser photons back to the samples. This technique provided a 6 times enhancement of the Raman signal, but the signal-to-noise ratio was only 2 times for powder samples. Anupam K et al. [14] suggested a simple procedure improving detection limits for micro-Raman by producing micro-cavity in a reflecting metal substrate. Peter J. Larkin et al. [15] proposed increasing the path of action between the laser and the sample by drilling a conical/cylindrical hole in the tablet, thereby provided 3–5 times enhancement of Raman signal and 2 times increase of the accuracy. Lohumi S et al. [16] proposed a mirror was used to improve the detection sensitivity of Raman imaging spectroscopy, which increased the Raman signal intensity of powder samples by 2 times. Besides, it verified the feasibility of the technique used for food adulteration in the paper. Lednev V N et al. [17] suggested using a high-energy laser to act on the powder sample to produce a laser crater. Furthermore, using another low-energy laser to excite the Raman signal. The results showed that the detection sensitivity could be enhanced nearly 14 times. Besides, this research group optimized the experimental parameters, including laser wavelength, laser energy, particle size distribution, etc [18]. From the above analysis, the last technique was the better among those methods, but the high energy could damage the samples. In addition, it was difficult to detect deep target substances with the powder state for traditional Raman spectroscopy, because of the ability limitation of light penetration [19, 20]. At present, Transmission Raman spectroscopy (TRS) [21] and Spatially-offset Raman spectroscopy (SORS) [22] were representative and mature techniques, with commercial instruments in pharmaceuticals and other industries to chemically analyze powder samples. However, the TRS and SORS may have some disadvantages in some applications. Regarding SORS, the optimal spatial offset distance needs to be found for every detection. Furthermore, the packaging is easily damaged because of the high-power laser density. Regarding TRS, the sample needs to be completely taken out before the detection. In addition, the laser light source and detector have opposite positions. it is inconvenient that the portable device was realized.
As mentioned above, some methods have been used to improve the detection sensitivity for powder samples. To further explore a simple but effective method, quartz tube enhanced Raman spectroscopy was proposed in this paper. The feasibility of the technique was demonstrated by combining theoretical analysis and experimental research. The advantages of this method can be briefly summarized. First, the method has a simple structure and high signal collection efficiency. Second, the depth and position of detection can be flexibly changed according to requirements by this technology. Third, it can easily be extended to the fluorescence spectrum detection of powder samples.
The power emitted by a Raman line of powder material is given by the product of the effective volume of light interacting with the sample, the number density of the emitting molecules, the Raman cross-section for that line, the laser intensity and the excited volume, etc. this is given by [23]:
Where
Kubelka-Munk theory in a one-dimensional approximation could be used to study the coupling of laser radiation into turbid samples [19, 24]. For thicker samples with an infinitely wide slab medium of thickness, only a small fraction of laser radiation will reach the target layer buried deeply in turbid media. Therefore, traditional Raman spectroscopy technology has lower detection sensitivity. In addition, it is difficult to detect the information of powder samples with deep layers and low concentrations for traditional method. About the proposed methods was shown in Figure 1A, a quartz tube was inserted into the powder sample to improve the coupling of light into the medium and prevent light energy loss, and multiple scattering of the light within the turbid medium. It is obvious from Figure 1B that more photons interacts with the sample and has a deeper penetration depth compared with the traditional method. Therefore, it can improve the detection sensitivity and detect deep-layer samples.
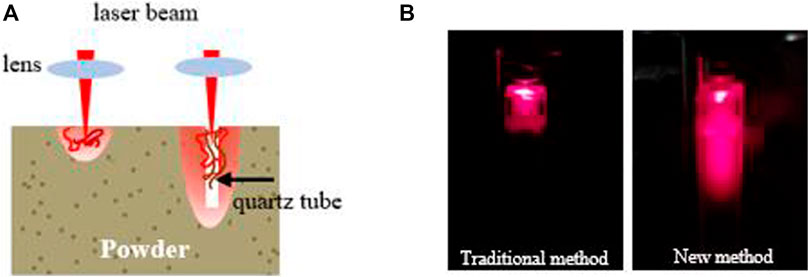
FIGURE 1. (A) Diagram of two types of detection methods: traditional and Quartz tube enhanced Raman spectroscopy technology and (B) Image of scattering from a powder sample acquired using a cell phone camera: traditional and Quartz tube enhanced Raman spectroscopy technology.
Quartz glass has a silicon dioxide content of up to 99.99% and better optical properties than other materials. It has high transmission in the wavelength range of 200–1,000 nm, which involves ultraviolet to near-infrared light. It has excellent physical properties, including high-temperature resistance and good chemical stability [25]. Therefore, the quartz tube was selected as a medium to guide the light in this study. Figure 2 shows that the transmission of quartz is up to 93% in our target wavelength range of 785–1,000 nm.
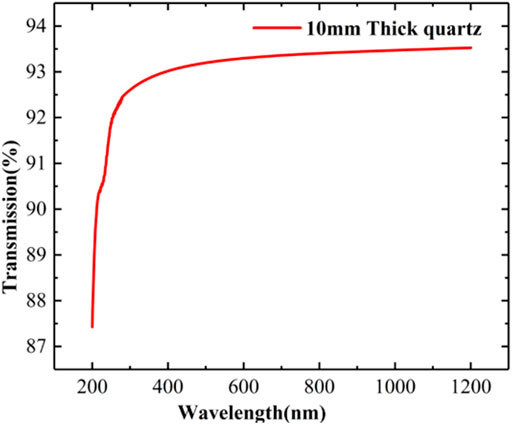
FIGURE 2. Diagram of the transmittance curve of 10 mm thick quartz [26].
A quartz tube enhanced Raman spectroscopy detection setup was built based on a 785 nm Raman probe (focal length of 7.5 mm). A diode-pumped 785 nm laser with an average power of 300 mW was used as the excitation source. A spectrometer (Ocean Optics-QEPro) was used to collect the Raman signal, and the main specifications were as follows: the spectral resolution is 0.91 nm, and the wavelength range is 650–1,000 nm. A cuvette was used to hold the sample; then, a quartz tube was inserted into the powder sample. The experimental setup and schematic diagram of the method are shown in Figure 3. Two groups of quartz tubes (a total of eight types) were used in the experiment; the lengths were 10 and 20 mm, and the inner diameter and outer diameter were 0.6 × 0.9, 1 × 1.3, 1.65 × 1.95, and 2 × 2.4 (mm) respectively. Baking soda powder (NaHCO3, ≥99%) and potassium dihydrogen phosphate powder (KH2PO4, ≥99.5%) were used as samples in the experiment.
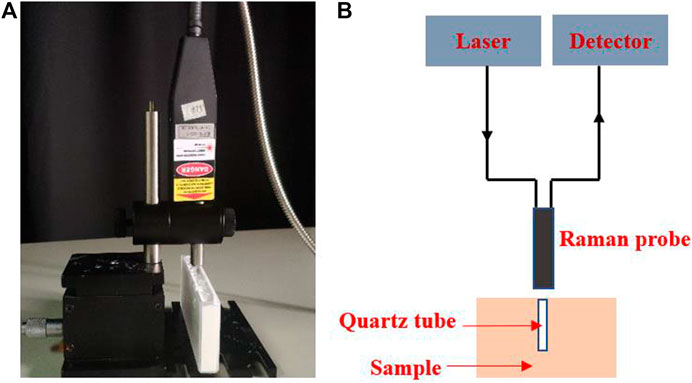
FIGURE 3. Schematic of the quartz tube enhanced Raman spectroscopy system. (A) Experimental setup; (B) Schematic diagram.
To prove the signal enhancement effect and practicability of quartz tube Raman spectroscopy technology for powder samples, three experiments were performed in this study. First, the Raman signal enhancement effect of the method for powder samples was studied using eight different sizes of quartz tubes. Second, quartz enhanced Raman spectroscopy technology was used to detect mixed powders. A mixed sample of baking soda and potassium dihydrogen phosphate powder (1:5, weight ratio) was detected by proposed method. Third, we verified the feasibility of this technology for detecting samples buried under powder. The baking soda powder was placed under a powder sample of potassium dihydrogen phosphate of approximately 6 mm thickness and was detected by Raman probe with a quartz tube (20 × 1.00 × 1.30 mm).
The first step of the data collection was to obtain the background spectra; for the analysis, the dark spectra were subtracted from the raw spectra. The spectral collection parameters were set as follows: the exposure time was 3 s, and the accumulated cycle time was 1. The Raman original spectra of baking soda powder were obtained using traditional Raman spectroscopy technology as shown in Figure 4A. HCO3− has three Raman peaks, at 689 cm−1, 1,043 cm−1 and 1,275 cm−1. The strongest intensity was located at 1,043 cm−1 among the three Raman peaks. Therefore, the Raman peak was used as a reference in the analysis. The Partial Least Squares, (PLS) data processing method was used to eliminate the influence of the baseline [27]. The spectrum range was 950–1,100 cm−1, as shown in Figure 4B.
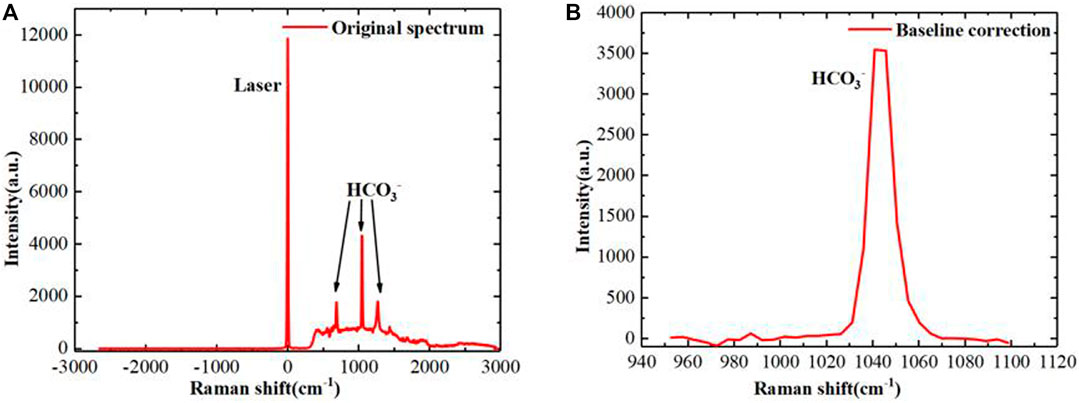
FIGURE 4. Raman spectrum of baking soda. (A) original spectrum; (B) Raman spectrum of the baseline correction.
The influence of different quartz tubes on the signal enhancement effect was studied by comparing it with the traditional method. The data processing method was identical to the aforementioned method. The enhancement factors of different sizes of quartz tubes are shown in Figure 5. The amplitude ratio of Raman bands (1,043 cm−1 at HCO3−) after background correction is defined as enhancement factor.
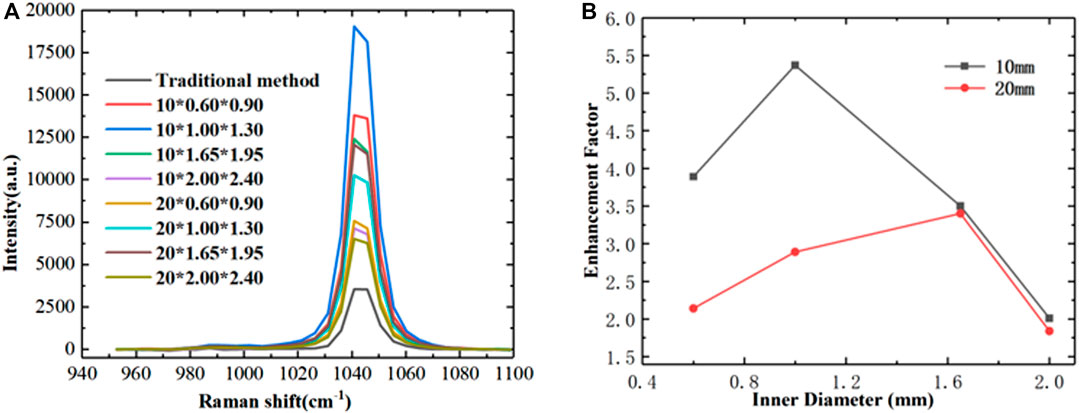
FIGURE 5. Enhancement effect of different sizes of quartz tubes. (A) Raman spectrum of soda powder using different quartz tubes; (B) Enhancement factors of different quartz tubes.
The quartz tubes of different sizes have obvious enhancements for powder samples as shown in Figure 5; Table 1. Compared to traditional Raman spectroscopy, the minimum enhancement factor was 1.84 (20*2.00*4.00 mm), and the maximum factor was up to 5.37 (10*1.00*1.30 mm). This result shows that quartz tube enhanced Raman spectroscopy technology has obvious advantages in the detection of powder samples and significantly improves the sensitivity of Raman spectra. For quartz tubes with the same length (10 or 20 mm), the signal enhancement factor does not linearly increase with increasing core diameter. In addition, the 20-mm-long quartz tube had a lower signal enhancement factor than the 10-mm-long tube.
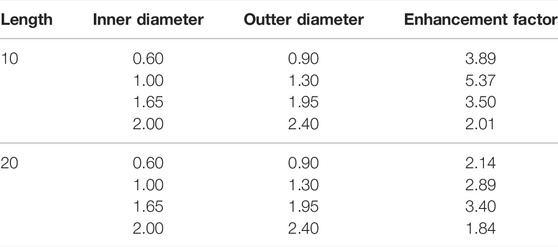
TABLE 1. Enhancement effect of Raman signals with different sizes of quartz tubes (mm).
An explanation of the above experimental phenomenon can be given as follows. The quartz tube enhanced Raman scattering spectroscopy method can be decomposed into two processes. First, the laser beam is coupled to the bottom of the quartz tube and interacts with the sample to generate the Raman signal. Most of the laser energy will be reflected during this process [24]. Second, the reflected laser interacts with the powder sample again to generate a Raman signal during the propagation process and collected by the device. This model of this method is similar to transmission Raman spectroscopy technology [19]. About the first process, it is obvious that the Raman signals generated by quartz tubes of different lengths are the same. However, the loss of the Raman signal of quartz tubes with a length of 20 mm more than 10 mm in the propagation process. Regarding the second process, the Raman signal intensity will first increase and then decrease with increasing quartz tube length. Based on the above analysis, it is easy to understand that the signal enhancement factor of quartz tubes of each size with a length of 20 mm was lower than that of tubes 10-mm-long.
To demonstrate the ability of quartz tube enhanced Raman spectroscopy to detect the mixed samples, soda and potassium dihydrogen phosphate powder at a ratio of 5:1 (weight ratio) was prepared. A quartz tube (10 × 1 × 1.3 mm) was fully inserted into the mixed powder sample; then, the Raman probe was used to detect the Raman signals. Two methods were used to collect the spectrum of the same sample, and the spectra in the range of 800–1,150 cm−1 were processed to eliminate the baseline. The results are shown in Figure 6.
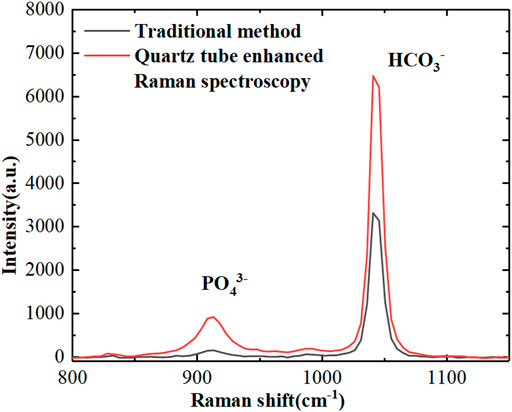
FIGURE 6. Results comparison of quartz tube enhanced Raman spectroscopy and traditional Raman spectroscopy for mixed samples (1:5, m (PO43-):m (HCO3−)).
For the mixed sample, the Raman signal intensity using the proposed method has significantly increased compared to the traditional method from the above results. For traditional Raman spectroscopy technology, it was difficult to identify the spectral peaks because the signal intensity of PO43− (913 cm−1) was quite low. However, for quartz tube enhanced Raman spectroscopy, there was a significant enhancement of Raman signal intensity, and the Raman signals of PO43− and HCO3− were clear. In addition, the two samples had different enhancement factors: the HCO3− enhancement factor was 2, but the Raman signal of PO43− enhancement was nearly 4 times. The reason for this result was that the different particle sizes, Raman scattering cross-sections and compactness of the mixed sample cause different enhancement factors. This result shows that quartz tube enhanced Raman spectroscopy technology has obvious advantages in the detection of mixed powder samples.
To demonstrate the ability of the proposed method to detect buried samples, a related experiment was performed. A cuvette with dimensions of 10 × 10 × 50 mm was used to hold the sample in the experiment. The depth of soda powder was approximately 44 mm at the bottom, and the depth of potassium dihydrogen phosphate powder was approximately 6 mm at the top. Two types of methods were used to detect the prepared sample, and the experimental results were further analyzed. A quartz tube (20 × 1 × 1.3 mm) was fully inserted into the prepared powder sample; then, the Raman probe was used to detect the Raman signals. The original spectra are processed to eliminate the baseline (range: 750–1,150 cm−1), and the results are shown in Figure 7.
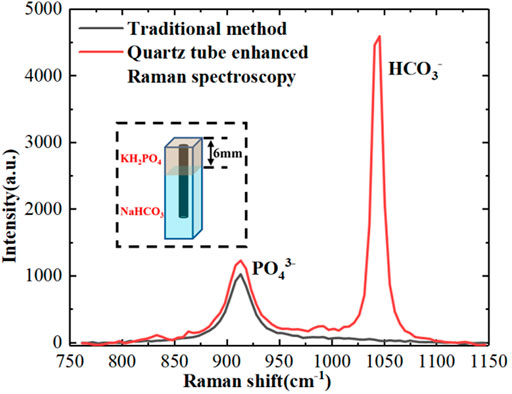
FIGURE 7. Results comparison of quartz tube enhanced Raman spectroscopy and traditional Raman spectroscopy for powder samples with deep layers.
The results show that it was impossible to detect the Raman signal of HCO3− at the bottom using traditional Raman spectroscopy technology due to the limited laser penetration ability in the powder sample. However, the Raman signal of HCO3− was clear using quartz tube enhanced Raman spectroscopy, because the laser through the quartz tube contacted the buried sample in the deep layer. Therefore, the Raman signal of HCO3− (1,043 cm−1) could be clearly observed, and the Raman signal of PO43− was also enhanced. The experimental results show that quartz enhanced Raman spectroscopy technology has obvious effects on the detection target powder with the deep layer.
In summary, quartz tube enhancement Raman spectroscopy technology was reported for the first time in this paper. The influence of different parameters of quartz tubes on Raman signal enhancement was studied. The results show that compared with traditional Raman spectroscopy technology, the maximum enhancement factor of quartz enhancement technology could reach 5.37-fold. In addition, the feasibility of the technology to detect mixed powder and target samples buried in deep layers was validated using related experiments. As a whole, this technology will play an important role in food safety, hazardous chemical detection, drug analysis, etc., expanding the further development of Raman spectroscopy technology.
The original contributions presented in the study are included in the article/Supplementary Material; further inquiries can be directed to the corresponding author.
GS, JL, and YF planned and supervised the experiments, processed the raw data, and wrote and revised the manuscript. GS, ZL, and ZN advised on data processing. All authors contributed to the article and approved the submitted version.
This work was supported by the National Natural Science Foundation of China (61875207).
The authors declare that the research was conducted in the absence of any commercial or financial relationships that could be construed as a potential conflict of interest.
All claims expressed in this article are solely those of the authors and do not necessarily represent those of their affiliated organizations, or those of the publisher, the editors and the reviewers. Any product that may be evaluated in this article, or claim that may be made by its manufacturer, is not guaranteed or endorsed by the publisher.
1. Ma Y, He Y, Tong Y, Yu X, Tittel FK. Quartz-tuning-fork Enhanced Photothermal Spectroscopy for Ultra-high Sensitive Trace Gas Detection. Opt Express (2018) 26(24):32103. doi:10.1364/OE.26.032103
2. Huang F, Tian Y, Li Y, Ye W, Lu Y, Guo J, et al. Normalization of Underwater Laser-Induced Breakdown Spectroscopy Using Acoustic Signals Measured by a Hydrophone. Appl Opt (2021) 60(6):1595–602. doi:10.1364/AO.413853
3. Lang Z, Qiao S, Ma Y. Acoustic Microresonator Based In-Plane Quartz-Enhanced Photoacoustic Spectroscopy Sensor with a Line Interaction Mode. Opt Lett (2022) 47(6):1295. doi:10.1364/OL.452085
4. Das RS, Agrawal YK. Raman Spectroscopy: Recent Advancements, Techniques and Applications. Vibrational Spectrosc (2011) 57:163–76. doi:10.1016/j.vibspec.2011.08.003
5. Qin J, Kim MS, Chao K, Gonzalez M, Cho B-K. Quantitative Detection of Benzoyl Peroxide in Wheat Flour Using Line-Scan Macroscale Raman Chemical Imaging. Appl Spectrosc (2017) 71:2469–76. doi:10.1177/0003702817706690
6. Almaviva S, Chirico R, Nuvoli M, Palucci A, Schnürer F, Schweikert W. A New Eye-Safe UV Raman Spectrometer for the Remote Detection of Energetic Materials in Fingerprint Concentrations: Characterization by PCA and ROC Analyzes. Talanta (2015) 144:420–6. doi:10.1016/j.talanta.2015.06.075
7. Wang H, Williams L, Hoe S, Lechuga-Ballesteros D, Vehring R. Quantitative Macro-Raman Spectroscopy on Microparticle-Based Pharmaceutical Dosage Forms. Appl Spectrosc (2015) 69:823–33. doi:10.1366/14-07812
8. Liu M, Mu Y, Hu J, Li J, Zhang X. Optical Feedback for Sensitivity Enhancement in Direct Raman Detection of Liquids. J Spectrosc (2021) 2021:1–7. doi:10.1155/2021/5588417
9. Kumar V, Holtum T, Sebena D, Giese M, Voskuhl J, Schlücker S. Ultraviolet Resonance Raman Spectroscopy with a Continuously Tunable Picosecond Laser: Application to the Supramolecular Ligand Guanidiniocarbonyl Pyrrole (GCP). Spectrochimica Acta A: Mol Biomol Spectrosc (2021) 250:119359. doi:10.1016/j.saa.2020.119359
10. Choi JH, Choi M, Kang T, Ho TS, Choi SH, Byun KM. Combination of Porous Silk Fibroin Substrate and Gold Nanocracks as a Novel SERS Platform for a High-Sensitivity Biosensor. Biosensors (2021) 11:441. doi:10.3390/bios11110441
11. Li Z, Li C, Yu J, Li Z, Zhao X, Liu A, et al. Aluminum Nanoparticle Films with an Enhanced Hot-Spot Intensity for High-Efficiency SERS. Opt Express (2020) 28:9174. doi:10.1364/OE.389886
12. Tarun A, Hayazawa N, Yano T-A, Kawata S. Tip-heating-assisted Raman Spectroscopy at Elevated Temperatures. J Raman Spectrosc (2011) 42:992–7. doi:10.1002/jrs.2820
13. Matousek P. Raman Signal Enhancement in Deep Spectroscopy of Turbid Media. Appl Spectrosc (2007) 61:845–54. doi:10.1366/000370207781540178
14. Misra AK, Sharma SK, Kamemoto L, Zinin PV, Yu Q, Hu N, et al. Novel Micro-cavity Substrates for Improving the Raman Signal from Submicrometer Size Materials. Appl Spectrosc (2009) 63:373–7. doi:10.1366/000370209787598988
15. Larkin PJ, Santangelo M, Šašiċ S. Internal Multiple-Scattering Hole-Enhanced Raman Spectroscopy: Improved Backscattering Fourier Transform Raman Sampling in Pharmaceutical Tablets Utilizing Cylindrical-Conical Holes. Appl Spectrosc (2012) 66:892–902. doi:10.1366/12-06677
16. Lohumi S, Kim MS, Qin J, Cho B-K. Improving Sensitivity in Raman Imaging for Thin Layered and Powdered Food Analysis Utilizing a Reflection Mirror. Sensors (2019) 19:2698. doi:10.3390/s19122698
17. Lednev VN, Sdvizhenskii PA, Grishin MY, Filippov MN, Shchegolikhin AN, Pershin SM. Laser Crater Enhanced Raman Spectroscopy. Opt Lett (2017) 42:607. doi:10.1364/OL.42.000607
18. Lednev VN, Sdvizhenskii PA, Grishin MY, Fedorov AN, Khokhlova OV, Oshurko VB, et al. Optimizing Laser Crater Enhanced Raman Scattering Spectroscopy. Spectrochimica Acta Part A: Mol Biomol Spectrosc (2018) 196:31–9. doi:10.1016/j.saa.2018.01.070
19. Zhao J. Analytical Solution to the Depth-Of-Origin Profile of Transmission Raman Spectroscopy in Turbid Media Based on the Kubelka-Munk Model. Appl Spectrosc (2019) 73:1061–73. doi:10.1177/0003702819845914
20. Vargas WE, Niklasson GA. Applicability Conditions of the Kubelka-Munk Theory. Appl Opt (1997) 36:5580. doi:10.1364/AO.36.005580
21. Matousek P. Deep Non-invasive Raman Spectroscopy of Living Tissue and Powders. Chem Soc Rev (2007) 36(8):1292–304. doi:10.1039/b614777c
22. Olds WJ, Sundarajoo S, Selby M, Cletus B, Fredericks PM, Izake EL. Noninvasive, Quantitative Analysis of Drug Mixtures in Containers Using Spatially Offset Raman Spectroscopy (SORS) and Multivariate Statistical Analysis. Appl Spectrosc (2012) 66(5):530–7. doi:10.1366/11-06554
23. Yang DW. Study of Cavity Enhanced Raman Spectroscopy (CERS) for the Detection of CO2 and HCO3- Dissolved in Seawater [D]. Qing Dao: China: Ocean University of China (2018).
24. Schrader B, Bergmann G. Die Intensität des Ramanspektrums polykristalliner Substanzen. Z Anal Chem (1967) 225:230–47. doi:10.1007/bf00983673
25. Englisch W. Quartz Glass for Space Optical Applications[C]. Proc SPIE (1989) 1118:42. doi:10.1117/12.960946
26.THORLABS. UV Fused Silica High-Precision Windows (2022). Available from: https://www.thorlabschina.cn/newgrouppage9.cfm?objectgroup_id=3983 (Accessed January 5, 2022).
Keywords: Raman spectroscopy, quartz tube, powder samples, signal enhancement, new method
Citation: Si G, Liu J, Li Z, Ning Z and Fang Y (2022) Quartz Tube Enhanced Raman Scattering Spectroscopy. Front. Phys. 10:930007. doi: 10.3389/fphy.2022.930007
Received: 27 April 2022; Accepted: 16 May 2022;
Published: 05 July 2022.
Edited by:
Yufei Ma, Harbin Institute of Technology, ChinaCopyright © 2022 Si, Liu, Li, Ning and Fang. This is an open-access article distributed under the terms of the Creative Commons Attribution License (CC BY). The use, distribution or reproduction in other forums is permitted, provided the original author(s) and the copyright owner(s) are credited and that the original publication in this journal is cited, in accordance with accepted academic practice. No use, distribution or reproduction is permitted which does not comply with these terms.
*Correspondence: Yonghua Fang, eWhmYW5nQGFpb2ZtLmFjLmNu
Disclaimer: All claims expressed in this article are solely those of the authors and do not necessarily represent those of their affiliated organizations, or those of the publisher, the editors and the reviewers. Any product that may be evaluated in this article or claim that may be made by its manufacturer is not guaranteed or endorsed by the publisher.
Research integrity at Frontiers
Learn more about the work of our research integrity team to safeguard the quality of each article we publish.