 J. C. A. van Huijstee
 P. Blom2
 J. Beckers
95% of researchers rate our articles as excellent or good
Learn more about the work of our research integrity team to safeguard the quality of each article we publish.
Find out more
ORIGINAL RESEARCH article
Front. Phys. , 20 June 2022
Sec. Low-Temperature Plasma Physics
Volume 10 - 2022 | https://doi.org/10.3389/fphy.2022.926160
This article is part of the Research Topic Particle Interaction With Afterglow Plasma and Non-Quasi-Neutral Plasma View all 5 articles
An emerging topic in complex plasma physics is the interaction between dust particles and afterglow plasmas. Control of plasma-particle interactions and specifically of the particle trajectories is especially relevant for plasma based contamination control applications. In systems where this contamination control is relevant, emerging or applied plasmas can be of highly transient nature, due to which contaminating particles interact with a combination of a spatial and a temporal afterglow plasma. Until now this type of plasmas and the possible interaction with embedded microparticles has remained far from fully explored in literature. In this work we visually record falling microparticles in a spatio-temporal afterglow of a low pressure inductively coupled plasma and observe a sudden and temporary reversal in their vertical velocity. Numerical simulations confirm that this effect is due to the cooling of the heated background gas in the former active plasma region, which creates a pressure wave and causes microparticles in the spatial afterglow to experience an additional neutral drag force in direction of the plasma bulk. Besides being an interesting principle phenomenon, the presence of this effect could have added value for developing plasma-driven particle contamination control applications. Moreover, for a well defined vacuum vessel geometry and plasma heating volume, this enables the use of microparticles in the spatio-temporal afterglow as probe for the neutral gas temperature in plasma.
The interaction between dust particles and plasma is a widely researched topic [1–6]. Specifically the charging of the particles by plasma species [7] and their trajectories in a plasma environment [8, 9] have garnered much attention in the past decades.
Control over plasma-particle interaction and specifically over the particle trajectories, is especially relevant for contamination control applications [10]. For example the combination of plasma charging of nano- and microparticles and an externally applied electric field in the afterglow plasma region could be used to develop a particle filter that can protect sensitive surfaces in vacuum environments [11] or remove particulate air pollution from ambient air [12].
In fact, a large part of the research in the fields of complex and dusty plasmas in general, is focused around understanding the charging of the particles [7, 13–16]. The investigation of fundamental interactions between plasma environments and particles also often includes charge related forces such as electrostatic and ion drag forces, besides the well-known neutral drag force, and in some cases the thermophoretic force caused by a temperature gradient in the plasma [17–21].
In many applications where contamination control is relevant, the plasmas in use are transient in nature, such as nanosecond pulsed plasmas and EUV-induced plasmas in lithographic equipment [22, 23]. This means that there is a temporal afterglow altering the plasma around the dust particles, possibly in combination with a spatial afterglow if the particles move away from the (initial) active plasma zone.
While particles in both temporal [21, 24–29] and spatial afterglow plasmas [16, 30–33] have been investigated separately in the past, the combination of both types of afterglows appears a new topic in the field of dusty plasma physics.
Our previous research focused on the (de-)charging of microparticles in the spatial afterglow of a low pressure inductively coupled plasma (ICP). In that research, the trajectories of injected particles and the influence of the electrostatic force generated by an externally applied electric field thereon were investigated for various plasma parameters and configurations [30, 34–37]. In the current paper we present experiments monitoring the trajectories of falling microparticles experiencing a combination of a spatial and a temporal afterglow plasma, in which an additional neutral drag force is revealed. This force temporarily decreases and even reverses the initial velocity of the particles during the temporal afterglow.
This paper is organized as follows. First, the relevant theory will be presented in Section 2, followed in Section 3 by a brief explanation of the experimental setup used. In Section 4 the experimental results are presented, followed by a physical interpretation and hypothesis for the physics at play in Section 5. Numerical simulations to support this hypothesis are discussed in Section 6 and compared with the experimental results in Section 7. Finally the main conclusions are presented in Section 8.
The vertical motion of a microparticle in a laminar gas flow (in absence of plasma and temperature gradients) is dominantly governed by two forces, being the gravitational force and the neutral drag force. Here the negative vertical direction is defined as the direction of the gravitational acceleration
If a particle is released from a stationary position into a gas flow, it will accelerate until it reaches its terminal velocity when the neutral drag force equals the gravitational force. For a spherical particle of radius r and uniform mass density ρp, the gravitational force is given by
The neutral drag force that a particle experiences, depends on the flow regime, which is characterized by the particle Knudsen number
for a particle with velocity
Equating
Since gravity is constant and the neutral drag force scales linearly with the particle velocity, the time dependent particle velocity will tend towards this value exponentially with a timescale of
The experimental setup used, schematically shown in Figure 1, has been extensively described in our previous works [30, 34–37]. Therefore, only a short overview of the key characteristics is included here, along with the implemented changes that are relevant for this work.
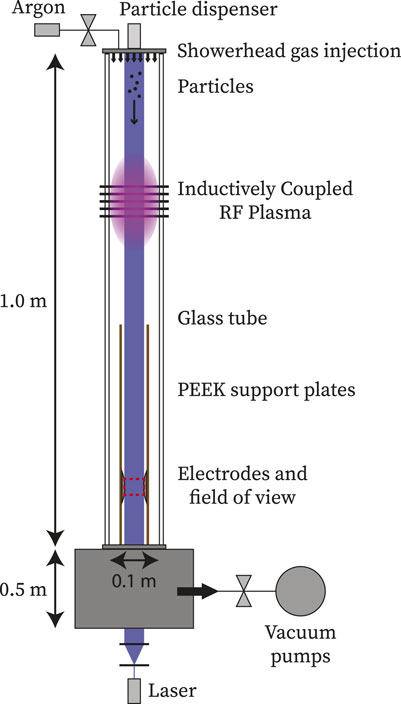
FIGURE 1. Schematic side view of the experimental setup. Note that the vacuum vessel on the bottom of the setup in reality has a large and complex shape, which is simplified in this figure as a rectangle and is not depicted to scale. The red rectangle represents the field of view of the high speed camera.
The setup consists of a 1 m long vertical glass tube with a square 10 cm × 10 cm cross-section, mounted on top of a large (≈20 L = 2 ⋅ 10–2 m−3) vacuum vessel. The entire system is filled with argon at a pressure of 90 Pa, while the base-pressure is measured to be 2 ⋅ 10–5 Pa. Near the top of the tube an inductively coupled plasma is created by sending an alternating current (at 13.56 MHz) through a square coil with five windings that is wrapped around the tube. This plasma is operated in E-mode at low power, in the range (3–10) W.
The microparticles used here are melamine formaldehyde (MF) with a thin silver coating (to minimize clustering) and a supplier provided radius measurement of (2.48 ± 0.20) µm. These particles are stored in powder form in a dispenser that is connected in a vacuum-tight manner to the top of the setup. When - on request - the particles are injected into the tube, they fall down through the active plasma region, reaching a typical measured terminal velocity of 4.7 cm s−1. From Eqs. 3 and 4 it follows that ρp = 1.61 ⋅ 103 kg/m3 and τ = 5 ms for δ = 1.442. A time delay generator triggers the camera (Photron Fastcam Mini UX100) to start recording 21 s after the particles are dispensed. The camera images an area of 4.0 cm × 3.2 cm at the bottom of the tube in the far spatial plasma afterglow, with a framerate of 1,000 fps. This area is indicated by the red rectangle in Figure 1.
Just outside the field of view are two parallel Rogowski shaped electrodes [39, 40], which can be used to apply a homogeneous horizontal electric field, for example when investigating microparticle charging, as was done in our previous works [11, 30, 34–37]. The electrodes are each attached to a supporting plate made of PEEK (polyether ether ketone). These plates extend 0.3 m above the center of the electrodes.
The data from the camera is analyzed with in-house developed MATLAB code, which first detects particles in each individual frame and subsequently reconstructs their trajectories over time. The camera is placed slightly out of focus, so that particles are imaged on multiple pixels and it is possible to determine their location with sub-pixel accuracy by calculating the center of mass of their intensity profile. Typically the standard deviation in this intensity weighed mean position is less than 0.2 pixels, which is equal to approximately 5.5 µm.
Compared to our previous works, the following changes to the experimental setup have been implemented. First, there is no gas flow present during the measurements. Before injecting the particles, both the gas inlet and the outlet connected to the pumps are closed to ensure that the gas in the tube is stationary.
Second, both electrodes are left electrically floating. This means that there was no externally applied horizontal electric field during the measurements that led to the results presented here. However, to exclude the influence of electric fields, the measurements were also repeated with an applied electric field of 1 kV m−1 (DC voltage of +20 V and −20 V applied to the electrodes just left and right of the field of view respectively), which does not change the relevant part of the results (see Supplementary Appendix SA).
Third and most important, the ICP power is switched off 26 s after the particles are dispensed, while they are being recorded by the camera (downstream of the active plasma region). This creates a spatio-temporal afterglow and causes the particles’ vertical velocity to briefly decrease, or even completely reverse direction. From here on, we will call this event the ‘hiccup’. The physics behind this hiccup will be elaborated on in the following sections.
In this section the recorded trajectories of falling particles in the spatio-temporal afterglow are discussed. Most notably, just after the plasma power source is switched off while the particles are in the spatial afterglow region, we observe a hiccup in their vertical motion. This is illustrated in Figure 2 for 34 particle trajectories from two separate measurements. During these measurements, the initial plasma power was 5.5 W (blue lines, 10 particle trajectories) and 3.5 W (red lines, 24 particle trajectories) respectively. For each measurement, all trajectories are included of which the first detection was at least 20 ms before and the last detection at least 50 ms after the plasma power source was terminated.
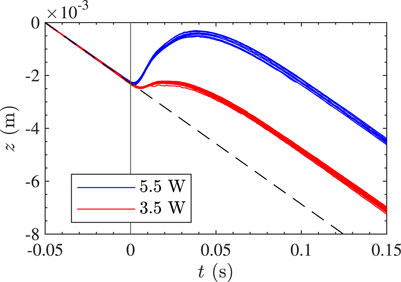
FIGURE 2. Examples of (10 and 24) measured trajectories from two separate measurements with a plasma power of 5.5 and 3.5 W respectively. The vertical line at t = 0 represents the moment the plasma power source is switched off. The dashed line represents the terminal velocity of the particles prior to the moment the plasma was switched off and has a slope of 4.58 cm s−1. For each particle, z is defined as its vertical position relative to that at t = −0.05 s.
Figure 2 shows that, initially, the particles are falling at a terminal vertical velocity of (4.58 ± 0.04) cm s−1, illustrated by the black dashed linear line. This is slightly lower than the value of 4.7 cm s−1, which is the velocity averaged over all particle trajectories (no conditions for the time of the first and last detections), corresponding to the mean particle radius of 2.48 µm. This discrepancy can easily be explained by the fact that there is a significant spread in radius of the particles that are injected. Inserting the averaged measured velocity into Eq. 3 gives the radius of the observed particles, which is (2.44 ± 0.02) µm. Note that there are also particles with significantly higher and lower radii dispensed, but due to the difference in their terminal velocity, they reach the field of view at a different moment in time.
Remarkably, during the first few milliseconds after the plasma power is switched off at t = 0, the velocity of the particles decreases, before relaxing back towards the original value. In most cases the particle velocity even reaches a positive value (against the direction of gravity), with the maximum velocity clearly scaling with plasma power.
In order to get more information about the physics at play, the particles’ velocity and acceleration are calculated from their trajectories. This is done using a central difference scheme, for each point in time taking the difference between the following and previous point in the trajectory to determine the velocity and subsequently the acceleration.
Once the velocity and acceleration of the falling particles are determined (as a function of time and for both plasma input powers), the forces acting on the particles can be calculated using Eqs. 1 and 2. If it is assumed that the hiccup is caused by a single, unknown, additional force, Fadd(t), all forces but one are known and Newton’s second law can be applied to find the magnitude of Fadd. Therefore, the following equation is solved for each particle trajectory and for each time step:
In this equation, mp is the particle’s mass, which is constant over the measurement duration, and az(t) its vertical acceleration. The calculated values of the four terms in this balance are plotted in Figure 3A for the average of all 10 particle trajectories from the measurement with 5.5 W plasma power and in Figure 3B for the average of all 24 particle trajectories from the measurement with 3.5 W plasma power. The trajectories used for these calculations are the same as the trajectories shown in blue and red respectively in Figure 2.
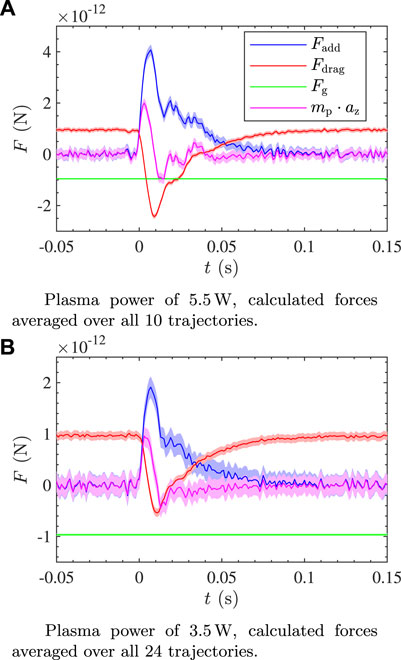
FIGURE 3. Calculated force balance for experiments with a plasma power of (A) 5.5 W and (B) 3.5 W, averaged over all (10 and 24 respectively) trajectories in each measurement.
The shaded areas around the lines in Figure 3 represent the spread in the respective values, which arise from the standard deviation of approximately 5.5 µm in the position of each particle detection.
In this section we hypothesize the physical nature of the unknown force that is causing the observed hiccup. First it is argued that electric fields are not responsible, after which the hypothesis for the observed behavior is introduced, which will be further investigated using numerical simulations in Sections 6 and 7.
Considering that there is a plasma involved, as well as two electrodes just outside the field of view, one could suspect the additional force induced by switching off the plasma to be related to electric fields. For example an electrostatic force due to the charge on the particle, or an induced ion drag force could be responsible. In order to verify whether this is the case, the measurements with floating electrodes are repeated with an applied horizontal electric field of 1 kV m−1 (one electrode biased negative at −20 V and one positive at +20 V).
A comparison of these measurements - as demonstrated in Supplementary Appendix SA – shows that forces related to the electric field cannot be responsible for the hiccup in vertical direction, since the hiccup behavior is the same in both cases. Moreover, there is no horizontal hiccup, or any other change in horizontal motion, when the plasma is switched off in any of the measurements. This is illustrated in Supplementary Figure S1 in Supplementary Appendix SA, where the vertical and horizontal components of the trajectories of particles in a situation with both electrodes floating and with an external field of 1 kV m−1 are plotted. Since the particles are recorded when they are between the two electrodes, the horizontal component of the electric field is much larger than the vertical component when a voltage is applied. If the hiccup was related to the electric field, there should therefore be a change in the horizontal motion as well as in the vertical motion, which is not observed.
On the other hand, something that we do observe after the plasma is terminated, is a drop in gas pressure. While the pressure is not measured in a time resolved manner, typically there is a drop of 10−2–10−1 Pa between pre and post switching off the plasma. The pressure gauge is located at the bottom of the setup, connected to the vacuum vessel on which the glass tube is mounted.
Based on these results, we hypothesize that the observed hiccup is caused by sudden cooling of the heated plasma volume upon switching off the plasma. This would induce a pressure wave in the setup and eventually result in a decrease of the total pressure. Since the plasma is created in a tube, this means that - at first instance after switching off the plasma - there would be a gas flow from the bottom of the setup towards the afterglow plasma bulk. The gas flow then temporarily leads to an additional neutral drag force directed in opposite direction compared to that of the initial particle velocity. This process is expected to scale with gas temperature and therefore the plasma power, which is also observed in the experiments (see Figure 2).
In order to verify our hypothesis for the observed hiccup in the particle trajectories, we performed numerical flow simulations in COMSOL, combining the heat transfer and laminar flow modules.
The simulations are done in 3D, where the simulation volume is a block with the same dimensions as the glass tube in the experimental setup, which is 0.1 m × 0.1 m × 1.0 m. It includes two smaller blocks of 0.01 m × 0.05 m × 0.40 m representing the supports on which the electrodes are mounted. On all boundaries room temperature and no slip flow conditions are posed. Initially the tube is filled with argon at 90 Pa, with zero flow.
The simulations are conducted in two subsequent steps, the first of which is to compute a stationary solution while the plasma is present. This plasma is represented by a uniform heating source in a block with size 0.1 m × 0.1 m × 0.2 m, centered around the vertical position z = 0.70 m. This is approximately equal to the volume where light emission from the plasma can be observed during experiments. Since in reality the power that is absorbed by the plasma is not entirely used to heat the neutral gas, the heating power should always be less than the plasma input power. Therefore the heating power is set to the arbitrarily chosen value of either 1.0 W or 2.0 W, which is lower than the plasma power in the experiments. There is also a pressure point constraint included to ensure that the pressure remains at 90 Pa.
Figure 4 shows the simulated temperature profile for a heating power of 2.0 W in a plane cut through the center of the tube. This figure clearly shows that while the plasma volume is heated, the temperature gradient is near zero between the electrodes. Therefore the hiccup appears to not be caused directly by a temperature gradient, or in other words, Fadd is most likely not a thermophoretic force.
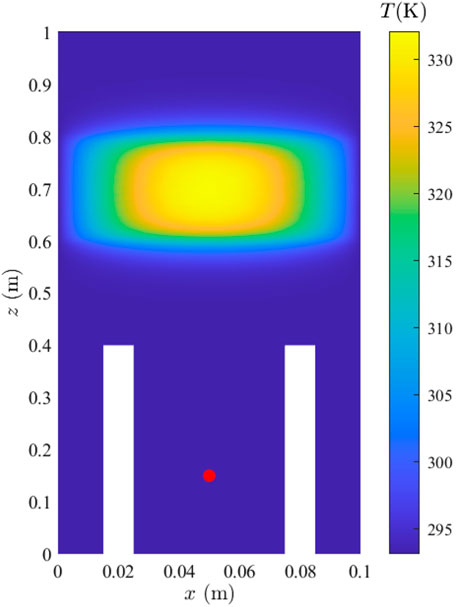
FIGURE 4. Simulated stationary solution of the temperature for a uniform heating source of 2.0 W in a volume with height 20 cm. This is a plane cut through the center of the tube. The two white rectangles represent the supports for the electrodes, which are excluded from the simulation domain. The red dot is the position where we will analyze the gas flow and resulting drag force on the particles.
The second step of the simulation represents the temporal plasma afterglow, during which the gas cools down. In this step, the stationary solution of step 1 is used as initial condition for a time dependent solution, where the temporal afterglow is created by simply disabling the heat source. Additionally, the pressure point constraint is removed in order to correctly simulate the change in pressure caused by the cooling of the gas. With these two changes to the model, the pressure, temperature and flow in the tube are computed during a period of 150 ms.
While the simulation outputs multiple parameters, all spatially and temporally resolved, the most interesting of these to compare with the experiments are the vertical flow velocity at the measurement location and the (maximum) temperature of the plasma volume. These values are plotted in Figures 5A,B for a heating power of 2.0 and 1.0 W respectively. In these figures vz, depicted in blue, represents the vertical flow in the center of the tube at the height where the center of the camera field of view is located in the experiment. For reference, this position is also marked by the red dot in Figure 4. The maximum temperature in the plasma volume is also added in red in Figure 5, to further illustrate that the two are highly correlated.
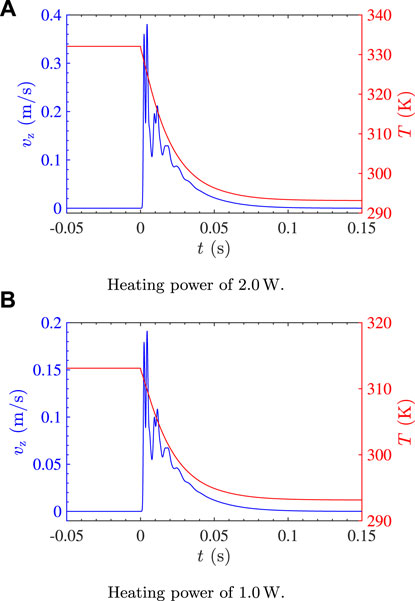
FIGURE 5. Simulated flow velocity in the center of the tube at the height of the electrodes on the left axis and maximum temperature of the plasma volume on the right axis. The heating power is (A) 2.0 W and (B) 1.0 W.
Notably, in Figure 5 there are oscillations in the magnitude of the simulated flow velocity, which is something that is also visible in the experimental data in Figure 3. These oscillations are most likely caused by the pressure wave reflecting at the end of the tube. In the simulation, the tube is treated as a closed volume for simplicity purposes. However, in reality there is a large vacuum vessel with a complex shape and a height of ≈50 cm below the glass tube, to which the pumps, pressure sensors and other diagnostics are connected. We approximate the influence of this extra volume on the gas flow by extending the simulated tube by 50 cm, which shows that indeed the timescale of the oscillations is longer for a longer tube. This is illustrated in Supplementary Figure S2 in Supplementary Appendix SB and supports the above reasoning regarding pressure wave reflection.
As another verification step, the simulated wave velocity is compared to the theoretical sound velocity of 319.2 m s−1 in argon at room temperature. This apparent wave velocity is determined by taking the Fourier transform of the simulated temporal flow velocity and multiplying the main frequency by four times the distance from the bottom of the tube to the bottom of the heating volume. This distance is equal to a quarter wavelength. The resulting wave velocities for the standard and extended tubes are 317.9 m s−1 and 320.5 m s−1 respectively and are independent of heating power. These values indeed closely match the theoretical speed of sound.
Just as in the experiments, the magnitude of the flow velocity in the simulations scales with the input heating power. This also means that experimental data could give information about the heating of the neutral gas in the plasma volume. However, by neglecting the bottom vacuum vessel and approximating the plasma as a cuboidal uniform heating source, an exact determination of the plasma gas temperature is currently not possible. With a more accurate representation of the heat source and geometry in the simulation, one should be able to calculate the temperature of the plasma based on the particle trajectories during the hiccup and use this as a novel plasma diagnostic.
For direct comparison of the simulation results with the unknown force from the experimental results, the computed flow velocity first has to be translated into a particle velocity. Therefore we compute the time dependent force balance of Eq. 5, rewritten to find the acceleration of the particle. The relevant forces are still assumed to only be gravity and neutral drag, but now with an additional drag component caused by the additional gas flow (see Eq. 2) induced by the termination of the plasma source and subsequent gas cooling in the former plasma volume. During the computation, the two components of the drag force are separated, to make comparison with the experimental results possible.
Starting with a vertical velocity equal to the initial velocity as measured in the experiments, the magnitude of the forces and the resulting acceleration of a typical particle are calculated in timesteps of 1 ms. After each timestep the acceleration is used to update the velocity and position of the particle. The trajectories that are simulated this way are compared to the experimentally measured trajectories in Supplementary Figure S3 in Supplementary Appendix SC. In this section we will discuss only the forces, in order to keep the focus on the underlying physics.
Figure 6 depicts both the unknown force from the experimental results in blue (from Figure 3A, measurement with a plasma power of 5.5 W) and the computed additional drag force due to the gas flow that is caused by cooling of the plasma in red (simulated heating power of 2.0 W). Both forces show the same behavior, with a sharp increase when the plasma power source is switched off and then oscillating around an exponential decay. Note that the period of the oscillations in the magnitude of the simulated force, which are caused by the reflection of the pressure wave, depends on the geometry of the vacuum vessel. Additionally, the absolute values of the force depend on both the vessel geometry and the heating source. The heating power in the simulation is not the same as the plasma power in the experiment, since it is assumed that not all power absorbed in the plasma is used to heat the gas.
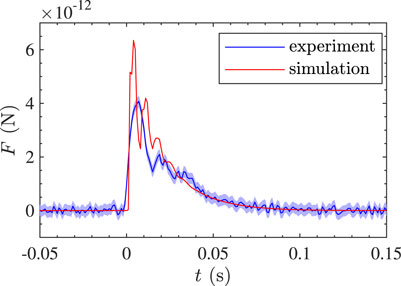
FIGURE 6. Comparison of the magnitude of the unknown force measured in the experiment with 5.5 W plasma power and the simulated additional drag force caused by a pressure wave due to cooling of the plasma volume represented by a heating source of 2.0 W. The two show good agreement.
The simulated drag force caused by the gas flow and experimentally determined unknown force plotted in Figure 6 show good agreement. Qualitatively the forces behave the same and they are also of the same order of magnitude. Furthermore, the timescales of the exponential decay are similar. The discrepancies in the amplitude of the peak and the period of the oscillation, can be explained by the simulation having a simplified geometry and heat source representation of the plasma. This means that different assumptions on the heating source and a less simplified geometry in the model could result in an even better match of the simulated data to the experiments.
From this we conclude that the hiccup in the vertical velocity of falling microparticles in the spatio-temporal afterglow in our experiments is due to an increased drag force, which is induced by a pressure wave that is caused by sudden cooling of the plasma volume. Besides being an interesting fundamental phenomenon, for a well defined geometry and plasma heating volume, this also enables the use of microparticles in the spatio-temporal afterglow as probes for the neutral gas temperature in the plasma bulk
Microparticles falling through a spatio-temporal plasma afterglow experience - downstream the initial plasma volume - an additional upward force towards the plasma bulk region, which is likely due to the sudden cooling of that volume. Simulations of the additional neutral drag force caused by the pressure wave that is created when the bulk plasma volume cools down agree well with the experimentally measured force.
Aside from this being fundamentally interesting, this effect is of importance for example when designing plasma based particle contamination control applications with a pulsed plasma source. Furthermore, in a vessel with well defined, simple geometry and an exactly known plasma heating volume, numerically simulating the pressure wave should be more straightforward, allowing for a more accurate determination of the relation between plasma temperature and flow velocity. These findings enable the future use of microparticles in the spatio-temporal afterglow as a probe for the neutral gas temperature in the bulk plasma.
The raw data supporting the conclusions of this article will be made available by the authors, without undue reservation.
JB conceived the project and worked out further plans with AP and PB. JH carried out the experiments and analyzed the results, which were discussed with all authors. JH wrote the manuscript. JB supervised the project.
This research is directly funded by VDL Enabling Technologies Group.
Authors PB and AP were employed by the company VDL Enabling Technologies Group.
The remaining authors declare that the research was conducted in the absence of any commercial or financial relationships that could be construed as a potential conflict of interest.
The authors declare that this study received funding from VDL Enabling Technologies Group. The funder had the following involvement in the study: co-design of the study.
All claims expressed in this article are solely those of the authors and do not necessarily represent those of their affiliated organizations, or those of the publisher, the editors and the reviewers. Any product that may be evaluated in this article, or claim that may be made by its manufacturer, is not guaranteed or endorsed by the publisher.
The authors are grateful to Pieter Sanders, Ab Schrader and Jürgen Kohlhepp for their technical support.
The Supplementary Material for this article can be found online at: https://www.frontiersin.org/articles/10.3389/fphy.2022.926160/full#supplementary-material
1. Gopalakrishnan R, McMurry PH, Hogan CJ. The Bipolar Diffusion Charging of Nanoparticles: A Review and Development of Approaches for Non-spherical Particles. Aerosol Sci Tech (2015) 49(12):1181–94. doi:10.1080/02786826.2015.1109053
2. Fortov VE, Ivlev AV, Khrapak SA, Khrapak AG, Morfill GE. Complex (Dusty) Plasmas: Current Status, Open Issues, Perspectives. Phys Rep (2005) 421(1-2):1–103. doi:10.1016/j.physrep.2005.08.007
3. Khrapak S, Morfill G. Basic Processes in Complex (Dusty) Plasmas: Charging, Interactions, and Ion Drag Force. Contrib Plasma Phys (2009) 49(3):148–68. doi:10.1002/ctpp.200910018
4. Ishihara O. Complex Plasma: Dusts in Plasma. J Phys D: Appl Phys (2007) 40(8). doi:10.1088/0022-3727/40/8/r01
5. Pustylnik MY, Pikalev AA, Zobnin AV, Semenov IL, Thomas HM, Petrov OF. Physical Aspects of Dust–Plasma Interactions. Contrib Plasma Phys (2021) 61(10):1–37. doi:10.1002/ctpp.202100126
6. Popel SI, Losseva TV, Merlino RL, Andreev SN, Golub’ AP. Dissipative Processes and Dust Ion-Acoustic Shocks in a Q Machine Device. Phys Plasmas (2005) 12(5):054501. doi:10.1063/1.1885476
7. Goree J. Charging of Particles in a Plasma. Plasma Sourc Sci. Technol. (1994) 3(3):400–6. doi:10.1088/0963-0252/3/3/025
8. Schulz P, Pflug A, Kricheldorf H-U. Simulation of Microparticle Motion and Contamination in Plasma Coating Systems. J Vacuum Sci Tech B (2020) 38(2):022203. Available from. doi:10.1116/1.5130720
9. Thomas E, Annaratone BM, Morfill GE, Rothermel H. Measurements of Forces Acting on Suspended Microparticles in the Void Region of a Complex Plasma. Phys Rev E Stat Nonlin Soft Matter Phys (2002) 66(1):016405–7. doi:10.1103/PhysRevE.66.016405
10. van de Kerkhof MA, van Empel T, Lercel M, Smeets C, van de Wetering F, Nikipelov A, et al. Advanced Particle Contamination Control in EUV Scanners. In: Extreme Ultraviolet (EUV) Lithography X. San Jose, CA, United States: SPIE (2019). doi:10.1117/12.2514874
11. Beckers J, van Minderhout B, Blom P, Kroesen G, Peijnenburg T. Particle Contamination Control by Application of Plasma. In: Extreme Ultraviolet (EUV) Lithography XI, 11323. San Jose, CA, United States: SPIE (2020). p. 558–63. doi:10.1117/12.2560192
12. Mo J, Tian E, Pan J. New Electrostatic Precipitator with Dielectric Coatings to Efficiently and Safely Remove Sub-micro Particles in the Building Environment. Sustainable Cities Soc (2020) 55:102063. Available from. doi:10.1016/j.scs.2020.102063
13. Beckers J, Ockenga T, Wolter M, Stoffels WW, Van Dijk J, Kersten H, et al. Microparticles in a Collisional Rf Plasma Sheath under Hypergravity Conditions as Probes for the Electric Field Strength and the Particle Charge. Phys Rev Lett (2011) 106(11):115002–4. doi:10.1103/PhysRevLett.106.115002
14. Staps TJA, van de Ketterij MI, Platier B, Beckers J. The Underexposed Effect of Elastic Electron Collisions in Dusty Plasmas. Commun Phys (2021) 4(1). doi:10.1038/s42005-021-00734-w
15. Li L, Gopalakrishnan R. An Experimentally Validated Model of Diffusion Charging of Arbitrary Shaped Aerosol Particles. J Aerosol Sci (2021) 151:105678. doi:10.1016/j.jaerosci.2020.105678
16. Chen X, Hogan CJ. Nanoparticle Dynamics in the Spatial Afterglows of Nonthermal Plasma Synthesis Reactors. Chem Eng J (2021) 411:128383. Available from. doi:10.1016/j.cej.2020.128383
17. Thoma MH, Hoefner H, Khrapak SA, Kretschmer M, Quinn RA, Ratynskaia S, et al. Measurement of the Ion Drag Force in a Complex DC-Plasma Using the PK-4 Experiment. Ukrayins’kij Fyizichnij Zhurnal (Kiev) (2005) 50(2):179–83. Available at: http://arxiv.org/abs/physics/0411021 (Accessed January 18 2022).
18. Ivlev AV, Zhdanov SK, Khrapak SA, Morfill GE. Ion Drag Force in Dusty Plasmas. Plasma Phys Controlled Fusion (2004) 46. doi:10.1088/0741-3335/46/12b/023
19. Matthews LS, Sanford DL, Kostadinova EG, Ashrafi KS, Guay E, Hyde TW. Dust Charging in Dynamic Ion Wakes. Phys Plasmas (2020) 27(2). doi:10.1063/1.5124246
20. Rothermel H, Hagl T, Morfill GE, Thoma MH, Thomas HM. Gravity Compensation in Complex Plasmas by Application of a Temperature Gradient. Phys Rev Lett (2002) 89(17):175001. doi:10.1103/physrevlett.89.175001
21. Couëdel L, Mikikian M, Boufendi L, Samarian AA. Residual Dust Charges in Discharge Afterglow. Phys Rev E : Stat Nonlinear, Soft Matter Phys (2006) 74:026403. doi:10.1103/PhysRevE.74.026403
22. Beckers J, van de Ven T, van der Horst R, Astakhov D, Banine V. EUV-induced Plasma: A peculiar Phenomenon of a Modern Lithographic Technology. Appl Sci (2019) 9(14). doi:10.3390/app9142827
23. Van De Kerkhof M, Yakunin AM, Astakhov D, Van Kampen M, Van Der Horst R, Banine V. EUV-induced Hydrogen Plasma: Pulsed Mode Operation and Confinement in Scanner. J Micro/Nanopatterning, Mater Metrology (2021) 20(3). doi:10.1117/1.jmm.20.3.033801
24. Couëdel L, Mezeghrane A, Samarian AA, Mikikian M, Tessier Y, Cavarroc M, et al. Complex Plasma Afterglow. Contrib Plasma Phys (2009) 49(4-5):235–59. doi:10.1002/ctpp.200910025
25. Couëdel L, Samarian AA, Mikikian M, Boufendi L. Influence of the Ambipolar-to-free Diffusion Transition on Dust Particle Charge in a Complex Plasma Afterglow. Phys Plasmas (2008) 15(6):063705. Available from. doi:10.1063/1.2938387
26. Chaubey N, Goree J, Lanham SJ, Kushner MJ. Positive Charging of Grains in an Afterglow Plasma Is Enhanced by Ions Drifting in an Electric Field. Phys Plasmas (2021) 28(10). doi:10.1063/5.0069141
27. Wörner L, Ivlev AV, Couëdel L, Huber P, Schwabe M, Hagl T, et al. The Effect of a Direct Current Field on the Microparticle Charge in the Plasma Afterglow. Phys Plasmas (2013) 20(12):10–7. doi:10.1063/1.4843855
28. Denysenko IB, Mikikian M, Azarenkov NA. Dust Dynamics during the Plasma Afterglow. J Phys D: Appl Phys (2022) 55(9):095201. doi:10.1088/1361-6463/ac3539
29. Schweigert IV, Alexandrov AL. Effect of Nanoparticles on an Rf Discharge Afterglow. J Phys D: Appl Phys (2012) 45(32). doi:10.1088/0022-3727/45/32/325201
30. Van Minderhout B, Peijnenburg ATA, Blom P, Vogels JM, Kroesen GMW, Beckers J. The Charge of Micro-particles in a Low Pressure Spatial Plasma Afterglow. J Phys D: Appl Phys (2019) 52(32). doi:10.1088/1361-6463/ab2525
31. Sharma G, Abuyazid N, Dhawan S, Kshirsagar S, Sankaran RM, Biswas P. Characterization of Particle Charging in Low-Temperature, Atmospheric-Pressure, Flow-Through Plasmas. J Phys D: Appl Phys (2020) 53(24). doi:10.1088/1361-6463/ab7c97
32. Chen X, Seto T, Kortshagen UR, Hogan CJ. Size and Structural Characterization of Si Nanocrystal Aggregates from a Low Pressure Nonthermal Plasma Reactor. Powder Tech (2020) 373:164–73. Available from. doi:10.1016/j.powtec.2020.06.026
33. Suresh V, Li L, Go Felipe RJ, Gopalakrishnan R. Modeling Nanoparticle Charge Distribution in the Afterglow of Non-thermal Plasmas and Comparison with Measurements. J Phys D: Appl Phys (2021) 54(27). doi:10.1088/1361-6463/abf70c
34. Van Minderhout B, Van Huijstee JCA, Platier B, Peijnenburg ATA, Blom P, Kroesen GMW, et al. Charge Control of Micro-particles in a Shielded Plasma Afterglow. Plasma Sourc Sci Tech (2020) 29(6). doi:10.1088/1361-6595/ab8e4f
35. Van Minderhout B, Van Huijstee JCA, Peijnenburg ATA, Blom P, Kroesen GMW, Beckers J. Charge Neutralisation of Microparticles by Pulsing a Low-Pressure Shielded Spatial Plasma Afterglow. Plasma Sourc Sci Tech (2021) 30(4). doi:10.1088/1361-6595/abd81f
36. van Minderhout B, van Huijstee JCA, Rompelberg RMH, Post A, Peijnenburg ATA, Blom P, et al. Charge of Clustered Microparticles Measured in Spatial Plasma Afterglows Follows the Smallest Enclosing Sphere Model. Nat Commun (2021) 12(1). Available from. doi:10.1038/s41467-021-23604-z
37. van Minderhout B. Microparticle Charging in Spatial Plasma Afterglows. Eindhoven, Netherlands: Eindhoven University of Technology (2021). Available at: www.tue.nl/taverne (Accessed February 25 2022).
38. Epstein PS. On the Resistance Experienced by Spheres in Their Motion through Gases. Phys Rev (1924) 23:710–33. doi:10.1103/physrev.23.710
39. Rogowski W. Die elektrische Festigkeit am Rande des Plattenkondensators. Archiv F Elektrotechnik (1923) 12(1):1–15. doi:10.1007/bf01656573
Keywords: dusty plasma, afterglow plasma, microparticles, neutral drag, pressure wave, neutral gas temperature, diagnostics
Citation: van Huijstee JCA, Blom P, Peijnenburg ATA and Beckers J (2022) Spatio-Temporal Plasma Afterglow Induces Additional Neutral Drag Force on Microparticles. Front. Phys. 10:926160. doi: 10.3389/fphy.2022.926160
Received: 22 April 2022; Accepted: 19 May 2022;
Published: 20 June 2022.
Edited by:
Vladislav Izmodenov, Space Research Institute (RAS), RussiaReviewed by:
Egor Godenko, Ishlinsky Institute for Problems in Mechanics (RAS), RussiaCopyright © 2022 van Huijstee, Blom, Peijnenburg and Beckers. This is an open-access article distributed under the terms of the Creative Commons Attribution License (CC BY). The use, distribution or reproduction in other forums is permitted, provided the original author(s) and the copyright owner(s) are credited and that the original publication in this journal is cited, in accordance with accepted academic practice. No use, distribution or reproduction is permitted which does not comply with these terms.
*Correspondence: J. C. A. van Huijstee, ai5jLmEudi5odWlqc3RlZUB0dWUubmw=
Disclaimer: All claims expressed in this article are solely those of the authors and do not necessarily represent those of their affiliated organizations, or those of the publisher, the editors and the reviewers. Any product that may be evaluated in this article or claim that may be made by its manufacturer is not guaranteed or endorsed by the publisher.
Research integrity at Frontiers
Learn more about the work of our research integrity team to safeguard the quality of each article we publish.