 Jarrad Begg
 Urszula Jelen
 Paul Keall
 Gary Liney1,2,3,6
 Lois Holloway
95% of researchers rate our articles as excellent or good
Learn more about the work of our research integrity team to safeguard the quality of each article we publish.
Find out more
ORIGINAL RESEARCH article
Front. Phys. , 14 October 2022
Sec. Medical Physics and Imaging
Volume 10 - 2022 | https://doi.org/10.3389/fphy.2022.925890
This article is part of the Research Topic Dosimetry and dose calculation for MR-guided radiation therapy View all 9 articles
Magnetic field correction factors are required for performing reference dosimetry on Magnetic Resonance Imaging Linear accelerators (MRI-linacs). Methods for measuring magnetic field correction factors usually require specialized equipment and expertise. Our work investigated the use of a microDiamond detector to cross-calibrate an ion chamber between a conventional linac and MRI-linac as a method to measure ion chamber magnetic field correction factors for the MRI-linac. Ratios of the microDiamond and ion chamber were measured on a conventional linac, parallel MRI-linac at 0 T, parallel MRI-linac at 1 T and perpendicular MRI-linac at 1.5 T. The beam quality dependence of the microDiamond was investigated by comparing the measurements on the conventional linac and parallel MRI-linac at 0 T. The magnetic field dependence of the microDiamond was investigated comparing the measurements on a parallel MRI-linac at 0 and 1 T. The ion chamber magnetic field correction factors were calculated by comparing the conventional linac and parallel MRI-linac at 1 T and the conventional linac and perpendicular MRI-linac at 1.5 T for the parallel and perpendicular factors respectively. The FC65-G and PTW30013 ion chambers were investigated. For a parallel MRI-linac, with a beam quality of
Magnetic Resonance Imaging Linear accelerators (MRI-linacs) are aligned with the beam axis either perpendicular to the constant magnetic field (
Dose profiles on perpendicular MRI-linacs are shifted laterally perpendicular to the
Ion chamber response in magnetic fields is affected by changes in the electron trajectories in the surrounding medium, which changes the electron fluence entering the detector. The trajectories of electrons inside a detector are also affected which changes the electron pathlength across the detector. Both the change in electron fluence around the detector and pathlength across the detector impact the number of ionization events which affects detector response [7]. On perpendicular MRI-linacs, the Lorentz force reduces the dose deposition by ∼0.5% [8, 9] and can either increase or decrease the electron pathlength dependent on
Magnetic field correction factors are used to correct reference dosimetry measurements for the changes in detector response [8, 9, 12, 13]. The correction factors depend on chamber size [14]. Farmer-type chamber correction factors for perpendicular MRI-linacs have previously been measured and simulated ranging between 0.3%–5% dependent on the orientation of the chamber long axis, radiation field and magnetic field, as well as the magnetic field strength [8, 13–16]. Farmer-type chamber correction factors for parallel MRI-linacs are in the order of 1% [13, 14, 17, 18].
A number of approaches for determining magnetic field correction factors have been considered but they all have challenges for practical implementation. Calorimetry determines dose on MRI-linacs from first principles [19–21] requiring specific equipment and expertise to measure dose and calculate correction factors. Chemical reactions in alanine can also be used to directly measure the dose [16, 22, 23]. Whilst mail-out services have been investigated [16], specialized equipment is required for alanine read out. Monte Carlo simulations can determine magnetic field correction factors with small uncertainties [13, 14, 24], however, these require validation via measurements. Another approach is to use electromagnets placed near conventional linacs [14, 24], however this also requires large and expensive equipment and the distance between the magnet poles limits the field size dimensions. Ramping the magnet down and back up provides an excellent first principal approach [8], however is very expensive and time consuming. Thus, a method using equipment easily available to a typical department is required to verify magnetic field correction factors.
Our work investigated the microDiamond as a cross-calibration detector for determination of ion chamber magnetic field correction factors via the ratio of the microDiamond and an ion chamber measured on both a conventional linac and a MRI-linac. The microDiamond was investigated due to the small energy dependence [25] and small magnetic field correction factor [26] associated with the detector.
The aim of this work was to develop and investigate a method to measure magnetic field correction factors using a microDiamond detector on a conventional linac. The suitability of the proposed method for either measurement of correction factors or validation of previously published correction factors was also assessed.
Details on the theory, assumptions and methods for using a microDiamond to perform a cross-calibration to determine an ion chamber magnetic field correction factor are presented below. In brief, a ratio of the response of an ion chamber and microDiamond was measured on a conventional linac and compared to similar measurements on the MRI-linac. Corrections for influence factors were applied to the measured response of the ion chamber and microDiamond. As described in the theory section, the difference between the ratios measured on a conventional linac and MRI-linac was used to calculate the ion chamber magnetic field correction factor once all corrections and assumptions were accounted for.
The absorbed dose to water at a particular beam quality measured by the ion chamber,
Eqs 1, 2 were converted to measured charge, calibration factors, beam quality correction factors and magnetic field correction factors as shown in Eqs 3, 4.
This work assumed that
Based on the assumptions described above, the microDiamond can be used to cross-calibrate the ion chamber response between a conventional linac and MRI-linac using a re-arrangement of Eqs 3, 4 for the magnetic field correction factor as shown in Eq. 5. The conversion between Eqs 3–5 is shown in the Supplementary Material.
Beam quality correction factors for both the ion chambers and microDiamond were then applied. The beam quality correction factors for the ion chambers,
Once the beam quality correction factors for the microDiamond were measured, Eq. 5 simplifies to Eq. 7 to calculate the ion chamber magnetic field correction factor.
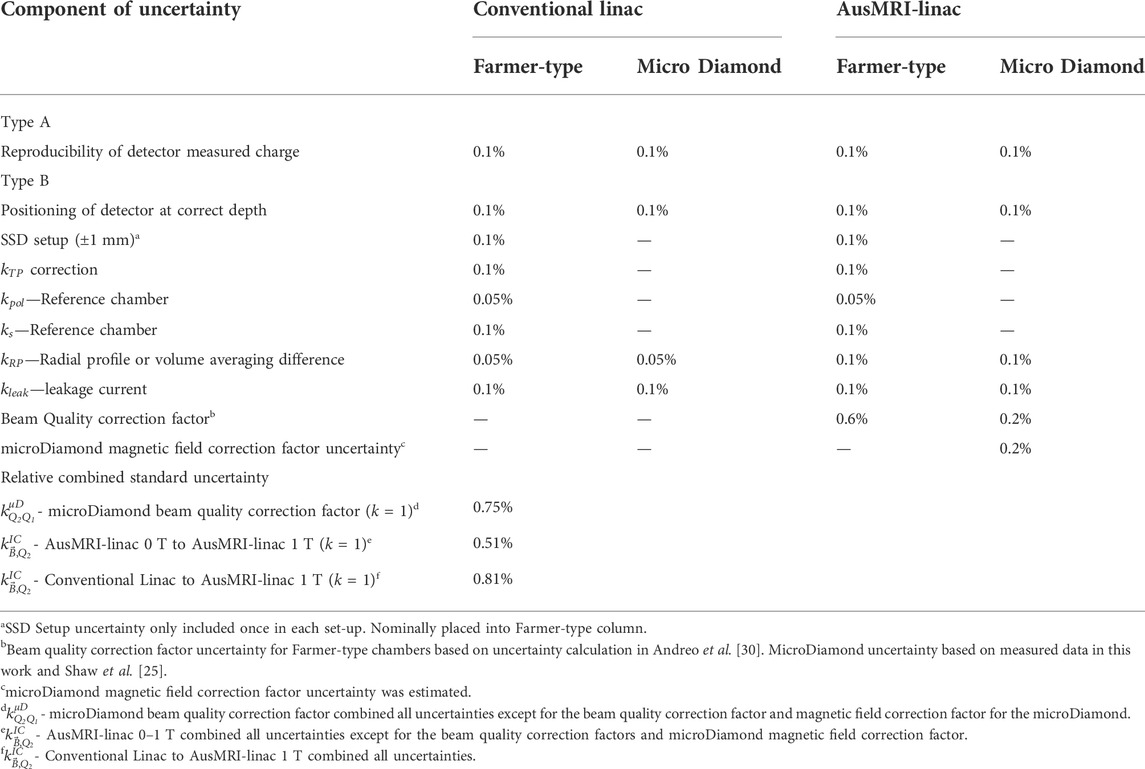
TABLE 1. Uncertainty analysis for the microDiamond beam quality correction factor (
As described elsewhere [3, 31, 32], the Australian MRI-linac (AusMRI-linac) is a parallel MRI-linac with a bespoke 1 T split bore magnet (Agilent Technologies Inc. United States) and a Varian Linatron (Varian Medical Systems, Inc., United States) radiation source aligned with the radiation beam central axis parallel to the constant magnetic field,
The Elekta Unity (Elekta AB, Stockholm, Sweden) is a perpendicular MRI-linac with a 1.5 T magnet and a 7 MV FFF beam aligned perpendicular to the
The conventional linac used in this work was an Elekta Synergy. The 6X flattened beam had a beam quality of
This work used a PTW microDiamond (PTW Freiburg Gmbh, Freiburg, Germany) to measure the magnetic field correction factor for a Scanditronix Wellhofer FC65-G (s/n: 819, IBA Dosimetry GmbH, Schwarzenbruck, Germany) and a PTW30013 0.6cc (s/n: 10066, PTW Freiburg Gmbh) ion chamber. A CC13 chamber (s/n: 15996, IBA Dosimetry GmbH) was set up between the source and MLC on the AusMRI-linac as an external monitor chamber to correct for variations in linac output within repeat measurements. No external monitor chamber was used for either the conventional linac or Elekta Unity.
The microDiamond has a cylindrical shape with the long axis of the cylinder orientated from the stem to the front flat face (Figure 1A). A thin sensitive detector volume is located perpendicular to the long axis at 1 mm depth from the end of the cylinder. The thin detector is made from synthetic diamond and has a sensitive volume thickness of 1 µm and radius of 1.1 mm [36]. When irradiated with the front facing the source, i.e., with the cylindrical end toward the source, the microDiamond is symmetric along the long axis of the cylinder. When irradiated in an “edge on” orientation, the microDiamond is not rotationally symmetric due to the presence of metallic contacts as shown by the 90° rotation between the aligned contacts and lateral contacts orientations in the MV EPID images in Figure 1B.
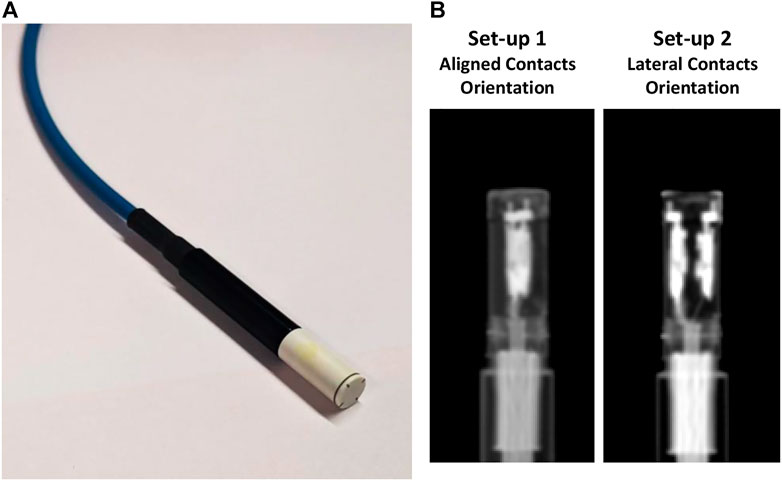
FIGURE 1. (A) The microDiamond detector. The long axis is from the stem to the front face. Measurements on the AusMRI-linac were through the front face. Measurements on the Unity were perpendicular to the long axis in an “edge on” orientation. MicroDiamond set up for measurements on conventional linacs, used for calculation of magnetic field correction factors, replicated the set-up on each of the MRI-linacs. (B) MV EPID image of the microDiamond in the two edge on set-ups used for determination of magnetic field correction factors from a conventional linac to a perpendicular MRI-linac. Set-up 1 has the contacts aligned with the beam axis in an anterior and posterior position relative to the collecting volume. Set-up 2 has contacts laterally positioned relative to the collecting volume.
The set-up at 1 T on the AusMRI-linac was at 1819 mm source to isocenter distance, 100 mm depth and a 9.7 cm × 9.7 cm field. The beam was horizontal through a window on the water tank and therefore the effective thickness of the window was included in the 100 mm depth. The water tank window thickness was 8.9 mm of Perspex for an effective thickness of 10.6 mm. The microDiamond chamber was set-up with the front facing towards the radiation source. The central axis of the chamber and the effective point of measurement of the microDiamond were set at 100 mm depth. No changes in water tank set-up were made between measurements of the microdiamond and ion chamber. A 0 T measurement on the AusMRI-linac was acquired by moving the chamber and water-tank to the low magnetic field point and maintaining a consistent source to chamber distance and field size. The AusMRI-linac beam quality has been shown to not vary between 0 and 1 T [31].
The set-up on the Elekta Unity used a vertical beam at a source to isocenter distance of 1,432 mm. A 10 cm × 10 cm field was used. The vertical beam allows detector set-up as per the description in AAPM TG106 [37]. Detectors were set-up at isocenter distance, with a 0.1 mm positional accuracy of the water tank control mechanism. The central axis of the Farmer-type chambers was set up at 100 mm depth. The microDiamond chamber was set-up in an “edge on” orientation, with the central long axis of the microDiamond parallel to the
MicroDiamond detectors used in edge on orientation have a rotational dependence that can be up to 2% in variation [25, 38] and is likely due to the presence of the metallic contacts. Two different set-ups were used to investigate any differences caused by the microDiamond rotation when measuring between the conventional linac and the Elekta Unity MRI-linac (Figure 1B). Images were acquired on a conventional linac with the microDiamond deliberately shifted closer to the source to improve MV EPID quality. Set-up one was with the microDiamond contacts anterior and posterior to the collecting volume aligned with the beam central axis (referred to from here on as the aligned contacts orientation). Set-up two was with the contacts laterally positioned to the collecting volume relative to the beam central axis (referred to from here on as the lateral contacts orientation). The lateral contacts orientation was a 90° rotation from the aligned contacts orientation. Measurements on the Elekta Unity with either an aligned contacts orientation or lateral contacts orientation were only compared to similar contact orientation measurements acquired on a conventional linac.
Source to chamber, field size, detector orientation and beam incident angle on the water tank for measurements set-ups on the AusMRI-linac and Elekta Unity were replicated on a conventional Elekta Linac for the respective measurements at 0 T.
Separate measurement series were acquired for the conventional linac, the AusMRI-linac at 0 T, the AusMRI-linac at 1 T and the Elekta Unity. Each measurement series consisted of a measurement of the ratio between an ion chamber and microDiamond. Three repeat measurement series were acquired on separate days for each of the conventional linac, AusMRI-linac at 0 T and AusMRI-linac at 1 T with the average of the three measurement series used in the calculations. One measurement series was acquired for the Elekta Unity. Each series consisted of a full removal and re-setup of the equipment, measurement and application of polarity and recombination for the ion chambers and at minimum three repeat measurements per detector. Measurements for both ion chambers were acquired as part of all measurement series. The series from the conventional linac and AusMRI-linac at 0 T were combined to measure the microDiamond beam quality correction factor. The series from the AusMRI-linac at 0 T to AusMRI-linac at 1 T were combined to investigate if the microDiamond was affected by the magnetic field. The series from the conventional linac and AusMRI-linac at 1 T was used to measure
Measurements on the AusMRI-linac were with the microDiamond front face toward the source. The microDiamond was rotationally symmetric in this orientation, therefore there was no investigation into differences in
The AusMRI-linac volume averaging value for the Farmer-type detector was 1.0016. The value was calculated and applied as per IAEA TRS-483 [28]. The Elekta Unity volume averaging value for the Farmer-type detector was 1.0022 and was from previously published data [15]. No volume averaging correction was applied for the conventional linac for Farmer-type detectors as it was a flattened beam. No volume averaging corrections were applied for the microDiamond.
The change in response of the microDiamond due to the change in beam quality was measured via Eq. 6 using the measurement series acquired on the conventional linac and AusMRI-linac at 0 T (Q1 and Q2 respectively). This is shown in Figure 2A. Three repeat measurement series of the ratio between an ion chamber and microDiamond were acquired on both the conventional linac and AusMRI-linac at 0 T. The average of the ratios measured in each measurement series from the conventional linac and AusMRI-linac at 0 T were used to calculate the change in microDiamond response due to the change in beam quality. This was repeated for each chamber and an average of the beam quality correction factor for the microDiamond measured from both chambers was used in the calculation of the magnetic field correction factor from the conventional linac to the AusMRI-linac at 1 T. The ion chamber beam quality correction factors (
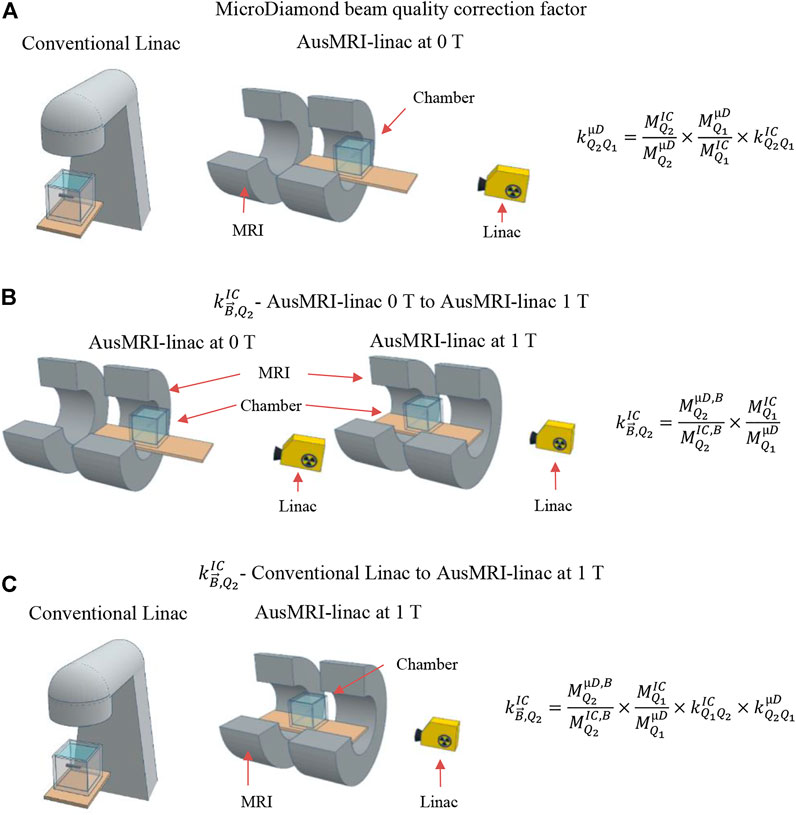
FIGURE 2. Schematic of the different measurements. (A) The microDiamond beam quality correction,
The measurement series acquired on the AusMRI-linac at 0 and 1 T was used to measure the impact of the parallel MRI-linac magnetic field on the microDiamond response. Since the AusMRI-linac can be set-up at both 0 and 1 T, the
Once the microDiamond beam quality correction factor was measured and the assumption that the microDiamond was not impacted by the magnetic field validated, the overall calculation of
A fourth measurement series, acquired between a conventional linac and an Elekta Unity at 1.5 T, was used to investigate the applicability of the method for commercial systems. As 0 T measurements on the Elekta Unity were not available, the microDiamond beam quality correction factor was assumed to be 1.0 [25] and the microDiamond magnetic field correction factor was assumed to be 1.0 [26]. Both the aligned and lateral contact set-ups shown in Figure 1B were collected to investigate the impact of the placement of the contacts on the measured magnetic field correction factor. Alignment of the contacts was kept consistent across the measurement series. Three repeat measurement series of the ratio between an ion chamber and microDiamond were acquired on the conventional linac. One measurement series was acquired on the Elekta Unity. The chamber and microDiamond long axis were both pointing into the Elekta Unity bore. The ion chamber beam quality correction factors (
The uncertainty for the three measurements between the conventional linac and the AusMRI-linac is shown in Table 1 as all three measurements have similar uncertainties. The reproducibility of the measured charge for both the Farmer and microDiamond chambers was estimated via the coefficient of variation from measurements. Depth uncertainty was a combination of wall thickness measurement, depth position indicator length, depth position set-up reproducibility and chamber cap thickness. Wall thickness, depth position and chamber cap thickness were measured with Vernier calipers with the uncertainty component being half the smallest scale division. This depth uncertainty was converted into a percentage via the dose gradient of the AusMRI-linac at 100 mm depth (0.4%/mm). SSD set-up of the tank uncertainty was based on 1/R2 correction. Tank set-up was not changed between detector measurements at each magnetic field strength and was therefore only included once for each measurement series. Uncertainties for temperature, pressure, polarity, recombination, leakage and volume averaging were included for Farmer-type chambers based on the factors given in AAPM TG-51 addendum [39]. Uncertainty for volume averaging and leakage of the microDiamond was estimated based on the volume averaging uncertainty of an ion chamber and the observed leakage during use respectively.
The relative combined standard uncertainty for the microDiamond beam quality correction factor combined the above uncertainties with the beam quality uncertainty for the ion chamber. The relative combined standard uncertainty for the magnetic field correction factor as calculated via measurements on the AusMRI-linac at 0 and 1 T, combined all uncertainties except for the uncertainty in the beam quality correction factor for both the Farmer-type detectors and the microDiamond as well as the uncertainty in the microDiamond due to in the magnetic field. The results from these measurements were used to estimate the uncertainty in the microDiamond magnetic field correction factor. The relative combined standard uncertainty for the magnetic field correction factor as calculated via measurements on the conventional linac and AusMRI-linac at 1 T combined all uncertainties. All uncertainties were combined via quadratic sum. The uncertainty coverage factor, k, used to obtain an expanded uncertainty was equal to one [40]. Results are presented with the coverage factor used to calculate the uncertainty.
The relative combined standard uncertainty for the ion chamber magnetic field correction factor, as measured via a conventional linac to Elekta Unity is shown in Table 2. The reproducibility of the measured charge for both the Farmer and microDiamond chambers was estimated via the coefficient of variation from measurements. Positioning of the detectors at the correct depth in 0 T conditions on a conventional linac used a water tank with 0.1 mm precision. Positioning of the detectors at the correct depth on the Elekta Unity used a combination of detector positioning at the isocenter using EPID orthogonal images and the water depth set via re-positioning the isocenter aligned detector vertically towards the source by 100 mm, with a water tank movement precision of 0.1 mm, and then filling the tank to the appropriate level. This was combined into a 0.3 mm positional uncertainty. The uncertainty in depth was converted to a dose uncertainty via an estimated dose gradient of 0.3%/mm based on PDD curves [35]. SSD set-up of the tank was based on 1/R2 correction. Tank set-up was not changed between detector measurements at each magnetic field strength and was therefore only included once for each measurement.
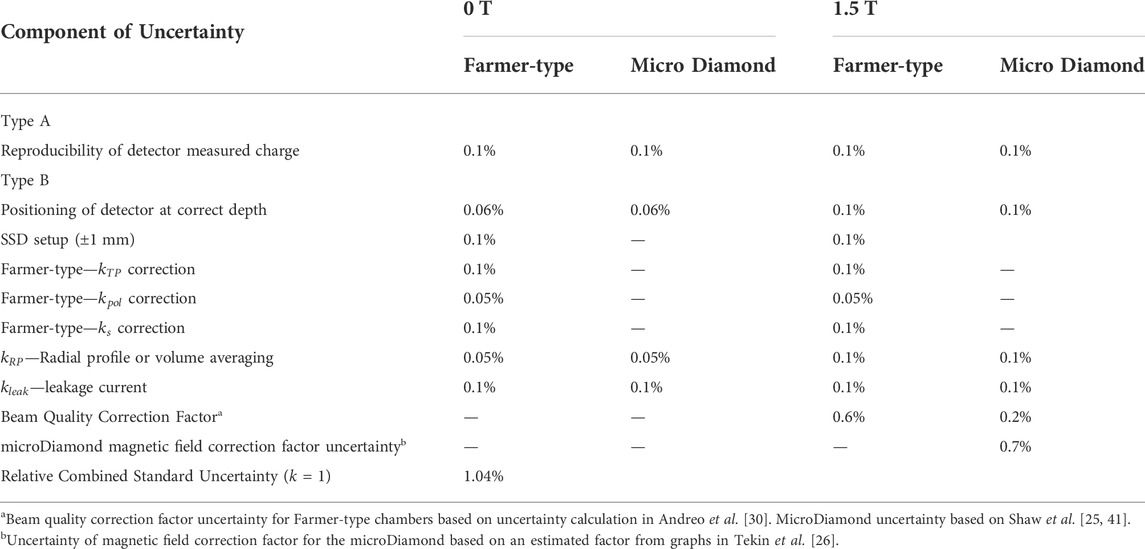
TABLE 2. Uncertainty analysis for
Uncertainties for temperature, pressure, polarity, reproducibility, leakage and volume averaging were included for Farmer-type chambers. A Type B uncertainty was included for the Farmer-type beam quality correction factor based on the uncertainty in beam quality correction factors [30]. A Type B uncertainty was included for the microDiamond beam quality correction factor based on the data in Shaw et al. [25, 41]. Uncertainty in the microDiamond magnetic field correction factor was based on estimated factors [26]. Quadratic sum was used to calculate the relative combined standard uncertainty.
Measurements series from a conventional linac and the AusMRI-linac at 0 T were used to determine the beam quality correction factor for the microDiamond. The results are shown in Figure 3A. The measured
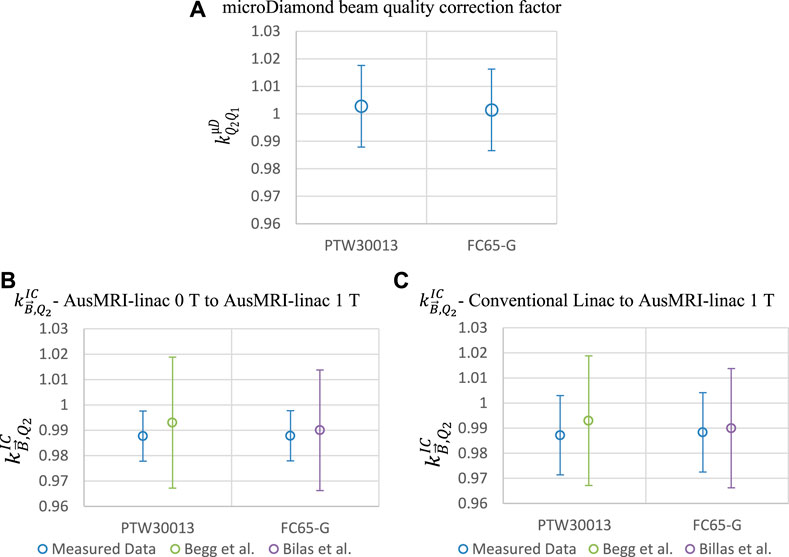
FIGURE 3. (A) microDiamond beam quality correction factor measured via conventional linac and AusMRI-linac at 0 T. (B) Magnetic field correction factor,
Measurements between the AusMRI-linac at 0 and 1 T investigated the assumption that the microDiamond was unaffected by the magnetic field. The results are shown in Figure 3B. The measured
The ion chamber
The response of both the microDiamond and Farmer-type chambers on a conventional linac and Elekta Unity at 1.5 T investigated using the microDiamond to calculate the
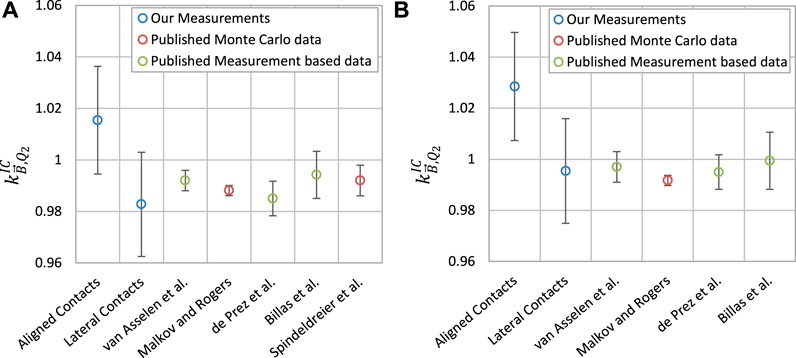
FIGURE 4. Measured
Magnetic field correction factors,
Measurements between a conventional linac and the AusMRI-linac at 0 T were used to measure the microDiamond beam quality correction factor (
Measurements between the AusMRI-linac at 0 and 1 T isolated the change in response of the Farmer-type chambers to only the magnetic field. The measurements investigate the assumption that the microDiamond response is not impacted by the magnetic field.
The measured
For the PTW30013, the measured
Our measured
Measurements between the conventional linac and AusMRI-linac at 1 T were used to measure the magnetic field correction factor in a scenario where the MRI-linac 0 T field was not available. This measurement includes ion chamber and microDiamond corrections and uncertainties for the beam quality and the microDiamond which was assumed to not be impacted by the magnetic field.
The measured
The uncertainty associated with the measurement from a conventional linac to an AusMRI-linac at 1 T was large (∼0.8%, k = 1) which was an improvement compared to the uncertainties associated with the previously published measurements [17, 18]. The largest components of the uncertainty are the beam quality correction factors for the Farmer-type (0.6%) and microDiamond (0.2%) and the microDiamond magnetic field correction factor (0.2%). Improved understanding of the beam quality dependence of the Farmer-type chambers and microDiamond could reduce these uncertainties and therefore reduce the overall uncertainty. Monte Carlo simulations would be required to confirm that the microDiamond is not impacted by the magnetic field.
Measurements between a conventional linac and the Elekta Unity were used to investigate the use of a microDiamond, on a perpendicular MRI-linac, to measure the magnetic field correction factor.
Our results show a difference in the calculated magnetic field correction factor for the ion chamber dependent on the rotational set-up of the microDiamond (see Figure 1B for details on contact rotational set-ups). The aligned contacts set-up was consistently higher than previously published values for both chambers. The lateral contacts set-up showed agreement with published values.
The PTW30013 set-up 2 result was slightly lower than published values, however the result still shows agreement within uncertainties. The FC65-G set-up 2 results agree with published values.
The difference between the aligned and lateral contacts set-ups is the likely source of the response difference observed with the rotation of the microDiamond. Shaw et al. [25] showed differences in detector response between a conventional linac and Elekta Unity dependent on the rotation of the microDiamond, however the alignment of the contacts with rotational angle was not shown. Tekin et al. [26] showed that the response of the sensitive volume varied depending on the density of components upstream and downstream from the volume. For the inline orientation set-up, the contacts on either side of the sensitive volume are up and down-stream and therefore could be impacting the output in the magnetic field. When the contacts are lateral to the sensitive volume, they may have less impact on the sensitive volume. Monte Carlo simulations of the magnetic field correction factor, simulated using a non-rotationally symmetric microDiamond model which includes the contacts in the orientations described in this work, could be used to verify the impact of the contacts on the response.
The uncertainties presented in this work were large compared to published Monte Carlo simulations [13, 14] and alternative methods of measuring magnetic field correction factors [8, 15, 16]. Monte Carlo simulations [13, 14] and measurements from van Asselen et al. [8] and Billas et al. [16] only include Type A uncertainties which could underestimate the uncertainty of the correction factor. The results from de Prez et al. [15] show a much smaller uncertainty, however access to a MRI-linac compatible calorimeter as used in their work is limited.
Our measurement of the magnetic field correction factor using the microDiamond to transfer between a conventional linac to the Elekta Unity used two assumptions. The first was that the microDiamond was unaffected by the magnetic field. This was based on simulations from Tekin et al. [26] where the rotational orientation is not known. Increased uncertainty was added for the effect of the magnetic field on the microDiamond in this work to account for this. The second assumption was that the beam quality difference between the conventional linac (
The results for the parallel MRI-linac indicate that the microDiamond can be used to calculate the magnetic field correction factor using measurements on a conventional linac and MRI-linac. However, the beam quality changes and susceptibility of the detector to the magnetic field impact the uncertainty.
The results for the conventional linac to Elekta Unity demonstrate the applicability of using the microDiamond to calculate the correction factor on perpendicular systems. To fully utilize the detector for this purpose, the microDiamond beam quality dependence and magnetic field correction in an edge on orientation needs validation. For the beam quality dependence, a ratio measurement on the MRI-linac during magnet ramp down, similar to the measurement presented in this work between the conventional and AusMRI-linac at 0 T, would be sufficient to determine the beam quality dependence. Monte Carlo simulations could also be used to investigate beam quality dependence. MicroDiamond magnetic field susceptibility can be validated by simulations in the edge on orientation which take into account the different rotational orientations of the contacts.
An alternative option is to combine ratio measurements from the Elekta Unity at 0 T and at 1.5 T. These measurements could be acquired during a magnet ramp down. This would remove the uncertainty due to the microDiamond beam quality dependence reducing the uncertainty from 1.04% to 0.82%. Measuring the microDiamond and chamber ratios during a magnet ramp down would be analogous to the measurements on the AusMRL at 0 and 1 T as well as the measurements presented by van Asselen et al. [8]. However, this would limit using this method to periods where the magnetic field was ramped down.
If a department had access to a calibrated chamber in the magnetic field, then a simple cross-calibration of the chambers in the magnetic field would be sufficient for dose measurement purposes. This method would eliminate the need for a magnetic field correction factor as it would be inherent in the ion chamber calibration factor,
For both types of MRI-linac, the use of a microDiamond to calculate the magnetic field correction factor from a conventional linac was achievable. However, the use of this method for sole calculation of the correction factor is limited by the large uncertainties. The method demonstrated in this work can be used to verify detectors agree with published correction factors.
The large uncertainties associated with the ion chamber and microDiamond beam quality corrections result in large uncertainties when measuring
Our results show the microDiamond still has a beam quality and magnetic field dependence. Finding a suitable energy and magnetic field independent detector to use as a transfer could reduce uncertainties.
The work presented investigates a proposed method of using a microDiamond to measure magnetic field correction factors for ion chambers using measurements on a conventional linac and MRI-linac. Measurements between the conventional linac and AusMRI-linac at 0 T determined the beam quality correction factor for the microDiamond to be negligible. Measurements on the AusMRI-linac at 0 and 1 T showed the microDiamond could have a small magnetic field correction factor when used on parallel MRI-linacs. Measurements between a conventional linac and the AusMRI-linac at 1 T were used to calculate magnetic field correction factors of 0.988 ± 0.016 (k = 2) and 0.987 ± 0.016 (k = 2) for a FC65-G and PTW30013 respectively at a beam quality of
The raw data supporting the conclusion of this article will be made available by the authors, without undue reservation.
Author JB developed theory, developed measurement methodology, acquired measurements and wrote manuscript drafts. Authors UJ, PK and LH contributed to development of theory and measurement methodology. Author UJ contributed to acquisition of measurements. All authors (JB, UJ, PK, GL and LH) reviewed manuscript draft and final submitted version.
JB has received an Australian Government Research Training Program Scholarship. The Australian MRI-linac is funded via NHMRC Program Grant 1036078.
The authors would like to acknowledge the University of Wollongong for the use of the microDiamond.
The authors declare that the research was conducted in the absence of any commercial or financial relationships that could be construed as a potential conflict of interest.
All claims expressed in this article are solely those of the authors and do not necessarily represent those of their affiliated organizations, or those of the publisher, the editors and the reviewers. Any product that may be evaluated in this article, or claim that may be made by its manufacturer, is not guaranteed or endorsed by the publisher.
The Supplementary Material for this article can be found online at: https://www.frontiersin.org/articles/10.3389/fphy.2022.925890/full#supplementary-material
1. Lagendijk JJ, Raaymakers BW, van Vulpen M. The magnetic resonance imaging-linac system. Semin Radiat Oncol (2014) 24(3):207–9. doi:10.1016/j.semradonc.2014.02.009
2. Mutic S, Dempsey JF. The ViewRay system: Magnetic resonance-guided and controlled radiotherapy. Semin Radiat Oncol (2014) 24(3):196–9. doi:10.1016/j.semradonc.2014.02.008
3. Keall PJ, Barton M, Crozier S. The Australian magnetic resonance imaging–linac Program. Semin Radiat Oncol (2014) 24(3):203–6. doi:10.1016/j.semradonc.2014.02.015
4. Fallone BG. The rotating biplanar linac-magnetic resonance imaging system. Semin Radiat Oncol (2014) 24(3):200–2. doi:10.1016/j.semradonc.2014.02.011
5. Raaijmakers AJ, Raaymakers BW, Lagendijk JJ. Magnetic-field-induced dose effects in MR-guided radiotherapy systems: Dependence on the magnetic field strength. Phys Med Biol (2008) 53(4):909–23. doi:10.1088/0031-9155/53/4/006
6. Bielajew AF. The effect of strong longitudinal magnetic fields on dose deposition from electron and photon beams. Med Phys (1993) 20(4):1171–9. doi:10.1118/1.597149
7. Meijsing I, Raaymakers BW, Raaijmakers AJ, Kok JG, Hogeweg L, Liu B, et al. Dosimetry for the MRI accelerator: The impact of a magnetic field on the response of a farmer NE2571 ionization chamber. Phys Med Biol (2009) 54(10):2993–3002. doi:10.1088/0031-9155/54/10/002
8. van Asselen B, Woodings SJ, Hackett SL, van Soest TL, Kok JGM, Raaymakers BW, et al. A formalism for reference dosimetry in photon beams in the presence of a magnetic field. Phys Med Biol (2018) 63(12):125008. doi:10.1088/1361-6560/aac70e
9. O'Brien DJ, Roberts DA, Ibbott GS, Sawakuchi GO. Reference dosimetry in magnetic fields: Formalism and ionization chamber correction factors. Med Phys (2016) 43(8):4915–27. doi:10.1118/1.4959785
10. Pojtinger S, Kapsch RP, Dohm OS, Thorwarth D. A finite element method for the determination of the relative response of ionization chambers in MR-linacs: Simulation and experimental validation up to 1.5 T. Phys Med Biol (2019) 64(13):135011. doi:10.1088/1361-6560/ab2837
11. Gargett M, Oborn B, Metcalfe P, Rosenfeld A. Monte Carlo simulation of the dose response of a novel 2D silicon diode array for use in hybrid MRI–LINAC systems. Med Phys (2015) 42(2):856–65. doi:10.1118/1.4905108
12. de Pooter JA, Billas I, de Prez LA, Duane S, Kapsch RP, Karger C, et al. Reference dosimetry in MRI-linacs: Evaluation of available protocols and data to establish a code of practice. Phys Med Biol (2020) 66:05TR02. doi:10.1088/1361-6560/ab9efe
13. Malkov VN, Rogers DWO. Monte Carlo study of ionization chamber magnetic field correction factors as a function of angle and beam quality. Med Phys (2018) 45(2):908–25. doi:10.1002/mp.12716
14. Spindeldreier CK, Schrenk O, Bakenecker A, Kawrakow I, Burigo L, Karger CP, et al. Radiation dosimetry in magnetic fields with farmer-type ionization chambers: Determination of magnetic field correction factors for different magnetic field strengths and field orientations. Phys Med Biol (2017) 62(16):6708–28. doi:10.1088/1361-6560/aa7ae4
15. de Prez L, Woodings S, de Pooter J, van Asselen B, Wolthaus J, Jansen B, et al. Direct measurement of ion chamber correction factors, k Q and k B, in a 7 MV MRI-linac. Phys Med Biol (2019) 64(10):105025. doi:10.1088/1361-6560/ab1511
16. Billas I, Bouchard H, Oelfke U, Duane S. Traceable reference dosimetry in MRI guided radiotherapy using alanine: Calibration and magnetic field correction factors of ionisation chambers. Phys Med Biol (2021) 66(16):165006. doi:10.1088/1361-6560/ac0680
17. Begg J, Jelen U, Keall PJ, Liney GP, Holloway L. Experimental characterisation of the magnetic field correction factor, kB , for Roos chambers in a parallel MRI-linac. Phys Med Biol (2022) 67:095017. doi:10.1088/1361-6560/ac66b8
18. Billas I, Homer M, Duane S. Report on dose measurements on the MRI-linac at Liverpool Hospital (Australia) performed by NPL (2018). https://eprintspublications.npl.co.uk/7731/.
19. de Prez L, de Pooter J, Jansen B, Woodings S, Wolthaus J, van Asselen B, et al. Commissioning of a water calorimeter as a primary standard for absorbed dose to water in magnetic fields. Phys Med Biol (2019) 64(3):035013. doi:10.1088/1361-6560/aaf975
20. D'Souza M, Nusrat H, Iakovenko V, Keller B, Sahgal A, Renaud J, et al. Water calorimetry in MR‐linac: Direct measurement of absorbed dose and determination of chamber. Med Phys (2020) 47(12):6458–69. doi:10.1002/mp.14468
21. Krauss A, Spindeldreier CK, Klüter S. Direct determination of kB⃗, Q, Q0 for cylindrical ionization chambers in a 6 MV 0.35 T MR-linac. Phys Med Biol (2020) 65(23):235049. doi:10.1088/1361-6560/abab56
22.M McEwen, V Malkov, B Muir, and A Sarfehnia, editors. Verification of the output calibration of MR-linac beams using reference alanine dosimeters. NJ USA: WILEY (2020). MEDICAL PHYSICS.
23. Pojtinger S, Nachbar M, Ghandour S, Pisaturo O, Pachoud M, Kapsch RP, et al. Experimental determination of magnetic field correction factors for ionization chambers in parallel and perpendicular orientations. Phys Med Biol (2020) 65(24):245044. doi:10.1088/1361-6560/abca06
24. Pojtinger S, Dohm OS, Kapsch RP, Thorwarth D. Ionization chamber correction factors for MR-linacs. Phys Med Biol (2018) 63(11):11NT03. doi:10.1088/1361-6560/aac4f2
25. Shaw M, Lye J, Alves A, Keehan S, Lehmann J, Hanlon M, et al. Characterisation of a synthetic diamond detector for end-to-end dosimetry in stereotactic body radiotherapy and radiosurgery. Phys Imaging Radiat Oncol (2021) 20:40–5. doi:10.1016/j.phro.2021.10.002
26. Tekin T, Blum I, Delfs B, Schönfeld A-B, Kapsch R-P, Poppe B, et al. The dose response of high-resolution diode-type detectors and the role of their structural components in strong magnetic field. Med Phys (2020) 47(12):6509–18. doi:10.1002/mp.14535
27. Andreo P, Burns D, Hohlfeld K, Huq M, Kanai T, Laitano F, et al. TRS-398: Absorbed dose determination in external beam radiotherapy: An international code of practice for dosimetry based on standards of absorbed dose to water. Vienna: International Atomic Energy Agency (2001). p. 420.
28. Palmans H, Andreo P, Huq MS, Seuntjens J, Christaki KE, Meghzifene A. Dosimetry of small static fields used in external photon beam radiotherapy: Summary of TRS-483, the IAEA–AAPM international Code of Practice for reference and relative dose determination. Med Phys (2018) 45(11):e1123–45. doi:10.1002/mp.13208
29. Reynolds M, Fallone BG, Rathee S. Dose response of selected solid state detectors in applied homogeneous transverse and longitudinal magnetic fields. Med Phys (2014) 41(9):092103. doi:10.1118/1.4893276
30. Andreo P, Burns DT, Kapsch RP, McEwen M, Vatnitsky S, Andersen CE, et al. Determination of consensus kQ values for megavoltage photon beams for the update of IAEA TRS-398. Phys Med Biol (2020) 65(9):095011. doi:10.1088/1361-6560/ab807b
31. Begg J, Alnaghy SJ, Causer T, Alharthi T, George A, Glaubes L, et al. Technical Note: Experimental characterization of the dose deposition in parallel MRI-linacs at various magnetic field strengths. Med Phys (2019) 46(11):5152–8. doi:10.1002/mp.13767
32. Jelen U, Dong B, Begg J, Roberts N, Whelan B, Keall P, et al. Dosimetric optimization and commissioning of a high field inline MRI-linac. Front Oncol (2020) 10(136). doi:10.3389/fonc.2020.00136
33. Whelan B, Kolling S, Oborn BM, Keall P. Passive magnetic shielding in MRI-Linac systems. Phys Med Biol (2018) 63(7):075008. doi:10.1088/1361-6560/aab138
34. Roberts NF, Patterson E, Jelen U, Causer T, Holloway L, Liney G, et al. Experimental characterization of magnetically focused electron contamination at the surface of a high‐field inline MRI‐linac. Med Phys (2019) 46(12):5780–9. doi:10.1002/mp.13847
35. Woodings SJ, Bluemink JJ, de Vries JHW, Niatsetski Y, van Veelen B, Schillings J, et al. Beam characterisation of the 1.5 T MRI-linac. Phys Med Biol (2018) 63(8):085015. doi:10.1088/1361-6560/aab566
36. Marinelli M, Prestopino G, Verona C, Verona-Rinati G. Experimental determination of the PTW 60019 microDiamond dosimeter active area and volume. Med Phys (2016) 43(9):5205–12. doi:10.1118/1.4961402
37. Das IJ, Cheng CW, Watts RJ, Ahnesjo A, Gibbons J, Li XA, et al. Accelerator beam data commissioning equipment and procedures: Report of the TG-106 of the therapy Physics committee of the AAPM. Med Phys (2008) 35(9):4186–215. doi:10.1118/1.2969070
38. Brace OJ, Alhujaili SF, Paino JR, Butler DJ, Wilkinson D, Oborn BM, et al. Evaluation of the PTW microDiamond in edge-on orientation for dosimetry in small fields. J Appl Clin Med Phys (2020) 21(8):278–88. doi:10.1002/acm2.12906
39. Almond PR, Biggs PJ, Coursey BM, Hanson WF, Huq MS, Nath R, et al. AAPM's TG-51 protocol for clinical reference dosimetry of high-energy photon and electron beams. Med Phys (1999) 26(9):1847–70. doi:10.1118/1.598691
40.Joint Committee for Guides in Metrology. Evaluation of measurement data—guide to the expression of uncertainty in measurement. JCGM 100:2008 (2008). p. 1–116.
42. Laub WU, Crilly R. Clinical radiation therapy measurements with a new commercial synthetic single crystal diamond detector. J Appl Clin Med Phys (2014) 15(6):92–102. doi:10.1120/jacmp.v15i6.4890
Keywords: magnetic field correction factor, MRgRT, MRI-linac, microDiamond, MRL, reference dosimetry
Citation: Begg J, Jelen U, Keall P, Liney G and Holloway L (2022) Ion chamber magnetic field correction factors measured via microDiamond cross-calibration from a conventional linac to MRI-linac. Front. Phys. 10:925890. doi: 10.3389/fphy.2022.925890
Received: 22 April 2022; Accepted: 25 August 2022;
Published: 14 October 2022.
Edited by:
Peter Homolka, Medical University of Vienna, AustriaReviewed by:
Marcel Nachbar, University of Tübingen, GermanyCopyright © 2022 Begg, Jelen, Keall, Liney and Holloway. This is an open-access article distributed under the terms of the Creative Commons Attribution License (CC BY). The use, distribution or reproduction in other forums is permitted, provided the original author(s) and the copyright owner(s) are credited and that the original publication in this journal is cited, in accordance with accepted academic practice. No use, distribution or reproduction is permitted which does not comply with these terms.
*Correspondence: Jarrad Begg, amFycmFkLmJlZ2dAaGVhbHRoLm5zdy5nb3YuYXU=
Disclaimer: All claims expressed in this article are solely those of the authors and do not necessarily represent those of their affiliated organizations, or those of the publisher, the editors and the reviewers. Any product that may be evaluated in this article or claim that may be made by its manufacturer is not guaranteed or endorsed by the publisher.
Research integrity at Frontiers
Learn more about the work of our research integrity team to safeguard the quality of each article we publish.