- 1Department of Radiation Oncology, Peking University Third Hospital, Beijing, China
- 2Key Laboratory of Precision Opto-Mechatronics Technology of Ministry of Education, School of Instrumentation Science and Optoelectronics Engineering, Beihang University, Beijing, China
- 3Center of Basic Medical Research, Peking University Third Hospital Institute of Medical Innovation and Research, Beijing, China
- 4Medical Research Center, Peking University Third Hospital, Beijing, China
- 5Cancer Center, Peking University Third Hospital, Beijing, China
Radiotherapy is an effective treatment for certain patients with muscle-invasive bladder cancer and radio-sensitivity detection plays a vital role during bladder cancer radio treatment because radiotherapy responses have profound influences on a patient’s prognosis. Although several potential biomarkers were investigated to assess the radio-response of bladder cancer, studies on detecting radio-sensitivity based on morphological characteristics of cancer cells at the single-cell level are rare. In fact, morphological parameters are vital characteristics of cells that could provide direct information to infer the physiological statuses of cells and evaluate the response of cells to the external stimulations. In this study, digital holographic microscopy was applied to quantify morphological parameters of bladder cancer cells (HT-1376) at the single-cell level and their alterations after exposure to four different radiation doses, i.e., 0 Gy (control), 4, 8, and 12 Gy. Based on the reconstructed phase images, four morphological parameters of cells, namely, cell phase volume (CPV), cell projected area (CPA), cell average phase height (CAPH), and cell maximum phase height (CMPH), were quantitatively calculated. The results show that the change rates of CPV, CAPH, and CMPH were increased with the radiation dose rising, while the change rate of CPA was decreased with the radiation dose increasing. Moreover, the change rates of CPV, CPA, CAPH, and CMPH were different between control group and 12 Gy treated group. The results demonstrate that morphological characteristics have the potential to be utilized to estimate the radio-sensitivity of bladder cancer cells, and it may provide new perspectives to establishing label-free methods to detect radio-sensitivity and guide radiotherapy in bladder cancer.
1 Introduction
Bladder cancer (BC) is the 10th most common cancer worldwide, with an estimated 200,000 deaths in 2018 GLOBOCAN statistics [1]. For muscle-invasive BC (MIBC), which occupies approximately 25% of all cases, radiotherapy is an alternative treatment for patients who demand bladder preservation or with unresectable lesions [2]. However, the heterogeneity of BC response to radiotherapy results in inconsistent treatment outcomes. Exploiting a predictive strategy to improve the accuracy of radiotherapy delivery is an urgent clinical problem to be solved. Several potential biomarkers were studied to access the radio-response of BC, but all failed to guide clinical decision-making due to unrevealed clinical validation and correlation [3]. At present, the choice of radiotherapy still depends on the preference of patients and the clinical experience of radiologists. Therefore, prospectively and precisely predicting the radio-response of BC to assist clinical decision-making is a practical issue the clinician faced.
Ionizing radiation, as well as some other chemical drugs, could largely influence the cellular status and biological function. Meanwhile, comprehensive studies verified that the changes in biological alternation, including cell growth [4], intercellular communication [5], transcriptome, and proteome [6], were associated with cellular morphological phenotypes. Some specific morphological manifestations were even coordinated with the cell fate decisions [7]. These indicate that the response of cells to radiation may be evaluated via quantitative morphological observation.
Digital holographic microscopy (DHM) is a novel optical microscopic imaging technique that combined qualities found in optical microscopy and digital holography with the capability of quantitative phase microscopic imaging [8]. As a quantitative phase imaging method, DHM images the sample by measuring the optical path length delays introduced by the sample. Thus, no labeling or staining is necessary for living cell observation. This also means that the three-dimensional morphology of a living cell could be objectively quantified using optical path length, and thus multiple morphological parameters could be deduced based on the phase image of the living cell to describe its morphology quantitatively. As the optical path length delays introduced by the living cell is the product of the geometric length of the living cell and the refractive index difference between the sample and the medium, the phase image encodes the refractive index information of the living cell. Also, the refractive index of a living cell is linearly proportional to dry mass density [9]. Therefore, the biochemical parameters of a living cell could be inferred from the phase image, such as cellular dry mass and cellular dry mass density. Furthermore, DHM arranged in an off-axis configuration is capable of recording the phase image of the living cell in a single exposure with nanoscale sensitivity. Due to great advantages in living cell measurement, DHM has been widely applied in biomedical research, especially for measuring on morphological parameter changes in living cells [10].
In this study, we aimed to establish a method based on DHM to detect the radio-response of bladder cancer cells. DHM was applied to obtain the phase images of the cells and to retrieve the changes in cell morphological parameters, which were used to evaluate the radio-response of cells irradiated by different radiation dose. Cell morphological parameters including CPV, CPA, CAPH, and CMPH were quantitatively calculated from the reconstructed phase images. The change rates of morphological parameters manifest a closed relationship with radiation doses, where the change rates of CPV, CAPH, and CMPH were increased with the radiation doses rising, while the change rates of CPA were decreased with the radiation doses increasing. Moreover, the change rates of CPV, CPA, CAPH, and CMPH were different between control group and 12Gy treated group.
2 Methods
2.1 Cell culture and treatments
The human urothelial bladder cancer cell line HT-1376 (CRL-1472) was purchased and validated from Beijing Biotides Biotechnology Co., Ltd. Cells were grown in Eagle’s Minimum Essential (EME) Medium (Gibco, #11095080) supplemented with 10% fetal bovine serum (FBS) (Gibco, #10099141) and 1% penicillin streptomycin (Gibco, #15140122) at 37°C in 5% CO2 humidified incubator (Thermo HERAcell150i). Monthly, mycoplasma tests ensured Mycoplasma-negative cultures (TransDetect, FM311-01). The Automated Cell Counter named Countess™ II FL (Invitrogen, #AMQAF1000) was used for live-cell counting. Cells (1.5−3×10⁶/dish) were seeded in 30-mm glass-bottom cell culture dishes (NEST Scientific #801001) and incubated for 12 h, followed by radiation using a Varian Trilogy (SSD = 100 cm). For the treatment group, the cells were exposed to different dose of 6-MV X-rays at a dose rate of 300 cGy/min. The irradiated cells were then used for further DH microscope or biology analyses.
2.2 Biological characteristics of HT-1376 bladder cancer cell lines irradiated by different doses
2.2.1 Determining the viability of HT-1376 bladder cancer cell lines treated with different radiation doses
The HT-1376 cells were cultured and irradiated as mentioned above, followed by the cell viability detection using the cell counting kit (CCK-8 kit). Three doses of irradiation (4, 8, and 12 Gy) and a control group were included in this experiment. After irradiation, cells should be cultured for 48-h and reseeded in clear bottom 96-well plates at the optimum concentration, followed by culturing again for 12-h till they grow adhering. All the steps were performed according to the manufacturer’s instructions (CCK8 Dojindo CK04-05) and finally quantified on the microplate reader.
2.2.2 Determining proliferation ability of HT-1376 bladder cancer cell lines treated with different radiation doses
The HT-1376 cells were seeded and incubated in 6-well plates until adherent. After 8 Gy of X-ray radiation treatment, as described before, the cells were trypsinized to single-cell suspensions and seeded into 6-well plates in triplicate. At 14 days after seeding, colonies were stained with 0.5% crystal violet (Solarbio, #G1062), and the colonies with >50 cells were counted.
2.2.3 Determining migration ability of HT-1376 bladder cancer cell lines treated with different radiation doses
The HT-1376 cells were also seeded and incubated in 6-well plates. After 8 Gy of X-ray radiation treatment as described before, a 10 µl pipette tip was used to scrape a wound on the cell monolayers, images of the wound region were taken, and distance was measured by ImageJ software.
2.3 Digital holographic microscopy setup and data processing
2.3.1 Digital holographic microscopy setup
In this study, holograms of HT-1376 cells were recorded by the DH microscope setup sketched in Figure 1A. This setup is built in an afocal configuration, where the back focal plane of the microscope objective (MO) coincides with the front focal plane of the tube lens (TL), with the object placed at the front focal plane of the MO. A solid-state laser (532 nm, 100 mW, single-mode fiber output) is adopted and emits a coherent light that propagates through a collimating lens (L) to produce a plane wave. The polarizing beam splitter (PBS) splits this wave into two beams, one beam acts as the reference beam R, and the other beam is used as an illumination beam. In the object arm, the object beam O is formed after the illumination beam transmits through the condenser lens (CL), the object, the MO (Olympus UPLFLN, 20X, NA = 0.50), and the TL sequentially. A half-wave plate (HPW1) is positioned in front of the PBS to adjust the intensity ratio between R and O. Another half-wave plate (HPW2) is placed in the reference arm to make the polarization direction of O and R consistent. In the reference arm, a variable optical delay line (DL) is adopted to match both arms of the optical path precisely. After passing through the DL and being reflected by the mirror (M6) and the beam splitter (BS), R interferes with O with a small tile angle set by the M6. Thus, an off-axis hologram is formed and recorded by a charge-coupled device (CCD, 1024 × 1024 pixels, 5.86 μm, PointGrey, Canada). Figure 1B presents a hologram of HT-1376 cells captured by the DH microscope of Figure 1A, where high contrast interference fringes were observed. Figure 1C shows the reconstructed pseudo-three-dimensional phase maps of Figure 1B, it can be seen that CAPH varies in a very large range of about a few to dozen rad, manifesting the high heterogeneity of morphology of HT-1376 cells.
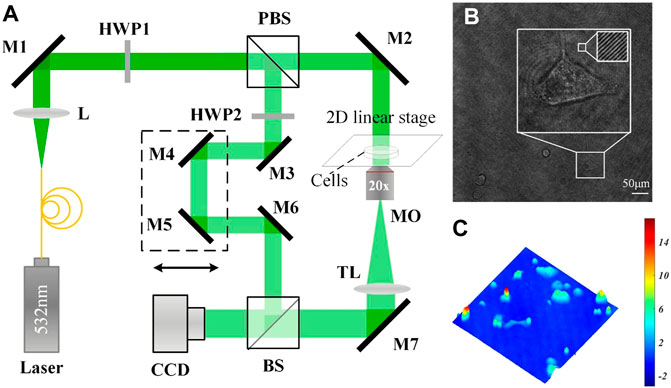
FIGURE 1. (A) Schematic of the DH microscope; (B) a single hologram with a dimension of 1024 × 1024 pixels captured by (A); and (C) a reconstructed pseudo-three-dimensional phase map from (B).
2.3.2 Hologram recording and phase reconstruction
To reveal the morphological alteration of HT-1376 cells introduced by different Ionizing radiation doses, i.e., 0 Gy (control), 4, 8, and 12 Gy, each group was observed once before and after radiation. Each group was first observed using a DH microscope and then taken to the radiation instrument to receive Ionizing radiation. After radiating, each group was brought back and placed under DH microscope to perform the second observation. The time interval of each group from the first observation to receive Ionizing radiation was about 30 min, and it also took about 30 min to bring back each group to perform the second observation. All observations were performed in cell culture dishes (NEST Scientific #801001).
In the hologram reconstruction process, the hologram’s zero-order and twin term was eliminated by the spatial-frequency domain filtering method [11], and the refocusing distance was automatically detected by the Tamura criterion [12]. The phase images were then reconstructed by the angular spectrum method, and the phase aberrations introduced by the off-axis geometry and optical elements were removed by the background phase fitting method [13]. After phase unwrapping, a phase offset operation was finally performed on the obtained phase images to make the average background phase value near the zero lines. The single-cell was extracted from the reconstructed phase images by the Otsu threshold segmentation algorithm [14], and the marker-based watershed segmentation algorithm was further applied when cells adhered together.
2.4 Calculation and analysis of cellular morphological parameters
2.4.1 Calculation of morphological parameters
To quantitatively describe the change in cell morphology, four parameters were taken into consideration and calculated from the reconstructed phase images, including CPV, CPA, CAPH, and CMPH.
DHM is a powerful quantitative phase imaging method that measures the optical phase delays to describe the sample quantitatively. In DHM, the sample is expressed by phase shift and could be written as:
where λ is the wavelength of the laser source, nc(x, y) is the average cellular refractive index in the spatial position (x, y), nm is the refractive index of the cellular culture medium, and h(x, y) is cell height along observation direction. Phase shift at (x, y) is referred to as cell phase height at (x, y). It can be seen that cell phase height at (x, y) is determined by both the average cellular refractive index at (x, y) and the cell height at (x, y). Usually, the cellular refractive index changes slightly so that the change of cell phase height could reliably reflect the change of cell height. Since the phase shift of several nanometers could be sensed by interference, DHM could provide a highly precise way to detect the change along observation direction, that is, not achievable for traditional optical microscopes. Based on the phase image of cells, the four parameters, i.e., CPV, CPA, CAPH, and CMPH could be deduced as follows:
In these four equations, Sc denotes the occupied region of the cell in the phase image, Sp denotes the real area of one pixel of the CCD camera, N denotes the total number of pixels in Sc, Sort(·) denotes the sort operation and Select{·} denotes the operation of selecting the top 50 largest numbers of a sequence. CPV, CPA, and CAPH could reflect the 3D, transverse and vertical morphology of living cell, respectively, while CMPH could reflect the vertical morphology of the cellular nucleus.
2.4.2 Change rate calculation
To quantitatively compare the morphological changes among different radiation doses, the change rates of CPV, CPA, CAPH, and CMPH of every cell are calculated. The change rate of the parameter is defined as the ratio of the change of the parameter before and after radiation to the parameter before radiation, which are expressed as:
In these four equations, CR denotes change rate, subscript A denotes the parameter calculated after radiation, and subscript B denotes the parameter measured before radiation.
2.4.3 Statistical analysis
Data were analyzed by GraphPad Prism 8 (GraphPad Software, Califnia, LLC) and displayed as a mean ± 95% confidence interval. The comparisons between the two groups were analyzed by Student’s t-test. The level of significant difference was set as two-tailed p < 0.05 (**p < 0.01, *p < 0.05).
3 Results
3.1 Changes of the viability of HT-1376 bladder cancer cell lines treated with different radiation doses
To establish the optimal radiation dose-response for the urothelial bladder carcinoma cell line, HT-1376 was treated with different doses of radiation. The cell viability was determined 48 h later by CCK8 assay. Radiation significantly inhibited the viability of HT-1376 in a dose-dependent manner, as the cell number strongly decreased (Figure 2).
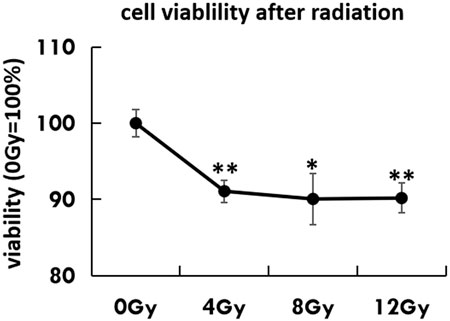
FIGURE 2. Cell viability was tested by CCK8 assay in untreated HT-1376 cells or different doses of irradiation.
3.2 Changes of proliferation ability of HT-1376 bladder cancer cell lines treated with different radiation doses
Moreover, as the cytotoxic effect of radiation was the DNA-double strand breakage, we investigated the alteration of cancer stem cell features via colony formation. The irradiated cells had a dramatically low colony-forming capacity when compared to the untreated group (p < 0.01) (Figure 3).
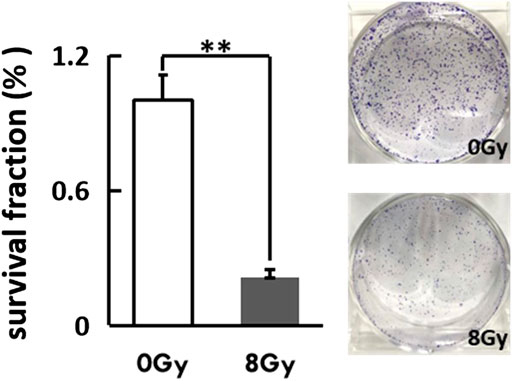
FIGURE 3. The irradiated cells were reseeded at a low density (400 cells/well) in a petri dish (D = 3 cm). The Coomassie-staining and colonies (≥50 cells) counting were performed after 2 weeks. Representative photographs of colonies and the colony fraction were shown.
3.3 Changes of migration ability of HT-1376 bladder cancer cell lines treated with different radiation doses
As we had captured the phenomenon of cell movement under the DH microscope, we thus examined the migration ability of irradiated cells by wound-healing assay. The mean width of the wound remained unchanged in the radiation group after 24 h, while significantly decreased in the untreated group (p = 0.05) (Figure 4).

FIGURE 4. The irradiated cells were recultured to 90% confluence with adherence status, followed by a scratching assay. Closure of the wounded region was evaluated by light-microscopy every 3 h. The percentage of the healing area was evaluated via ImageJ software and displayed as a diagram.
3.4 Changes in morphological parameters of HT-1376 bladder cancer cell lines treated with different radiation doses
HT-1376 cells were individually exposed to 0, 4, 8, and 12 Gy, where 0 Gy group acted as the control. All groups were measured once under the same environmental condition before and after radiation. As shown in Figure 5, a set of holographic phase images and their pseudo-three-dimensional images before and after radiation for 0, 4, 8, and 12 Gy were displayed in the first two columns and later two columns, respectively. Phase images before and after radiation of each group were displayed with a unified color map, and color bars of each group were located on the right. The white line in Figure 5B indicates the scale of the phase images. According to Figure 5, no obvious change in phase height and cellular shape was observed in 0 Gy group, while phase height increase could be seen in 4, 8, and 12 Gy groups.
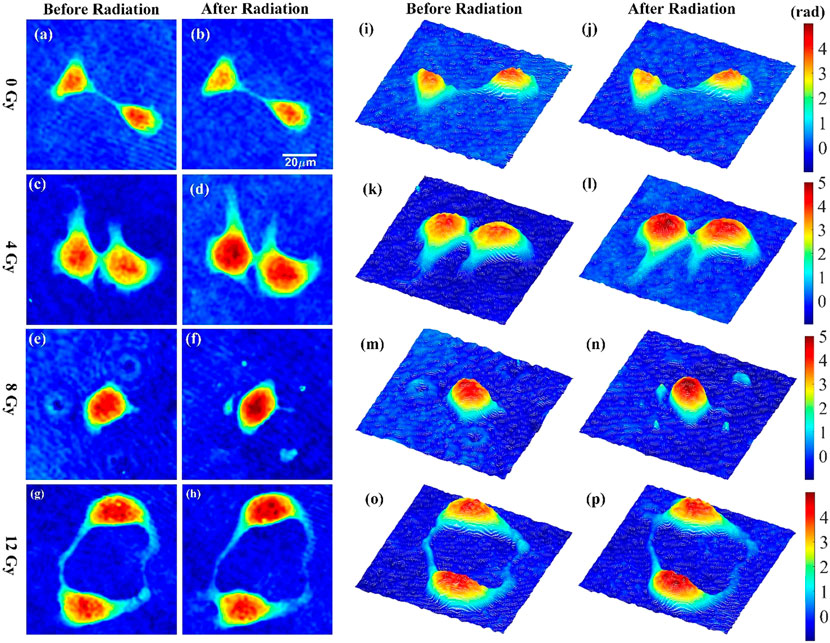
FIGURE 5. Phase images and corresponding pseudo-three-dimensional images of HT-1376 cells before and after radiation for 0, 4, 8, and 12 Gy.
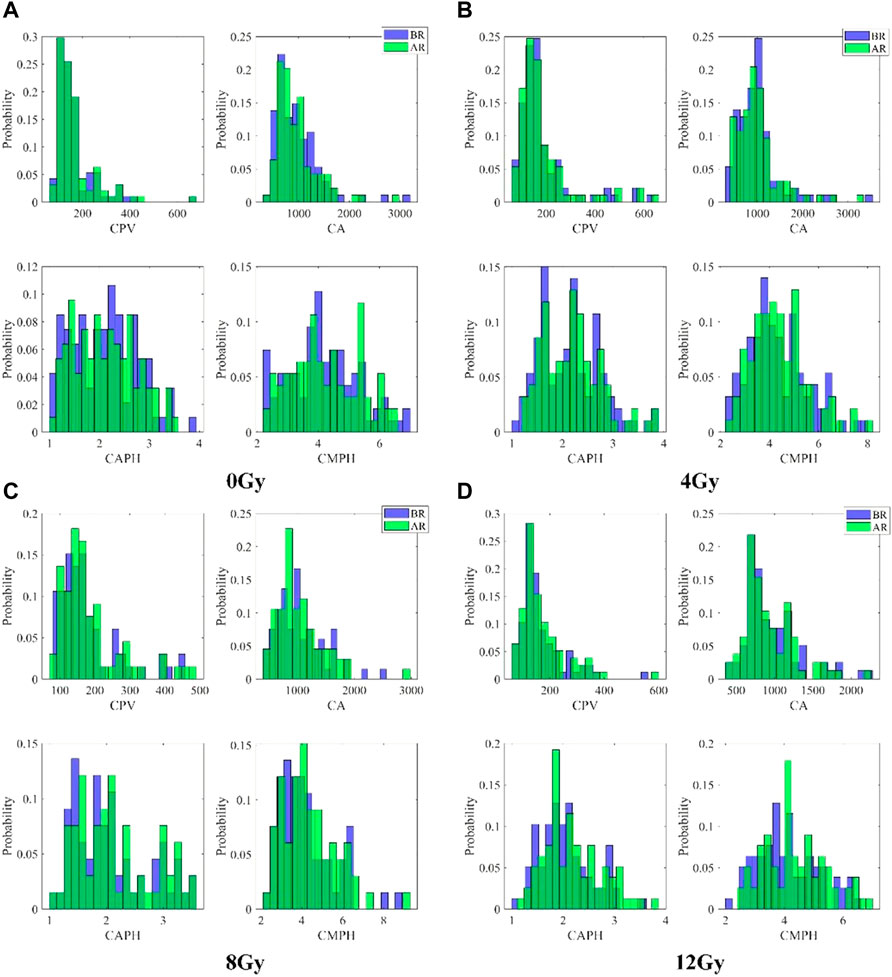
The distributions of CPV, CPA, CAPH, and CMPH of each group before and after radiation were first qualitatively compared. Figure 6 presents the histograms of CPV, CPA, CAPH, and CMPH of each group before and after radiation. The number of cells in 0Gy group, 4Gy group, 8Gy group, and 12Gy group are 94, 93, 67, 79, respectively. The histograms indicated by the blue color show the distributions of parameters before radiation, while the histograms indicated by the green color show the distributions of parameters after radiation. As can be seen in Figures 6C,D, the histograms of CPV, CAPH, and CMPH after radiation seen slightly shift right compared with those before radiation, while the histograms of CPA slightly shift left compared with those before radiation, which indicates that the morphology of cells is changed after radiation.
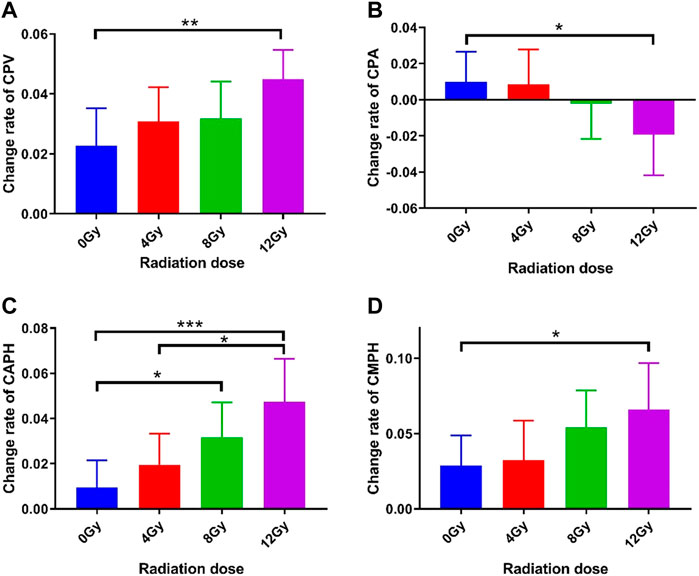
The changes in CPV, CPA, CAPH, and CMPH of each group were quantitatively examined. Since higher radiation dose carries larger energy and would cause more severe damage to cells, increased changes in CPV, CPA, CAPH, and CMPH were expected with the rise of radiation doses. The change rates of these four parameters of each group were presented in Figure 7. As can be seen, the change rates of CPV, CAPH, and CMPH show increased trends with the radiation dose rising, while the change rate of CPA was decreased with the radiation increase. As shown in Figure 7A, the change rate of the CPV of 12 Gy group increased significantly (4.49% vs. 2.28%, p = 0.0079) compared to the 0 Gy group, while 4 Gy group and 8 Gy group did not show a significant increase (3.08% vs. 2.28%, p = 0.3447 and 3.19% vs. 2.28%, p = 0.3178, respectively). As shown in Figure 7B, the change rate of the CPA of 12 Gy group decreased significantly (‒1.92% vs. 0.98%, p = 0.0378) compared to the 0 Gy group, while 4 Gy group and 8 Gy group did not show a significant decrease (0.86% vs. 0.98%, p = 0.9222 and ‒0.21% vs. 0.98%, p = 0.3598, respectively). As shown in Figure 7C, the change rate of the CAPH of 12 Gy group and 8 Gy group increased significantly (4.74% vs. 0.95%, p = 0.0007 and 3.17% vs. 0.95%, p = 0.0239, respectively) compared to the 0 Gy group, while 4 Gy group did not show a significant increase (1.96% vs. 0.95%, p = 0.2767). Moreover, the change rate of the CAPH of 12 Gy group increased significantly (4.74% vs. 1.96%, p = 0.0168) compared to the 4 Gy group. As shown in Figure 7D, the change rate of CMPH in 12 Gy group increased significantly (6.60% vs. 3.22%, p = 0.0390) compared to the 0 Gy group, while 4 Gy group and 8 Gy group did not show significant (0.86% vs. 2.89%, p = 0.8407 and 5.43% vs. 2.89%, p = 0.1080, respectively) decrease.
4 Discussion
Radiotherapy is one of the routine methods for tumor treatment. However, research on the relationship between radiation and cell morphology is rare, especially the dynamic and quantitative morphological changes after radiation. This study, to our knowledge, is the first record that observes and characterizes the cancer cell’s morphological changes after radiation based on phase imaging strategy via DH microscope.
In experiments, bladder cancer cells were treated with three doses of radiation and imaged by the DH microscope. We have demonstrated that radiation could impair the growth and migration of cancer cells and thus cause remarkable morphological changes. Meanwhile, irradiation could not only attack the cell itself but also break the intercellular junctions and destroy cell communication. (PMID: 30570385, 34688032, 11149936, 33416428) In our experiment, we observed those two types of morphological phenomena for irradiated cells, which are cellular regulation and intercellular regulation. Single-cell response to radio-stimulation by self-alteration was defined as cellular regulation, including cell division, cell death, and the disappearance of cytoplasmic vacuolization. The cell-to-cell interaction response to radio-stimulation was defined as intercellular regulation, including cell communication, cell migration, endocytosis, and exocytosis. Notably, intercellular junctions are highly sensitive to ionizing radiation, and previous studies observed the irradiated cells increasing in size and cellular roundness due to cell-to-cell adhesion loss. (PMID: 30570385) This phenomenon is consistent with what we observed, that some cells separated quickly from a tight touched status and changed in shape after irradiation, as shown in Figure 5C. Although those phenomena we observed might not all be radio-specific, we noticed tremendous shape changes of cells in a short period leading to a rapid increase in phase height and, ultimately, cell death.
Moreover, we obtained several parameters of irradiated cells, including phase height, cluster shade, and phase variance based on refractive index measurements. The average phase height for the confluent monolayer cells after gradient radiation presented a good steady rising trend, which can be attributed to the shortage of pseudopodium and damage to adhesion ability. Correspondingly, the change rate of cell cluster shade rose over gradient radiation, indicating that the surface of cells bends and folds after radiation. Unfortunately, we only observed the radiological dose-dependent manner of cell viability and cell morphological change but not a time-dependent manner. Therefore, contrary to some studies before [15–17], there was no unique parameter under the DH microscope that could stand for post-radiation morphological features. However, despite the nonspecific morphological parameter, the DH microscope has several advantages over the light microscopes, including the collection of informative 3D-morphology data, observation with nondestructive addition, and most importantly, tracing cells with the dynamic real-time view.
To our knowledge, morphology data describing treatment for cancer cells is limited. Kemper et al. reported the first case of drug influence on the morphology changes of pancreatic cancer cells via DH microscope. They treated the pancreatic cancer cells with Latrunculin B, which led to a decrease in their phase values and cell thickness [15]. Yunxin et al. identified that the low concentration of methanol (12%–25%) reduced the optical stickiness of cervical cancer cells, while the high concentration (50%) of methanol fixed the cells immediately with tiny shape change [18]. Furthermore, chemotherapy etoposide improved the cell volume of prostate cancer cells [16], while cisplatin was unable to alter the cell volume of endometrial cancer cells [17]. As a result, the effect of chemical or physical interventions on the cell morphological change might depend on the treatment-specific properties and the cytotoxic sensitivity of cells. Therefore, the DH microscope parameter alone might not be sufficient enough to distinguish the type of treatment.
Our observation has some limitations. Firstly, no radiation-related morphological parameter of cells was obtained due to the nonspecific shape alteration was captured. Secondly, only one type of cancer cell line was tested. Despite the limitations, our research has a specific significance for the single irradiated-cell continuous monitoring and their 3D shape data obtaining.
5 Conclusion
In conclusion, our study is the first observation that deeply investigated the irradiated cancer cells based on the quantitative phase imaging strategy using a quantitative tool, i.e., DH microscopy. We not only verified that the irradiated-related biological phenomena can be captured and identified via DH microscopy but also obtained the pattern of cell morphological change in a radiological dose-dependent manner. More importantly, our results open the way for further studies focused on exploring the treatment-specific cell morphology or distinguishing the cell response via the previously discovered or reported quantitative morphology biomarkers.
Data availability statement
The raw data supporting the conclusions of this article will be made available by the authors, without undue reservation.
Author contributions
The Author Contributions section is mandatory for all articles, including articles by sole authors. If an appropriate statement is not provided on submission, a standard one will be inserted during the production process. The Author Contributions statement must describe the contributions of individual authors referred to by their initials, and in doing so, all authors agree to be accountable for the content of the work. Please see here for full authorship criteria.
Funding
This work is supported by the Beijing Municipal Natural Science Foundation (Grant No. M22017), Beijing Municipal Natural Science Foundation (Grant No.7192104), National Natural Science Foundation for Young Scholars (Grant No. 81402519) and Innovation and Transformation Fund of Peking University Third Hospital (Grant No. BYSYZHKC2021113).
Conflict of interest
The authors declare that the research was conducted in the absence of any commercial or financial relationships that could be construed as a potential conflict of interest.
Publisher’s note
All claims expressed in this article are solely those of the authors and do not necessarily represent those of their affiliated organizations, or those of the publisher, the editors and the reviewers. Any product that may be evaluated in this article, or claim that may be made by its manufacturer, is not guaranteed or endorsed by the publisher.
References
1. Bray F, Ferlay J, Soerjomataram I, Siegel RL, Torre LA, Jemal A. Global cancer statistics 2018: GLOBOCAN estimates of incidence and mortality worldwide for 36 cancers in 185 countries. CA: A Cancer J Clinicians (2018) 68(6):394–424. doi:10.3322/caac.21492
2. El-Achkar A, Souhami L, Kassouf W. Bladder preservation therapy: Review of literature and future directions of trimodal therapy. Curr Urol Rep (2018) 19(12):108. doi:10.1007/s11934-018-0859-z
3. Song YP, McWilliam A, Hoskin PJ, Choudhury A. Organ preservation in bladder cancer: An opportunity for truly personalized treatment. Nat Rev Urol (2019) 16(9):511–22. doi:10.1038/s41585-019-0199-x
4. Goranov AI, Gulati A, Dephoure N, Takahara T, Maeda T, Gygi SP, et al. Changes in cell morphology are coordinated with cell growth through the TORC1 pathway. Curr Biol (2013) 23(14):1269–79. doi:10.1016/j.cub.2013.05.035
5. Hughes BR, Mirbagheri M, Waldman SD, Hwang DK. Direct cell-cell communication with three-dimensional cell morphology on wrinkled microposts. Acta Biomater (2018) 78:89–97. doi:10.1016/j.actbio.2018.07.053
6. Nassiri I, McCall MN. Systematic exploration of cell morphological phenotypes associated with a transcriptomic query. Nucleic Acids Res (2018) 46(19):e116. doi:10.1093/nar/gky626
7. Tatapudy S, Aloisio F, Barber D, Nystul T. Cell fate decisions: Emerging roles for metabolic signals and cell morphology. EMBO Rep (2017) 18(12):2105–18. doi:10.15252/embr.201744816
8. Javidi B, Carnicer A, Anand A, Barbastathis G, Chen W, Ferraro P, et al. Roadmap on digital holography [Invited]. Opt Express (2021) 29(22):35078–118. doi:10.1364/oe.435915
9. Popescu G, Park Y, Lue N, Best-Popescu C, Deflores L, Dasari RR, et al. Optical imaging of cell mass and growth dynamics. Am J Physiology-Cell Physiol (2008) 295(2):C538–C544. doi:10.1152/ajpcell.00121.2008
10. Depeursinge C, Marquet P, Pavillon N. Application of Digital Holographic Microscopy in Biomedicine[J]. In: Handbook of biomedical Optics. Editors D. A. Boas, C. Pitris, and N. Ramanujam (2011): 614–647.
11. Cuche E, Marquet P, Depeursinge C. Spatial filtering for zero-order and twin-image elimination in digital off-axis holography. Appl Opt (2000) 39(23):4070–5. doi:10.1364/ao.39.004070
12. Memmolo P, Distante C, Paturzo M, Finizio A, Ferraro P, Javidi B. Automatic focusing in digital holography and its application to stretched holograms. Opt Lett (2011) 36(10):1945–7. doi:10.1364/OL.36.001945
13. Leiping C, Xiao W, Xiaoping L, Liu J, Pan F, Ferraro P. Automatic removal of phase aberration in holographic microscopy for drug sensitivity detection of ovarian cancer cells. OSA Continuum (2020) 3(7):1856–68. doi:10.1364/OSAC.391773
14. Khan W. Image segmentation techniques: A survey. Joig (2014) 1:166–70. doi:10.12720/joig.1.4.166-170
15. El-Schich Z, Mölder A, Tassidis H, Härkönen P, Falck Miniotis M, Gjörloff Wingren A. Induction of morphological changes in death-induced cancer cells monitored by holographic microscopy. J Struct Biol (2015) 189(3):207–12. doi:10.1016/j.jsb.2015.01.010
16. Kemper B, Carl D, Schnekenburger J, Bredebusch I, Schäfer M, Domschke W, et al. Investigation of living pancreas tumor cells by digital holographic microscopy. J Biomed Opt (2006) 11(3):034005. doi:10.1117/1.2204609
17. Yao T, Cao R, Xiao W, Pan F, Li X. An optical study of drug resistance detection in endometrial cancer cells by dynamic and quantitative phase imaging. J Biophotonics (2019) 12(7):e201800443. doi:10.1002/jbio.201800443
Keywords: bladder cancer cell, cell morphology alteration by radiation, quantitative phase imaging, digital holography, radio-sensitivity
Citation: Xiao X, Che L, Li Y, Peng R, Wang M, Xiao W, Pan F and Wang H (2022) Label-free observation of morphological alteration of irradiated-urothelial bladder carcinoma cells through digital holographic microscopy. Front. Phys. 10:925523. doi: 10.3389/fphy.2022.925523
Received: 21 April 2022; Accepted: 22 July 2022;
Published: 22 August 2022.
Edited by:
Liangcai Cao, Tsinghua University, ChinaReviewed by:
Jun Ma, Nanjing University of Science and Technology, ChinaZhe Wang, Università degli Studi di Napoli Federico II, Italy
Copyright © 2022 Xiao, Che, Li, Peng, Wang, Xiao, Pan and Wang. This is an open-access article distributed under the terms of the Creative Commons Attribution License (CC BY). The use, distribution or reproduction in other forums is permitted, provided the original author(s) and the copyright owner(s) are credited and that the original publication in this journal is cited, in accordance with accepted academic practice. No use, distribution or reproduction is permitted which does not comply with these terms.
*Correspondence: Hao Wang, d2FuZ2hhb2J5c3lAYmptdS5lZHUuY24=; Feng Pan, cGFuZmVuZ0BidWFhLmVkdS5jbg==
†These authors have contributed equally to this work
 Xi Xiao1†
 Mingqing Wang
 Feng Pan
 Hao Wang