 Mingwei Cui1
 Jun Hu
 Yuxia Hu
94% of researchers rate our articles as excellent or good
Learn more about the work of our research integrity team to safeguard the quality of each article we publish.
Find out more
ORIGINAL RESEARCH article
Front. Phys., 30 June 2022
Sec. Social Physics
Volume 10 - 2022 | https://doi.org/10.3389/fphy.2022.922872
This article is part of the Research TopicMachine Learning in Social Complex SystemsView all 5 articles
With the expansion of globalization, the internationalization of education has become an essential strategy for developing in various countries. To obtain higher education, more and more students decide to study abroad. Many countries have been recruiting talented people to promote education and technology innovation in recent years. In particular, emerging and developing countries have improved systems on talent introduction. Meanwhile, the internationalization of education has become one of the important factors affecting the economic development of a country. Thus, the environment for talent development has been improving, and the international talent flow mode has become increasingly diversified, and it is of certain guiding significance to analyze and formulate corresponding laws according to the behavior of foreign students. This article constructs a weighted directed network to analyze the network’s evolution by global student mobility data from 2007 to 2016. The results are as follows: first, the network has a small average path length and significant average clustering coefficient, showing small-world characteristics. Second, the density shows a trend of first reducing and then rising. It explains that emerging countries also improve the ability to attract talents, and interactions between countries are becoming more frequent. Moreover, degree and degree centrality gradually increase, indicating that the number of students is rising, and the study abroad path is also growing in the network. Finally, the division of community based on the label propagation and semi-supervised learning to demonstrate the club’s change reflects the communications of these communities during the decade.
Innovation is the first driving force that leads to development, while the essence of innovation drive is talent drive. In the era of knowledge economy, talent mobility is influencing the world economy by its way, and studying abroad has become an efficient way. In the process of international education, international education and international student mobility are the important components, while international student mobility refers to students’ movement across borders to obtain a stronger educational resource [1]. The United Nations Educational, Scientific and Cultural Organization (UNESCO) data show that there were 2.7 million international students in 2007 and more than 5.08 million by 2017 [2]. However, the mobility would be affected by many factors, such as population size, talent resource allocation, comprehensive national power, and economic development of a country [3].
Based on the world system theory created by Wallerstein, this theory divided countries into three types: core countries, semi-periphery countries, and periphery countries [4]. The developed countries possess state-of-the-art research and innovation infrastructure, keeping the core of the international student mobility network. However, they constantly put pressure on underdeveloped countries by their economic and technological power; while underdeveloped countries with limited research technology and incomplete infrastructure are at the periphery [5]. From a macro perspective, the mobility is positively correlated with a country’s overall national strength. Moreover, the flow from developing to developed countries has been proven to be a basic trend, with a severe imbalance between the source and receiving countries.
In the early days, there were two modes of global student mobility:1) from developing countries to developed countries and 2) within developed countries to each other. Developed countries master the core technology in a global institutional organization, introducing many outstanding talents and consolidating their regional advantages in a core position [6]. To attract more talented people from all over the world, several developed countries have relaxed the restrictions on student visas to enhance the technology. After the 21st century, emerging countries’ comprehensive national power has been increasing. Although developed countries still occupy the primary position in accepting students, their share has been somewhat reduced. For developing countries, there are advantages and disadvantages in encouraging talents to pursue further education abroad. It boosts students’ living value and facilitates the national innovation development after study, providing a vital way to share knowledge and technology. However, it also inevitably leads to brain drain after students access high-quality education, that is “Brain Drain” [7]. Developing countries have been improving policies for talent acquisition and innovation infrastructure, such as establishing study abroad funds to support students to study higher education, thus promoting domestic technological progress.
In addition, talents will return to their homeland and contribute to technology development after acquiring scientific skills. The “brain drain” is gradually transformed into a “brain circulation,” and the multidirectional circulation pattern has gradually replaced the one-way flow pattern of single marginal countries to core countries [8]. Students are no longer concentrating in developed countries, and more hub countries have emerged. At present, mobility among developing countries and intra-regional mobility has become the new trend, gradually becoming the primary trend with mobility from developing to developed countries and intra-developed countries [9]. The balance of global student mobility has also contributed to the balanced world economy. To further balance the economy, nations should exchange more advanced technology to accelerate the integration and diversification of global education.
International student mobility is a leading way to spread global knowledge and technology [10], and there is much research about it from various perspectives. Wang studied the global scientific talents by patents data from 1990 to 2012 and concluded that there is a trend toward the concentration of mobility talents with an increasing mobility network [11]. With the emergence of complex networks, scholars have started to apply such theory to different areas [12–14]. Hou studied the evolution of global student mobility and factors by network analysis and the negative binomial regression model, proving that the network has a clear hierarchy, and countries such as China have become a new regional hub [15]. Macrander studied the economic inequality of international student mobility from 2008 to 2012 and found that high-income countries function as receiving countries, while low-income countries function as source countries [16].
This article collects global student mobility data to study its structural characteristics from 2007 to 2016 and then analyzes the network’s evolution by network analysis. We divided nations to study their communications between countries using community detection. The main contributions of this article are as follows: 1) it provides a method to study international education, which also reflects the economy in a nation. 2) Network density, small-world characteristics, and degree centrality of the network are investigated to analyze the characteristics of the fluctuation of international student mobility during the decade. 3) Community detection divides the world into several associations to study the student mobility variation.
The rest of the article is organized as follows: first, we provided the relevant data and explained the sources of the data, and we introduced some models about the network complexity structure in Section 2; then, we elaborated the results and related analysis in Section 3; finally, Section 4 includes the main conclusion and policy recommendations.
In the article, we collected the global student mobility data from 2007 to 2016 by the UNESCO database. As the only official data source to obtain information on cross-country mobility in international higher education, scholars often used it among empirical evidence to global intellectualization [17, 18].
We built a weighted directed network using data on global student mobility because mobility is not a single linear pattern, and with distinct numerical characteristics, thus we measured the network complexity structure by characteristic statistics [21].
1) Network density
The network density is used to measure the closeness of a network, denoted as
where
2) Average path length
The average path length is the average of the shortest path in a network, denoted as
where
3) Average clustering coefficient
The average clustering coefficient is the average of the clustering coefficient between all nodes, describing the tightness of connections between nodes, denoted as
where
4) Degree centrality
The degree centrality is the number of nodes that are directly connected to that node, denoted as
If node
5) Weighted degree centrality
The weighted degree centrality is the sum of edges weighted directly connected to node
where
To further explore the network, we used community identification algorithms to divide communities. We classified these countries involved in international student mobility based on nodes’ connection density. Nodes are tightly connected between the same communities while sparsely connected between different communities [19, 20]. Usually, the modularity Q function is used to describe the accuracy of community division, which was devised by Newman [21]. The closer the Q takes to 1, the more obvious the community structure is, which is expressed as follows:
where
Let
Considering all data as nodes to create a fully connected graph, the weight of its edges is calculated as follows:
where
In order to measure the probability that the label of a node propagates to other nodes through edges, a
where
We constructed a weighted directed network by the global student mobility data from 2007 to 2016 and calculated the characteristic statistics about the network complexity, the degree distribution, and the cluster coefficient distribution of 2016, as shown in Table 1 and Figure 1. We find that the degree distribution is the fit in some sort of fat-tailed distributions. The network has a considerable average clustering coefficient and small average path length, showing “small-world” characteristics. Figure 2 shows the network density from 2007 to 2016.
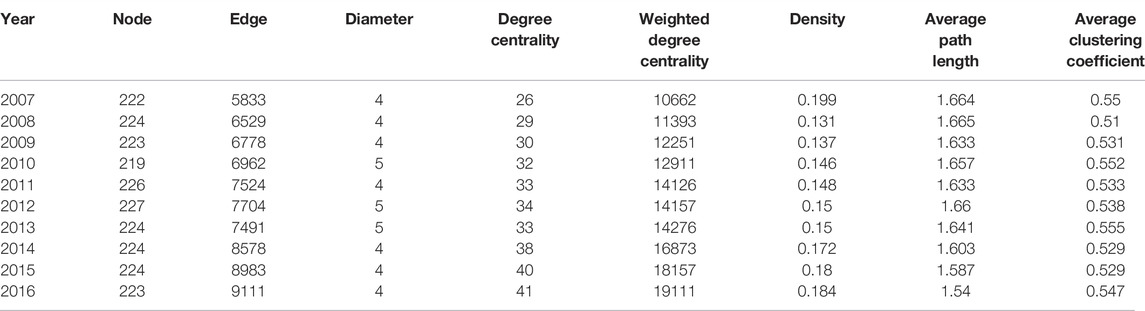
TABLE 1. Statistics on complexity characteristics of international student mobility from 2007 to 2016.
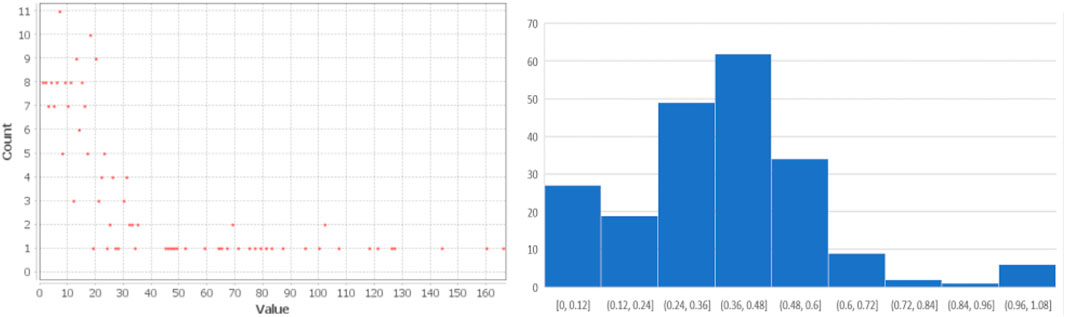
FIGURE 1. Degree distribution and the cluster coefficient distribution of 2016.
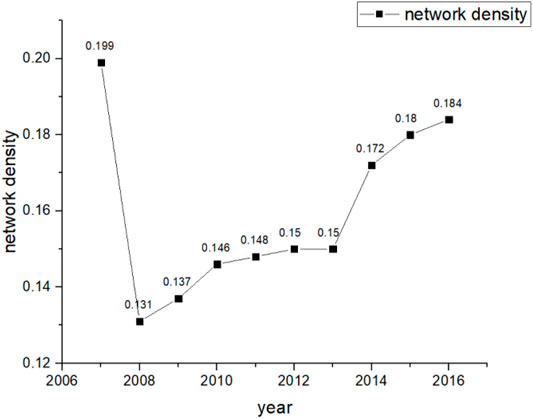
FIGURE 2. Network density from 2007 to 2016.
The countries involved in global student mobility have been stable, ranging from 219 to 227 during the decade, which indicates that many countries are encouraging their students to study abroad and welcoming talents from all over the world to develop further. However, with the evolution of globalization, the student mobility trend is on the rise and growing. As we know from Table 1, the pathways between countries have increased from 5833 to 9111 with an average annual growth rate of 4.6%, and the average number of exchanges per country has increased from 26 in 2007 to 41 in 2016. This indicates that the world economy is becoming diversified and integrated. Many countries attach increasing importance to innovative technologies and knowledge’s transmission, which are constantly exporting or receiving talents to other countries.
In the decade, the average number of students admitted and sent out increased from 10662 to 16873, with an average annual growth rate of 6%, which shows that its scale is growing rapidly. Moreover, the density has increased from 0.119 to 0.184 and with a diameter between 4 and 5, indicating that academic exchanges between these countries are becoming more frequent. Similarly, the average path length has decreased from 1.664 to 1.54, and the average clustering coefficient ranged from 0.552 to 0.51, with an overall decreasing trend. It explains that the network’s connection is becoming more intensive. People no longer gather in a single direction to developed countries but gradually began developing a multi-directional circulation trend, and the circulation has helped achieve a balanced economy and realize the globalization of international education. With the boosting of international influence, especially in developing countries like China and India, many students would return to their native and start a career.
We drew the box plots about the degree by student mobility data from 2007 to 2016, as shown in Figure 2 from panel (a) to (c). Clearly, the average number of students admitted to each country shows an overall upward trend during the decade from Figure 2A, indicating that many countries are constantly encouraging education and technology, but the maximum number of students has not changed. In addition, the average number of students sent out is also increasing year by year from Figure 2B, fluctuating more significantly than the rise of admitted students. It indicates that many countries realize the importance of talents, devoting themselves to cultivating more science and technology talents.
Finally, Figure 3 (c) reflects the difference between the receiving and originating countries for each country, and it has not changed significantly, indicating that these countries’ exchanges are relatively fixed. Moreover, the shortest box in 2007 demonstrates that the communications between nations are more concentrated, while the most extended box in 2016 suggests that the interactions are dispersed. At the same time, there are many abnormal values except the latter three years, explaining that developing countries are no longer just sending talents outward and attracting more global students by their own scientific and technological strength.
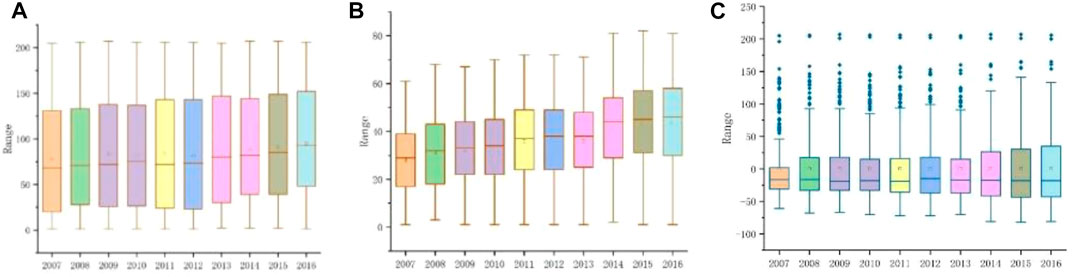
FIGURE 3. Basic properties of network diagrams from 2007 to 2016: (A) Box plot of the unweighted indegree network. (B) Box plot of the unweighted outdegree network. (C) Box plot of the unweighted indegree minus outdegree network.
Meanwhile, indegree centrality and weighted indegree centrality describe a country’s ability to attract talents, reflecting the comprehensive national strength and global influence. The higher the indegree centrality, the more countries recognize the country’s educational resources and technology strength, that is, the more paths of origin students come from; the higher the weighted indegree, the more the students move to the country. However, outdegree centrality and weighted outdegree centrality reflect a country’s ability to send talents to various countries. The higher the outdegree centrality, the more destinations the country sends talents to, that is, the more countries there are technological exchanges with; the higher the weighted outdegree centrality, the more talents sent to various regions.
We divided the network structure into several associations based on the mobility relationship from 2007 to 2016. The country category changes are shown in Figure 4; although it changes each year slightly, it is also stable between 6 and 7, demonstrating that the international student policies have not changed significantly. In addition, the clustering result is shown in Figure 5, in which (a)∼(j) are the network’s associations during the decade. Moreover, these diagrams explain the relationships between nations in detail. The more connect between the countries, the more the frequent exchange between them, indicating that a country pays increasing attention to global resources and outstanding talents.
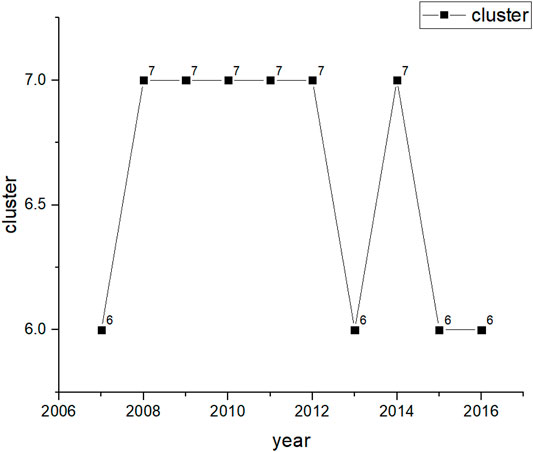
FIGURE 4. Change in the number of country categories from 2007 to 2016.
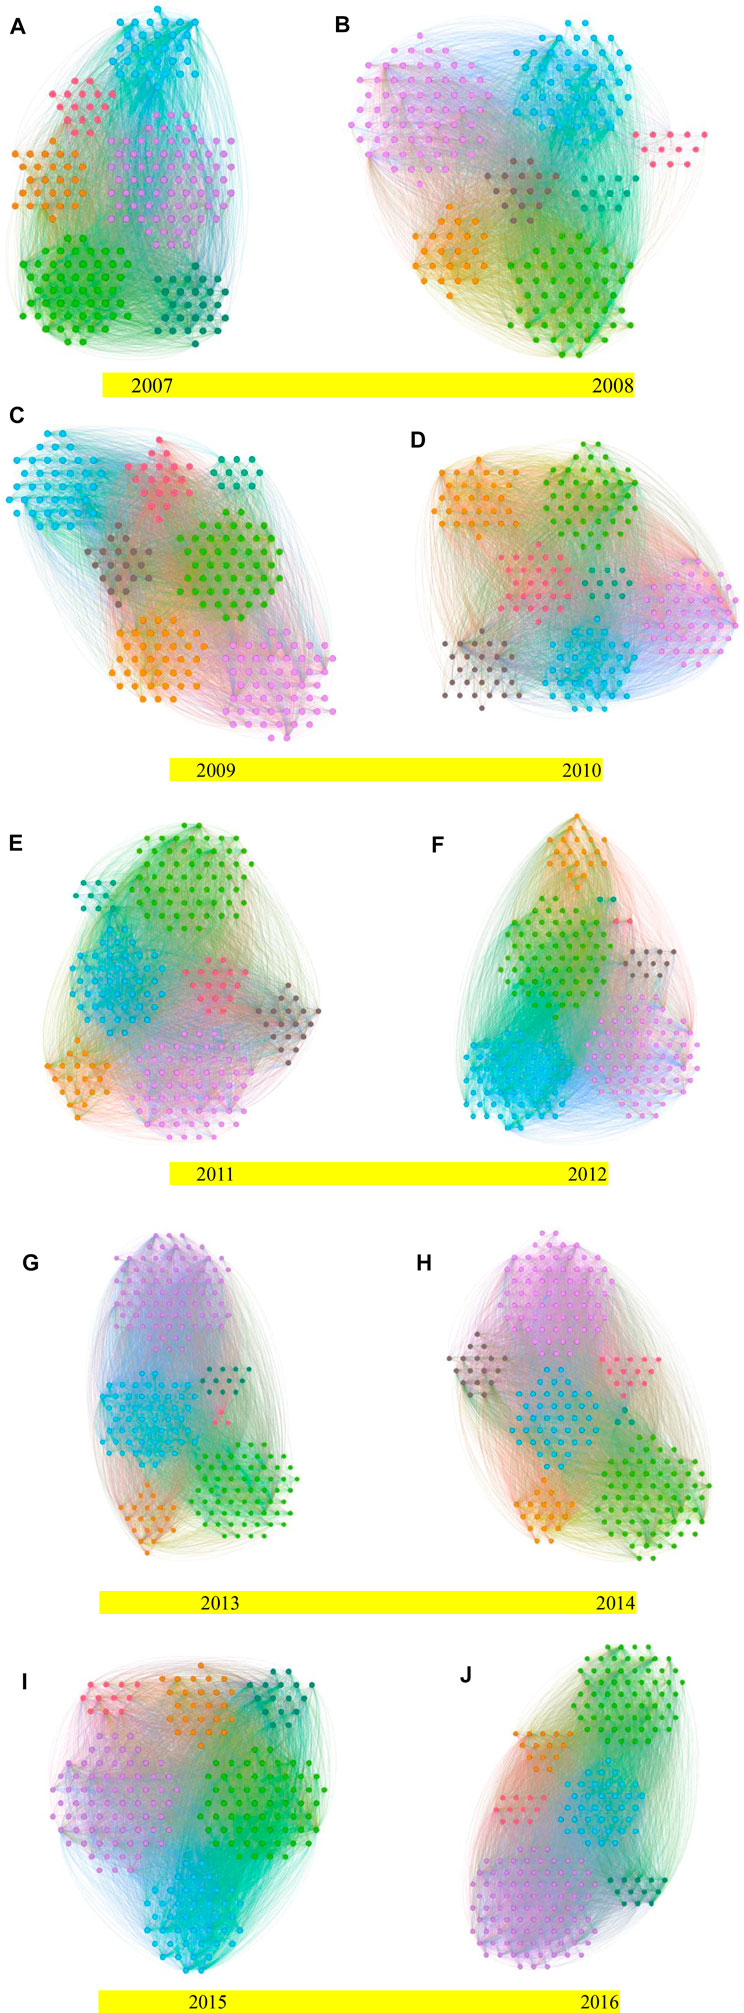
FIGURE 5. (Continued). Community division results of the network from 2007 to 2016. (A) 2007; (B) 2008; (C) 2009; (D) 2010; (E) 2011; (F) 2012; (G) 2013; (H) 2014; (I) 2015; (J) 2016.
As we can see from the decade-long communities division, developed countries such as the United States and the United Kingdom belong to one association, being a core by their vital educational resource. Countries such as China and Japan are divided into one association. They have been reforming their talent introduction policies and increasing their investment in education, gradually shifting from a semi-periphery to a core. However, countries such as Africa and Latin America belong to one association, and they have been marginal in the network due to the backwardness.
This article focuses on global student mobility data from 2007 to 2016. By analyzing the statistics of the complex network, we know that the global awareness of knowledge sharing gradually is taken seriously. The network shows a “small-world” character; with discussions between countries becoming closer and closer, the students keep increasing significantly. Then, we analyzed the network centrality to study education communication between nations. Finally, we divided these countries involved in student mobility into communities, and it is found that whole communities have a little change during the decade. In essence, countries such as China and South Korea have gradually moved from a semi-fringe position to a core position, which outstandingly contributes to international education. The global student flow is no longer singularly to the Western European countries led by the United States. The internal mobility of developing countries has become a new trend, forming a new world development pattern.
To facilitate economic integration, nations ought to pay attention to their responsibilities in the international culture. To accelerate the sharing of global resources, we should participate in the evolution of international education. First, although the developed countries are dominated by their technological capabilities, the mobility is no longer concentrated to a single developed country, and they are no longer the only choice. Moreover, emerging countries benefit from the emerging trends, having more opportunities to accelerate global knowledge sharing and promoting their development.
To promote education globalization, nations should improve the ability to gather talents: first, the policy of talent introduction should be improved, the restrictions on student visas should be relaxed, and the allocation of human resources should be improved to attract outstanding talents. Second, based on the advantages of local education, we should enhance the construction of weak disciplines to promote “double first-class” education and improve the attractiveness to international students. Third, we should establish an international cooperation mechanism, carry out cooperative education projects, try diversified teaching methods, and promote the cultivation of international students.
The datasets presented in this article are not readily available because they were purchased from UNESCO. Requests to access the datasets should be directed to anVuZ2VodUAxMjYuY29t.
MC: visualization, validation, and drawing and writing. JH: investigation, software, and methodology PW: conceptualization, software, and validation. YH: writing—reviewing and editing and visualization. XZ: methodology, computation, and software.
The authors declare that the research was conducted in the absence of any commercial or financial relationships that could be construed as a potential conflict of interest.
All claims expressed in this article are solely those of the authors and do not necessarily represent those of their affiliated organizations, or those of the publisher, the editors, and the reviewers. Any product that may be evaluated in this article, or claim that may be made by its manufacturer, is not guaranteed or endorsed by the publisher.
This paper is partially supported by the Academy-Locality Cooperation Project of the Chinese Academy of Engineering under Grant 2021-FJ-ZD-4 and supported in part by Fujian science and technology economic integration service platform.
1. Poulin N. S. Higher Education and International Student Mobility in the Global Knowledge Economy. Int J Educ Adv (2009) 9(1):60–2. doi:10.1057/ijea.2009.22
2. Veselinovska S. S. United Nations Educational, Scientific and Cultural Organization (UNESCO). Polish Med J (2011) 15: 1214–1219.
3. Wei H., Wang C. An Empirical Analysis of International talent Flow and its Influencing Factors. Manage World (2012) 66 (1) 33–45. doi:10.1007/s10734-102-9593-5
4. Zhang K. Z., Zhang T. The Concept of Core-Periphery in the World-System Analysis. J Renmin Univ China (2015) 29(2):80.
5. Smith D. A., White D. R.. Structure and Dynamics of the Global Economy: Network Analysis of International Trade 1965–1980. Social Forces (1992) 70(4):857–893.
6. Tannock S. Points of Prejudice: EducationBased Discrimination in Canada’s Immigration System. Antipode (2011) 43:(4)1330–1356.
7. Ackers L. Promoting Scientific Mobility and Balanced Growth in the European Research Area. Innovation: Eur J Soc Sci Res (2005) 18(3):301–17. doi:10.1080/13511610500186680
8. Harvey W. Brain Circulation to the UK? J Manage Dev (2012) 31(214):173–86. doi:10.1108/02621711211199502
9. Chacko E. From Brain drain to Brain Gain: Reverse Migration to Bangalore and Hyderabad, India’s Globalizing High Tech Cities. GeoJournal (2007) 68(2):131–40. doi:10.1007/s10708-007-9078-8
10. Pagani R. N., Ramond B., Silva V. L. D., Zammar G., Kovaleski J. Key Factors in university-to-university Knowledge and Technology Transfer on International Student Mobility. Knowledge Manage Res Pract (2019) 18(3). doi:10.1080/14778238.2019.1678415
11. Wang Y., Shi Y. Evolvement of International Mobility of Talents: a Complex Network Perspective. Int. J. Innov. Sci. (2022) (ahead-of-print). doi:10.1108/IJIS-02-2021-0029
12. Zhu P., Cheng L., Gao C., Wang Z., Li X. Locating Multi-Sources in Social Networks with a Low Infection Rate. In: IEEE Transactions on Network Science and Engineering. IEEE (2022) 9:1853–1865. doi:10.1109/TNSE.2022.3153968
13. Li X., Jia D., Niu X., Liu C., Zhu R., Liu D., et al. Ability-based Asymmetrical Fitness Calculation Promotes Cooperation in Spatial Prisoner’s Dilemma Game. Appl Maths Comput (2021) 412:126572. doi:10.1016/j.amc.2021.126572
14. Cheng L., Li X., Han Z., Luo T., Ma L., Zhu P. Path-based Multi-Sources Localization in Multiplex Networks. Chaos, Solitons Fractals (2022) 159:112139. doi:10.1016/j.chaos.2022.112139
15. Hou C. G., Du D. B. Spatio-temporal Evolution and Factors Influencing International Student Mobility Networks in the World. Acta Geographica Sinica (2020) 75(4):681–694. doi:10.11821/dlxb202004002
16. Macrander A. Fractal Inequality: A Social Network Analysis of Global and Regional International Student Mobility. Res Comp Int Edu (2017) 12(2):243–68. doi:10.1177/1745499917712616
17. Vögtle E. M., Windzio M. Networks of International Student Mobility: Enlargement and Consolidation of the European Transnational Education Space? Higher Educ (2016) 72(6):723–41. doi:10.1007/s10734-015-9972-9
18. Kondakci Y., Bedenlier S., Zawacki-Richter O. Social Network Analysis of International Student Mobility: Uncovering the Rise of Regional Hubs. Higher Edu (2018) 75(1):1–19. doi:10.1007/s10734-017-0154-9
19. Jiao J., Wang J., Jin F., Wang H. Impact of High-Speed Rail on Inter-city Network Based on the Passenger Train Network in China, 2003-2013. Acta Geographica Sinica (2016) 71(2):265. doi:10.11821/dlxb201602007
20. Zhu P., Dai X., Li X., Gao C., Jusup M., Wang Z. Community Detection in Temporal Networks via a Spreading Process. Epl (2019) 126(4):48001. doi:10.1209/0295-5075/126/48001
Keywords: network science, international student mobility, spatial and temporal evolution, community detection, label propagation, semi-supervised learning
Citation: Cui M, Hu J, Wu P, Hu Y and Zhang X (2022) Evolutionary Analysis of International Student Mobility Based on Complex Networks and Semi-Supervised Learning. Front. Phys. 10:922872. doi: 10.3389/fphy.2022.922872
Received: 18 April 2022; Accepted: 19 May 2022;
Published: 30 June 2022.
Edited by:
Zhi-Qiang Jiang, East China University of Science and Technology, ChinaReviewed by:
Peng-Fei Dai, Wuhan University of Technology, ChinaCopyright © 2022 Cui, Hu, Wu, Hu and Zhang. This is an open-access article distributed under the terms of the Creative Commons Attribution License (CC BY). The use, distribution or reproduction in other forums is permitted, provided the original author(s) and the copyright owner(s) are credited and that the original publication in this journal is cited, in accordance with accepted academic practice. No use, distribution or reproduction is permitted which does not comply with these terms.
*Correspondence: Jun Hu, anVuZ2VodUAxMjYuY29t; Peng Wu, d3VwZW5nODg4NTdAMTI2LmNvbQ==
Disclaimer: All claims expressed in this article are solely those of the authors and do not necessarily represent those of their affiliated organizations, or those of the publisher, the editors and the reviewers. Any product that may be evaluated in this article or claim that may be made by its manufacturer is not guaranteed or endorsed by the publisher.
Research integrity at Frontiers
Learn more about the work of our research integrity team to safeguard the quality of each article we publish.