 Lingzhe Zhu1
 Yongxiang Xia
94% of researchers rate our articles as excellent or good
Learn more about the work of our research integrity team to safeguard the quality of each article we publish.
Find out more
ORIGINAL RESEARCH article
Front. Phys., 06 June 2022
Sec. Interdisciplinary Physics
Volume 10 - 2022 | https://doi.org/10.3389/fphy.2022.919455
As important infrastructure, logistic networks need to be designed not only for robustness but also for transportation efficiency. In order to improve transportation efficiency, different types of logistic networks integrate to form a double-layer coupled network. When some nodes fail in this double-layer coupled network, especially in the case of limited repair resources, how to evaluate the node that needs to give priority to repair is of great significance. In this study, an evaluation method of key repairing node is proposed to find the key node which should be repaired first to restore the network performance. By comparing with traditional evaluation methods of key nodes, the effectiveness of the proposed method is verified.
The stability and reliability of logistic networks are very important to social and economic development. In recent years, the transportation infrastructures, including the railway network [1], aviation network [2], and highway network [3], have undergone rapid development. Therefore, the modern logistic networks become more and more complicated. Moreover, in order to transport materials from their sources to their destinations faster, multiple modes of transportation may be used for intermodal transportation. This will couple different logistic networks into a multi-layer network, which enhances spatial heterogeneity and connections. If some nodes in this multi-layer network cannot work properly due to random failure or intentional attack, it will lead to a reduction in transportation efficiency, which even makes the entire logistic system break down. It is of great significance to improve the robustness and invulnerability of logistic networks. To perform that, it is important to identify the key node in such a complex system.
With the development of complex network theory, people have proposed a variety of methods to evaluate key nodes through network structural characteristics. The studies in [4, 5] used techniques for order preference by similarity to an ideal solution approach to evaluate node importance. The studies in [6–8] proposed a node importance evaluation method based on local information of the network topology and perspective of the existence of mutual dependence among nodes. The studies in [9, 10] considered degree centrality, closeness centrality, and betweenness centrality and raised an integrated measuring method to evaluate node importance in complex networks. The studies in [11, 12] introduced the definition of entropy in complex networks and used entropy to evaluate the importance of nodes. The study in [13] proposed the weighted K-order propagation number algorithm based on the network topology to evaluate the node importance.
In recent years, research on network robustness has gradually transited from the network damage stage to focus on network resilience. Resilience [14] generally refers to the ability of the system to return to a normal state after fault, which includes not only the fault stage but also the recovery stage. The previous evaluation indicators of key nodes mainly focus on the cascading failures [15–18] of nodes in the network, that is, which failed node will affect more nodes in the network. On the other hand, during the recovery stage, the failed nodes are repaired. In the case of a large number of node failure, it is important to know repairing which node will make the network performance recovery the most effective. This is the key repairing node evaluation problem we are interested in this study. Unfortunately, compared to the key node identification for the network damage stage, the key repairing node evaluation is rare. It is generally believed that if the failure of a node makes the network performance decline the most, then repairing it will also make the network performance recover the most. However, this is not always the case. The key point is that the original network is not the same as the network after a large number of nodes fail. Therefore, it is not accurate to use the method of evaluating node importance in the original network to evaluate the key repairing nodes. Based on the aforementioned thought, this study aimed at the identification of a key repairing node after a number of nodes fail in the multi-layer coupled logistic network.
The contribution of this study is that the proposed identification method focused on the repairing process. It attempted to find the key node in the failed nodes, by repairing where the network performance can be recovered the most.
The remaining article is organized as follows: we described the method of constructing a double-layer coupled network model in Section 2. We introduced the network model, including the transportation cost model, transmission routing model, and network congestion model in Section 3. In Section 4, we introduced the key repairing node evaluation methods, which include four traditional key node evaluation methods, two modified methods, and the new method proposed in this study. Three performance indicators of the network after repairing are proposed, and the effectiveness of the evaluation methods is compared by the results of the performance indicators after the simulation experiment. We summarized the full study and drew the conclusion in Section 5.
In this study, a double-layer coupled network is used to simulate the aviation-railway intermodal logistic network. The network is shown in Figure 1.
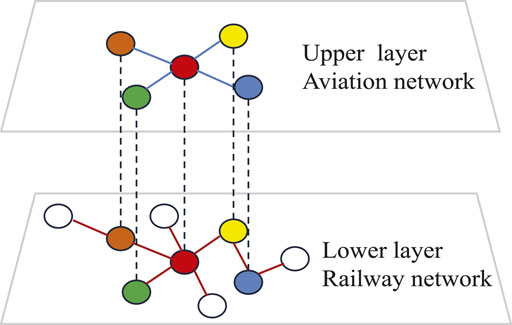
FIGURE 1. Double-layer logistic network. The solid lines represent the transportation edges within one layer, and the dotted lines represent the coupling edges between two layers. Nodes with the same color represent the railway station and airport in the same city.
Considering the difference in the topological structure between these two kinds of networks, we used different network models for them. In some previous studies, aviation networks exhibited scale-free properties [19]. Therefore, the upper layer used the BA scale-free network [20] to simulate the aviation network. On the other hand, in the construction of the railway network, cities that are close to each other are directly connected by railways. According to this feature of the railway network, the lower layer uses the spatial network model [21] to simulate the railway network.
Considering the fact that the number of railway stations is larger than the number of airports, the number of nodes in the upper layer is much smaller than that in the lower layer. We assumed the number of nodes in the lower layer (i.e., the number of railway stations) to be N and the number of nodes in the upper layer (i.e., the number of airports) to be n. Then, n is much smaller than N.
To couple two layers, we considered the fact that airports are usually located in big cities. Then, we sorted the nodes in the lower layer based on their degrees. The nodes with a high degree indicated the railway station in a big city. So the airports should be allocated based on the degree of lower layer nodes. We assigned coordinates for each node, and the railway station (i.e., the node in the lower layer) and the airport (i.e., the node in the upper layer) in the same city were given the same coordinate. In other words, the coordinate actually allocated the city. Finally, the nodes with the same coordinate, which denoted the railway station and airport within the same city, were connected by the coupling links. In this way, the double-layer coupled logistic network was built.
In a double-layer coupled logistic network, transmission between two city nodes produces cost, including time cost and economic cost. Both of them were related to the length of the edge. The length of the edge between node i and node j can be calculated by Euclidean metric, defined as
where (xi, yi) and (xj, yj) represent the coordinates of city nodes i and j, respectively.
Transportation speed V and transportation price p are different in different layers of the network. We considered city node i and city node j, supposing there are both railway and aviation between them. Obviously, by choosing different modes of transportation, the resulting time cost and economic cost will be different. The time cost of each edge is equal to the distance between two nodes divided by the transportation speed, that is,
In order to evaluate the proportion of two kinds of cost in the total transportation cost, a parameter m (0 < m < 1) is introduced. The total transportation cost by using aviation between node i and node j is
The total transportation cost by using railway between node i and node j is
In the aforementioned two formulas, the larger m is, the more important the economic cost is in the total cost, and routes which make economic cost lower will be preferred. On the contrary, for a smaller m, the time cost becomes a larger proportion in the total cost, and it tends to choose a route with shorter transportation time.
It is noted that the cost considered in this study is the transportation cost of edges within each layer, and the cost for the coupling edges between two networks is not considered.
Based on the previous section, we can calculate the total transportation cost between each node pair. The transportation path from the source node to the destination node will follow the minimum cost path Pi→j = (X0 = i, X1, … , Xn−1, Xn = j). Its cost can be calculated as
According to the aforementioned rule, when parameter m takes different values, the transportation between the same source-destination pair may go through different paths.
In the logistic network, the material flows are forwarded along the edges, according to the minimum cost of transportation routing. For a given pair of source nodes and destination nodes, the flow is transmitted along the minimum cost path. In this way, it will bring load for all the edges along the path. The edge capacity was set as the maximum load this edge can handle. We denoted the capacity of edge i as ECi, and it was set proportional to the original load of this edge.
We assumed R as the volume of load evenly distributed at each source-destination pair in the network. In other words, R/(N(N−1)/2) volume of the load is assigned to each node pair and needs to be transported between two nodes. If R is small, then the load on each edge is smaller than the edge capacity. In this way, the network worked in the free flow state. On the contrary, if R is too large, there may be at least one congested edge, whose load is greater than its capacity. If this happens, then the network works in a congestion state [22]. Rc was defined as the maximum value of R that makes the network work without congestion. The value of Rc can reflect the maximum capability of the network handling load. Therefore, RC is called the maximum throughput of the network.
In the actual situation, there are two ways for nodes in the logistic network to fail. The first kind of fault is a random fault that is randomly selecting some nodes in the network to fail. The second kind of fault is the deliberate destruction of high degree nodes in the logistic network by external factors. No matter what kind of fault, the failed nodes cannot undertake transport tasks anymore. In our double-layer logistic network model, we assumed that if a city node fails, then its railway station (node in the lower layer) and its airport (node in the upper layer, if exists) will fail at the same time.
We assumed a proportion of randomly selected city nodes failed. In this way, the maximum network throughput will decrease, which hinders the original transportation task. Then, the task was to repair one failed node to make it work again to improve the maximum network throughput. Obviously, repairing different nodes may have a different effect. In the case of limited repairing resources, it is necessary to evaluate the importance of fault nodes and give priority to repairing the key node to improve network throughput. In this study, we are interested in the question as to which one should be chosen as the repairing node in order to recover the maximum network throughput the most. This is called the key repairing node.
Traditionally, there are some methods to identify the key node in complex networks. However, none of them focused on the node repairing process. In this part, we introduced four typical traditional methods to identify the key node.
Evaluation method (1): betweenness centrality (BC) [23]. BC characterizes the ability of nodes to transmit load along the shortest path in the network. The larger the betweenness of the node, the greater is the impact on network transmission. Therefore, the node is more important in the network. The betweenness of node i is defined as
where gst is the number of shortest paths from node s to node t, and
Evaluation method (2): degree centrality (DC). The most direct measure of node importance in complex networks is the degree of node, which is the number of nodes connected to it. The larger the degree of a node is, the more nodes it connects to, which means the node is more important. The degree of each city node is calculated by using this evaluation method. The node with the largest degree in the failure nodes is repaired.
Evaluation method (3): clustering coefficient (C) [24]. The clustering coefficient represents the degree of node aggregation in the network. The larger clustering coefficient of the node indicates that there are more connections between adjacent nodes of this node, which means the relationship between adjacent nodes of the node is closer. The clustering coefficient of node i is defined as
where Ei is the number of edges actually existing between ki adjacent nodes of node i, that is, the number of adjacent node pairs actually existing between ki adjacent nodes of node i. The clustering coefficient of each city node is calculated by using this evaluation method. The node with the largest clustering coefficient in the failed nodes is repaired.
Evaluation method (4): closeness centrality (CC) [25]. CC represents the topological distance between a node and other nodes. The greater the value of CC is, the more the node is located in the center of the network. Therefore, the node is more important in the network. The value of the CC of node i is defined as
where N is the number of city nodes, and Dij is the topological distance from node i to node j. The value of CC for each city node is calculated by using this evaluation method. The node with the largest value of CC in the failed nodes is repaired.
The aforementioned four methods only considered the impact of network topology on node importance. In the constructed transportation model, as the parameter m takes different values, the proportion of economic cost and time cost on each edge is different, and the total transportation cost on each edge will change accordingly. In order to minimize total transportation costs, transport routes in the network will also change. Therefore, with different values of m, the key node should be different. In complex networks, the BC and CC of nodes are affected by the route selection between nodes. Therefore, we considered modifying these two methods.
BC reflects the ability of nodes to transmit the load along the shortest path. However, in the logistic networks, the cost, rather than the shortest path length, is the key for transportation routing. Therefore, we proposed a modified BC, named route centrality (RC), to show the load of node i in the logistic network, defined as
where us→t is the load transported from node s to t, and
The CC measures the location of a node in the network by counting the distance between this node and all other nodes. In our logistic network model, the path may not be always the shortest path, so the distance should be re-calculated by considering the route planning process in logistic networks. Therefore, we proposed a modified CC, named spending centrality (SC) as
where W(Pi→j) can be obtained by using Eq. 4. It shows that the lower the cost of transporting materials to other nodes, the more important the node is in the logistic networks.
We considered that the purpose of repairing nodes is to improve the maximum throughput of the network and alleviate congestion. Therefore, the relationship between the position of the congested edge after a fault and the position of the fault nodes is crucial to the repairing process. Based on this consideration, we proposed a new method to identify the key repairing node.
Before giving the method, we defined DiE as the minimum topological distance from the fault node i to the congestion edge E. Then, we defined the load centrality (LC) as
where τi represents the set of nodes connected to node i, and vit denotes the load which is transported between nodes i and t. The larger the value of LC(i), the stronger is the ability of node i to transport load in its neighborhood.
We proposed a key repairing node identification strategy based on the network topology and load centrality (NTLC). The steps are as follows, and the flow diagram is shown in Figure 2.
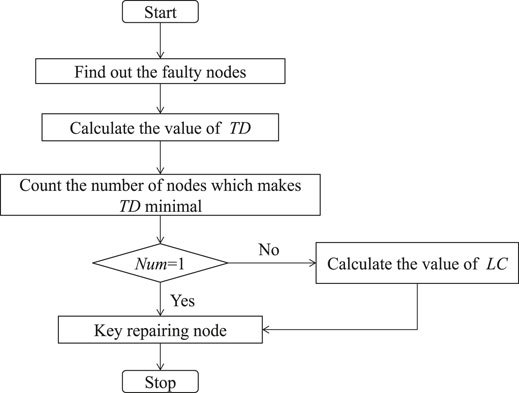
FIGURE 2. Flow diagram of the proposed key repairing node identification method.
First, in the faulty network, we observed the edge which congested first, and called it the congested edge. Then, the minimum topological distance was defined from the faulty node i to the congested edge as the minimum distance from the faulty node i to one end of the congested edge, and we denoted it as TD(i). For each faulty node i, we can get TD(i). Then, in all the faulty nodes, we found those which make TD(i) minimal and counted the number of those nodes as Num. If Num = 1, then that node which makes TD(i) minimal is a key repairing node. Otherwise, LC(i) was calculated for those nodes by using Eq. 10, and the one with the largest value of LC(i) is a key repairing node.
In this study, the key repairing node is the one repairing which can make the network performance increase the most. Here, we used three indicators to measure how good a method can be in successfully finding the best repairing node.
Performance indicator (1): maximum throughput of the network after repairing
Performance indicator (2): maximum throughput increasing rate θ. The repairing effect of different methods can also be measured by the relative increasing rate of the network maximum throughput after repairing. We defined the maximum throughput of the network before and after the repair as R1 and R2, respectively. Then the maximum throughput increasing rate of the network is
Performance indicator (3): Probability of finding the ground-truth best repairing node Pmax. The number of faulty nodes in the network is limited. Therefore, we evaluated them one by one to find the ground-truth best repairing node. If an identification method can always find the ground-truth best repairing node, then obviously this method is good. In practice, it is hard to always find the ground-truth best repairing node. So we used the probability of finding the ground-truth best repairing node as an indicator to show how good an identification method is.
In this study, we constructed the double-layer logistic network containing 500 nodes in the lower-layer network and 200 nodes in the upper-layer network. The upper-layer network and the lower-layer network used the same coordinates, which means that nodes in different layers but with the same coordinate are in the same city. Moreover, the average degrees of upper-layer networks and lower-layer networks are both approximately 10. According to the actual condition, the transportation speed ratio between the aviation network and railway network was set to 3:1, and the ratio for the transportation price per unit distance between the aviation network and railway network was set to 5:1. In the following simulations, the number of faulty nodes is 15. Considering the double-layer nature, 15 nodes in the lower layer are removed first, and their coupling nodes in the upper layer (if exist) are also removed afterward.
First, we considered the repair situation after random faults in the logistic network, as shown in Figure 3. We can see from Figure 3A that the maximum throughput of the network after repairing is greater than traditional methods and modified methods when the node identified by NTLC is repaired. To further reflect the repair situation of the seven evaluation methods, Figure 3B shows the increasing rate of the maximum throughput of the network after repair. We can see that repairing the node identified by traditional methods and modified methods can improve the maximum throughput of the logistic network after a fault. However, the repair effect is relatively little. NTLC is proposed considering network topology and local load. Repairing the node identified by it can effectively improve the performance of the logistic network. Figure 3C shows the probability of identifying the ground-truth key repairing nodes by using different methods. It is obvious that NTLC has the highest probability of successfully identifying the key repairing node among seven methods. In conclusion, under different m values, repairing the node identified by NTLC can maximize the throughput of the logistic network after a random fault.
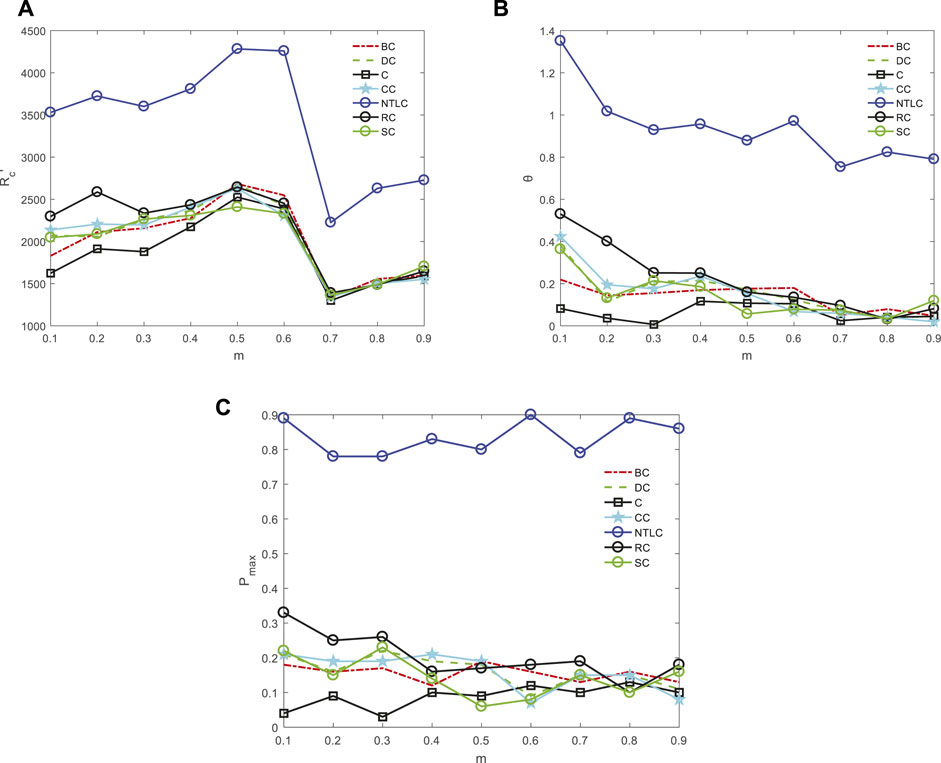
FIGURE 3. Repair effect of seven methods when some nodes in the network have random failures. (A) Maximum throughput of the network after repairing; (B) maximum throughput increasing rate of the network after repairing; (C) probability of finding the ground-truth best repairing node. The results are averaged over 100 realizations.
When the logistic network is deliberately damaged so that 15 nodes with the highest degrees are removed, the repairing effect is shown in Figure 4. The aforementioned conclusions can still be obtained.
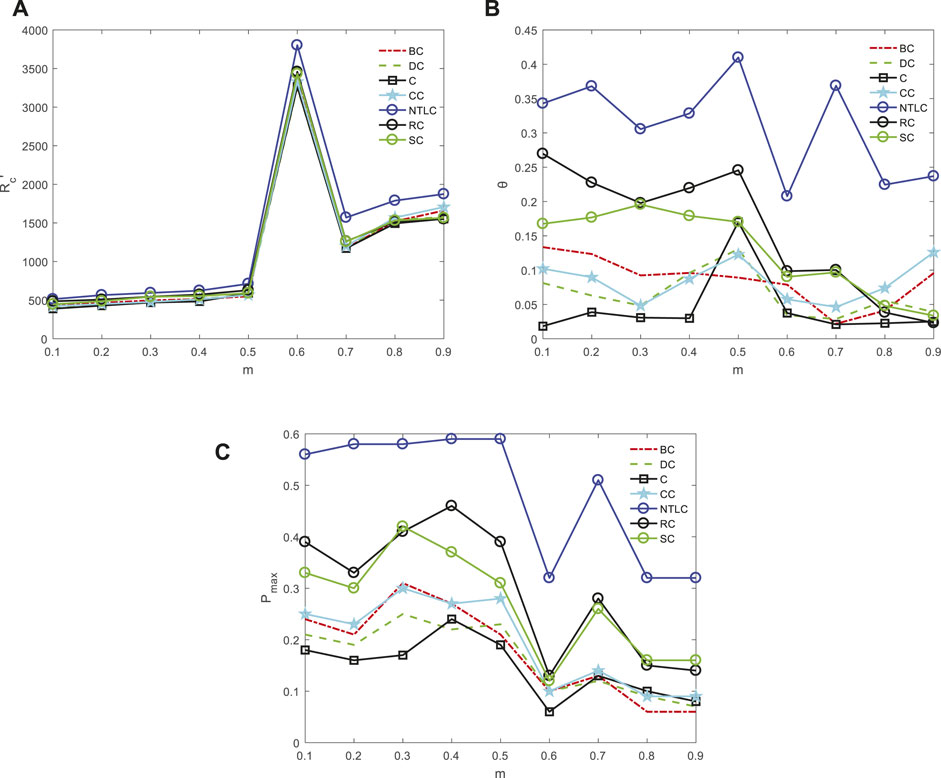
FIGURE 4. Repair effect of seven methods when some nodes in the network are deliberately damaged. (A) Maximum throughput of the network after repairing; (B) maximum throughput increasing rate of the network after repairing; (C) probability of finding the ground-truth best repairing node. The results are averaged over 100 realizations.
It can be concluded from Figures 3, 4 that compared with the other four traditional key node identification methods and two modified methods, the proposed strategy can effectively identify the key repairing node under either random failures or intentional attacks. The reason is that the key repairing node identified by the proposed strategy is closer to the congested edge of the damaged network, and it plays an important role in transporting load in the local network. The recovery of this node changes the routing situation near the congested edge, which may release the burden of the congested edge. In this way, it makes the network congestion alleviate and effectively improve the performance of the logistic network.
Comparing Figures 3, 4, it can be observed that the repairing effect of the logistic network after the intentional destructions is significantly lower than that after random faults. The reason is that compared with random faults, intentional destructions have a stronger damage effect on the network.
To guarantee the operation of the logistic network, it not only faces the possible fault of nodes but also needs to effectively repair the fault. Most of the traditional evaluation methods for the key node are concerned about which node’s failure will have the greatest impact on the network, and no effective evaluation method for the key repairing node is proposed yet. In order to solve this problem, this study proposes an effective evaluation strategy NTLC for the key repairing node based on network topology and load centrality. The proposed method uses the location information between faulty nodes and the congested edge. Compared with four typical key node evaluation methods and two modified methods, the proposed strategy has obvious advantages to improve the maximum throughput of the network, the maximum throughput increasing rate, and the probability of finding the best repairing node. The proposed method may be useful to improve network resilience.
The original contributions presented in the study are included in the article/Supplementary Material; further inquiries can be directed to the corresponding author.
All authors listed have made a substantial, direct, and intellectual contribution to the work and approved it for publication.
This work was supported in part by the Laboratory of Science and Technology on Integrated Logistics Support, China.
The authors declare that the research was conducted in the absence of any commercial or financial relationships that could be construed as a potential conflict of interest.
All claims expressed in this article are solely those of the authors and do not necessarily represent those of their affiliated organizations, or those of the publisher, the editors, and the reviewers. Any product that may be evaluated in this article, or claim that may be made by its manufacturer, is not guaranteed or endorsed by the publisher.
1. Feng X, He S-W, Li Y-B. Temporal Characteristics and Reliability Analysis of Railway Transportation Networks. Transportmetrica A: Transport Sci (2019) 15:1825–47. doi:10.1080/23249935.2019.1647308
2. Zhu Y, Fan H, Feng G. Vital Nodes Study on Airway Network of Silk Road Economic belt. Journal of Data Analysis and Information Processing (2017) 05:67–76. doi:10.4236/jdaip.2017.53005
3. Jia H-d., Li Q. Analysis of Spatial Interaction Vitality Based on High-Speed Railway Network and Highway Network. J Phys Conf Ser (2020) 1682:012082. doi:10.1088/1742-6596/1682/1/012082
4. Du Y, Gao C, Hu Y, Mahadevan S, Deng Y. A New Method of Identifying Influential Nodes in Complex Networks Based on Topsis. Physica A: Stat Mech its Appl (2014) 399:57–69. doi:10.1016/j.physa.2013.12.031
5. Fei L, Deng Y. A New Method to Identify Influential Nodes Based on Relative Entropy. Chaos, Solitons & Fractals (2017) 104:257–67. doi:10.1016/j.chaos.2017.08.010
6. Yang H, An S. Critical Nodes Identification in Complex Networks. Symmetry (2020) 12:123. doi:10.3390/sym12010123
7. Hu P, Fan W, Mei S. Identifying Node Importance in Complex Networks. Physica A: Stat Mech its Appl (2015) 429:169–76. doi:10.1016/j.physa.2015.02.002
8. Ruan Y, Tang J, Hu Y, Wang H, Bai L. Efficient Algorithm for the Identification of Node Significance in Complex Network. IEEE Access (2020) 8:28947–55. doi:10.1109/ACCESS.2020.2972107
9. Yang Y, Yu L, Wang X, Zhou Z, Chen Y, Kou T. A Novel Method to Evaluate Node Importance in Complex Networks. Physica A: Stat Mech its Appl (2019) 526:121118. doi:10.1016/j.physa.2019.121118
10. Fei L, Mo H, Deng Y. A New Method to Identify Influential Nodes Based on Combining of Existing Centrality Measures. Mod Phys Lett B (2017) 31:1750243. doi:10.1142/S0217984917502438
11. Chen B, Wang Z, Wang Z, Luo C. Integrated Evaluation Approach for Node Importance of Complex Networks Based on Relative Entropy. Journal of Systems Engineering and Electronics (2016) 27:1219–26. doi:10.21629/JSEE.2016.06.10
12. Nie T, Guo Z, Zhao K, Lu Z-M. Using Mapping Entropy to Identify Node Centrality in Complex Networks. Physica A: Stat Mech its Appl (2016) 453:290–7. doi:10.1016/j.physa.2016.02.009
13. Tang P, Song C, Ding W, Ma J, Dong J, Huang L. Research on the Node Importance of a Weighted Network Based on the K-Order Propagation Number Algorithm. Entropy (2020) 22:364. doi:10.3390/e22030364
14. Xu S, Xia Y, Ouyang M. Effect of Resource Allocation to the Recovery of Scale-free Networks during Cascading Failures. Physica A: Stat Mech its Appl (2020) 540:123157. doi:10.1016/j.physa.2019.123157
15. Pei J, Liu Y, Wang W, Gong J. Cascading Failures in Multiplex Network under Flow Redistribution. Physica A: Stat Mech its Appl (2021) 583:126340. doi:10.1016/j.physa.2021.126340
16. Zhang M, Wang X, Jin L, Song M. Cascade Phenomenon in Multilayer Networks with Dependence Groups and Hierarchical Structure. Physica A: Stat Mech its Appl (2021) 581:126201. doi:10.1016/j.physa.2021.126201
17. Cumelles J, Lordan O, Sallan JM. Cascading Failures in Airport Networks. J Air Transport Manage (2021) 92:102026. doi:10.1016/j.jairtraman.2021.102026
18. Motter AE, Lai Y-C. Cascade-based Attacks on Complex Networks. Phys Rev E (2002) 66:065102. doi:10.1103/physreve.66.065102
19. Guida M, Maria F. Topology of the Italian Airport Network: A Scale-free Small-World Network with a Fractal Structure? Chaos, Solitons & Fractals (2007) 31:527–36. doi:10.1016/j.chaos.2006.02.007
20. Barabási AL, Albert R. Emergence of Scaling in Random Networks. Science (1999) 286:509–12. doi:10.1126/science.286.5439.509
21. Xia Y, Wang C, Shen H-L, Song H. Cascading Failures in Spatial Complex Networks. Physica A: Stat Mech its Appl (2020) 559:125071. doi:10.1016/j.physa.2020.125071
22. Guimerà R, Díaz-Guilera A, Vega-Redondo F, Cabrales A, Arenas A. Optimal Network Topologies for Local Search with Congestion. Phys Rev Lett (2002) 89:248701. doi:10.1103/PhysRevLett.89.248701
23. Freeman LC. A Set of Measures of Centrality Based on Betweenness. Sociometry (1977) 40:35–41. doi:10.2307/3033543
24. Watts DJ, Strogatz SH. Collective Dynamics of 'small-World' Networks. Nature (1998) 393:440–2. doi:10.1038/30918
Keywords: complex networks, multi-layer networks, logistic network, congestion, key repairing node, network topology
Citation: Zhu L, Xia Y, Bai G and Fang Y (2022) Key Repairing Node Identification in Double-Layer Logistic Networks. Front. Phys. 10:919455. doi: 10.3389/fphy.2022.919455
Received: 13 April 2022; Accepted: 27 April 2022;
Published: 06 June 2022.
Edited by:
Xiaojie Chen, University of Electronic Science and Technology of China, ChinaReviewed by:
Cunlai Pu, Nanjing University of Science and Technology, ChinaCopyright © 2022 Zhu, Xia, Bai and Fang. This is an open-access article distributed under the terms of the Creative Commons Attribution License (CC BY). The use, distribution or reproduction in other forums is permitted, provided the original author(s) and the copyright owner(s) are credited and that the original publication in this journal is cited, in accordance with accepted academic practice. No use, distribution or reproduction is permitted which does not comply with these terms.
*Correspondence: Yongxiang Xia, eGlheXhAaGR1LmVkdS5jbg==
Disclaimer: All claims expressed in this article are solely those of the authors and do not necessarily represent those of their affiliated organizations, or those of the publisher, the editors and the reviewers. Any product that may be evaluated in this article or claim that may be made by its manufacturer is not guaranteed or endorsed by the publisher.
Research integrity at Frontiers
Learn more about the work of our research integrity team to safeguard the quality of each article we publish.