 Ren-De Li
 Qiang Guo
 Xue-Kui Zhang2
95% of researchers rate our articles as excellent or good
Learn more about the work of our research integrity team to safeguard the quality of each article we publish.
Find out more
ORIGINAL RESEARCH article
Front. Phys. , 24 June 2022
Sec. Social Physics
Volume 10 - 2022 | https://doi.org/10.3389/fphy.2022.918663
This article is part of the Research Topic Social Economic Networks View all 10 articles
Event detection plays a crucial role in social media analysis, which usually concludes sub-event detection and correlation. In this article, we present a method for reconstructing the unfolding sub-event relations in terms of external expert knowledge. First, a Single Pass Clustering method is utilized to summarize massive social media posts. Second, a Label Propagation Algorithm is introduced to detect the sub-event according to the expert labeling. Third, a Word Mover’s Distance method is used to measure the correlation between the relevant sub-events. Finally, the Markov Chain Monte Carlo simulation method is presented to regenerate the popularity of social media posts. The experimental results show that the popularity dynamic of the empirical social media sub-events is consistent with the data generated by the proposed method. The evaluation of the unfolding model is 50.52% ∼ 88% higher than that of the random null model in the case of “Shanghai Tesla self-ignition incident.” This work is helpful for understanding the popularity mechanism of the unfolding events for online social media.
Unfolding sub-events of a social media event could tell a storyline of public opinions during the event development [1]. Every time when a large-scale incident occurs, around the theme, it will be accompanied by the generation of a lot of discussion and various opinions. A sub-event is a component of a complex event since the topic of public opinions evolves with the development of events. When individuals, celebrities, enterprises, or governments encounter a public relations (PR) crisis, it is difficult to grasp the direction of public opinion from the uncontrolled interpretation of thousands of people. It is vital for PR managers to clarify the trend of public opinion from sub-events of the incident.
For PR crisis events, it has similar characteristics of emergency or epidemic events, such as natural disasters [2, 3], epidemic spreading [4, 5], and sports competitions [6, 7]. The information related to disaster events can be uploaded and reported, which contributes to the disaster reporting [8]. On social media, events and their related sub-events can be discussed or explored through public online posts.
Sub-event identification faces two challenges of ambiguous distinguishability. First is whether similar expressions are effectively distinguished. Online posts contain a massive amount of re-posts or similar user expressions. Second is whether the related expressions can be effectively distinguished. The discussions and expressions will form different topics, reflecting the sub-events from the perspective of user-generated content. But a post belonging to which sub-event needs to be classified. A clear division of sub-events can provide effective support for correlation and evolution analyses.
Inspired by the idea, we present a mode to detect and correlate the sub-events, which aims to unfold a complex event into correlated sub-events and predict the popularity dynamic of social media events. During the modeling process, it is about to solve the two issues which are the ambiguities of sub-event classification (the former two steps of Figure 1) and correlation between sub-events (the latter two steps of Figure 1). As shown in Figure 1A, after collecting the social media posts, a fast clustering method is used to cluster similar posts. The procedure is to reduce the redundancy among replicate posts and each classification stands for a summarized post. In order to unfold the sub-event to meet with the knowledge of PR managers, expert labeling is given and used to predict the unlabeled summarized posts (Figure 1B). Each label represents a topic concerned by PR managers, which is defined as a sub-event. The topic correlation is measured by the number of paired posts between sub-events (Figure 1C). Finally, by using the Markov Chain Monte Carlo simulation, each development trend of the sub-event can be depicted and compared to the real world topic evolution (Figure 1D). This procedure regenerates the results of sub-event popularity curves and will be verified by a null model with random labels.
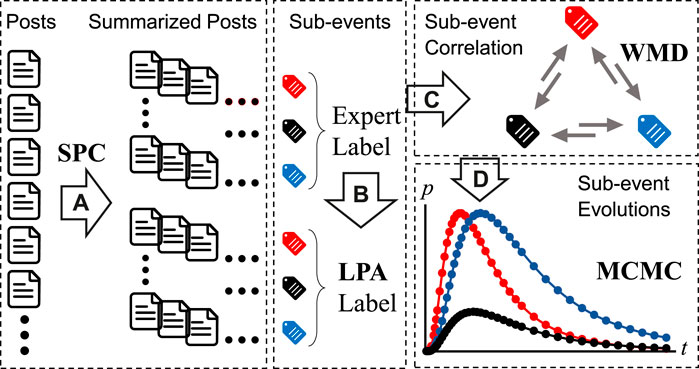
FIGURE 1. (Color online) Schematic illustration of the proposed method. (A) Post summary is conducted by Single Pass Clustering (SPC). (B) Sub-event labeling is executed by the Label Propagation Algorithm (LPA). (C) Sub-event correlation is carried out by Word Mover’s Distance (WMD). (D) Sub-event evolution is regenerated by Markov Chain Monte Carlo (MCMC).
In order to correctly observe the filtering of the results from public information, a classic model considers the impact of sharing such information on the analytical foundations of reliable sensing [9]. The observations can be obtained by the text, image, video, and voice message provided by social media users. [10]. Based on these observations, several unfolding methods have been developed. CrisisTracker’s clustering system [11] includes event detection, content ranking, and summarization while retaining the drill-down functionality to raw reports. The security information and event management systems could also connect events by pattern matching [12]. An ontology method systematizes the available solutions under a modular- and platform-independent conceptual framework [13]. An iterative expectation-maximization algorithm is proposed to find the truth of the events in social sensing with information flows. Among these studies, the verification of events or sub-events is based on the supervised learning with specific labels, whereas PR crisis usually has no label for identification.
Although some research has examined the use of social media for mitigating crises and emergencies [14–16], the use of specialized detection methods [17] for clarifying the ambiguity of classification is still lacking. The main challenge is to find the popularity mechanism of social media events. In this article, we use public observations to sort out the sub-events by combining the expert knowledge and correlate these sub-events to a topic tree and popularity trends for the event storyline.
An event usually contains the cause and result stages, where the sub-event refers to one of the stages of an event [18]. The sub-event detection can be achieved by many classic unsupervised methods as follows: 1) the burst-topic detection is used to identify important moments, which argues that the sharp increase in the number of status updates corresponds to the occurrence of important moments in the event [19]. 2) The event summarization usually contains machine learning techniques such as hidden Markov model [20], hierarchical Dirichlet processes [21], and graph optimization formulation [7]. 3) The clustering approaches include word co-occurrence [22], hierarchical clustering algorithm [23], K-nearest neighbor clustering approach [24], artificial neural networks [10], support vector machine [25]. 4) The spatial and temporal distribution methods are also widely used [3, 26, 27].
One major theoretical issue that has dominated the unsupervised detection field for many years concerns the ambiguity of classification for a sub-event. Semi-supervised approaches have also been explored for this task, especially concerning crisis events [28, 29]. However, due to a lack of expert knowledge, the effect of classification may derive from the common sense of PR management. In this article, we proposed a simple procedure to summarize the sub-events by combining the clustering-based single pass algorithm and graph-based label propagation algorithm by introducing the expert knowledge. The Single Pass Clustering (SPC) is a method to simply merge similar posts. The Label Propagation Algorithm (LPA) is to solve the ambiguity and gives a clear classification based on expert knowledge.
The correlation approach contains a causality or correlation pattern of sub-events. Two kinds of methods can reveal the unfolding event to evolve. The first one is graph-based methods, which concerns the correlation pattern of sub-events. A maximum-weighted bipartite graph matching is created to correlate events [30]. The recurrent sequence model [31, 32] has experimented with a recurrent neural network of LSTM for script learning to predict the probability of the next event. An event-oriented similarity graph is designed to represent the relationship among sub-events [18]. A subgraph similarity is used to measure the event relationships and generate an evolution correlation [33]. The second one is causal inference methods, which concern the causality patterns of sub-events. The generalization of redefining mining aims to find the correlation between disjoint sets of related objects [1]. An event–level attention mechanism is utilized to represent the relations between subsequent events [34]. A logical correlation is proposed for common sense inference of the given event [35]. An event ontology knowledge model is built to construct the evolution patterns [36].
These methods are based on a network or sequential perspective. However, if sub-event correlation refers to topic-level correlation, there will be a multiple pair problem. One sub-event contains several posts about a topic and so does the other sub-events. The correlation of sub-events happens between the topic posts. PR managers are sensitive to the posts that change with the topic evolving [37], but few studies have supported the topic-level correlation. Although the LDA-based model could extract the topics [2, 38], the correlation between the posts inside of topics is still an open question. In this article, the Word Mover’s Distance (WMD) method is applied to calculate the correlation of the posts in different topics (sub-events). Then, the Markov Chain Monte Carlo (MCMC) simulation method is introduced to predict topics’ evolutionary trends.
The SPC method is a classical method for streaming data clustering. For data streams arriving in sequence, the method processes the data once at a time in the order of input. It is an incremental algorithm, which has a high time efficiency. The shortcoming is that the method depends on the input order. If the data streams arrive in different orders, different clustering results will appear.
Given the Weibo post document set d = {d1, d2, … , dm}, each document di contains a variable length sequence of words
where wt is the target word, ct is the word’s local context,
The loss function is:
Using the training model, each document can be represented as an average of embeddings of the words:
where di is the vector for document di and w is a row in U and is the embedding for word w.
The similarity of the two post document vectors di and dj is measured by cosine metric:
The SPC method is used to cluster the posts roughly since it only process the post documents once. The algorithm is as follows:
Algorithm 1. Single Pass Clustering (SPC)
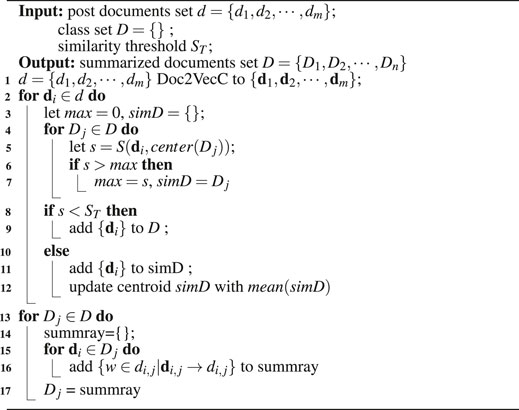
Step 1: Assign the first document d1 as the representative for D1.Step 2: For di, calculate the document similarity S with the representative for each existing cluster.Step 3: If Smax is greater than a threshold value ST, add the item to the corresponding cluster and recalculate the cluster representative; otherwise, use di to initiate a new cluster.Step 4: If di remains to be clustered, return to step 2.The representative is the mean vector of a cluster. After the SPC process, we denote the document vector i ∈ [1, m] from cluster j ∈ [1, n] as di,j, and the corresponding document as di,j. The clustering set is expressed as D = {D1, D2, … , Dn}.The number of cluster n is much smaller than the length of posts m. The micro-blog’s posts have the attributes of redundancy since a large proportion of user’s re-posts. The SPC method is to largely reduce the redundancy among posts.In order to summarize the words of each clustering, we define
Then, the vector of the summarized document Dj can also be calculated by Eq 3. After we get the summarized posts, the next task is to label these data.
The expert knowledge is introduced to label the summarized posts. Experts need to label a small part of the summarized posts to feed the LPA. The LPA considers that the label of each node should be similar to most of its neighbors, and the label is “propagated” to form the same “label” within the same “community” based on the network perspective.
Given annotated data (D1, y1), … (Dl, yl) and the labeled set Yl = {y1, … , yl} ∈ {1, … , C}, where the category C is given by expert and present in the labeled data. Unlabeled data are (Dl+1, yl+1), … (Dl+u, yl+u), and Yu = {yl+1, … , yl+u} is the labeled set to predict, where l + u = n and L ≪ u. The Label Propagation Algorithm (LPA) is used to predict Yu by Yl and X = Xl ∪ Xu = {D1, … , Dl+u}.
Algorithm 2. Label Propagation Algorithm (LPA)
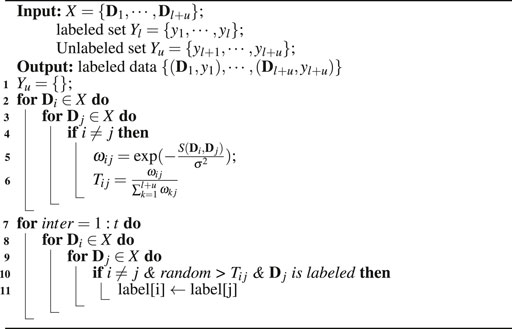
A fully connected graph is created so that each sample point (labeled and unlabeled) is treated as a node. The following weight calculation is used to set the weights of the edges between two points i,j:
where the parameter σ is adjustable. Then, the probabilistic transition matrix T ∈ (l + u) × (l + u) is defined as:
The element Tij is the probability of label j propagating to label i. By probability propagation, the probability distribution is concentrated in a given class, and then the node labels are passed through the weights of the edges. We can express the random walks as given below:
where yi [c] is the probability of node Di ∈ Xu to have label c. The probability
In the matrix form, Eq 8 can be induced as flowing:
where the label vectors of labeled nodes
In order to correlate the posts between the sub-events, the WMD method is introduced. According to the LPA results, each label represents a sub-event and includes several summarized posts. The WMD is used to calculate the pairs between summarized posts of sub-events. The WMD method measures the semantic distance of the two documents. Each document is a summarized post.
The post document with labeled c is added into the set
In order to build the correlation between sub-events, Word Mover’s Distance (WMD) is used to identify the similarity between classifications. WMD is a distance between two text documents x, y. Let |x|, |y| be the number of distinct words in x, y. The normalized frequency vectors of each word in x and y are respectively expressed as
where F is the transportation flow matrix with Fij denoting the amount of flow traveling from word i in x to word j in y and S is the transportation cost with Sij = S (wi, wj) being the distance between two words measured by the Doc2VecC.
Algorithm 3. Word Mover’s Distance (WMD)
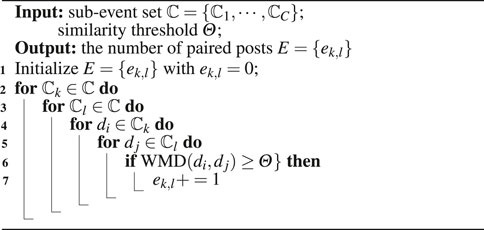
According to the WMD method, one can establish relevant relationships of sub-events according to the similarity between the post di in sub-event classifications
where Θ is a threshold value.
The WMD method gives the pairs between different sub-events. The core task of our method is to acquire the prior probability and evolution probability, so that the correlation and evolutionary trends can be built.
The prior probability of each sub-event is calculated by using the statistical probability:
where
The evolution probability between sub-event pairs is calculated using the conditional probability:
According to the Metropolis rejection defined by Hastings, the acceptance probability is:
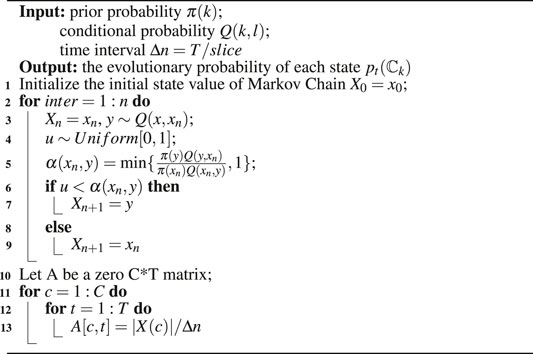
The Metropolis–Hastings update makes one proposal l, which is the new state with probability α(k, l) but otherwise, the new state is the same as the old state k. By using the Metropolis–Hastings algorithm, one can get the sample collection, which the element is the type of sub-event. Given the length of sample collection T and the number of time slice, each time step t includes the Δn samples. The probability of a sub-event
Algorithm 4. MCMC: Metropolis–Hastings algorithm
In the end of the model process, the regenerated popularity curves of every sub-event can be obtained.
The regenerated popularities have to be evaluated by comparing the real dynamic model and a random model for reference.
The real evolution of the “Shanghai Tesla self-ignition incident” is measured by
where each time step t includes the
Jensen–Shannon Divergence (short for JSD) [39] is introduced to measure the similarity between real distribution p1 and MCMC distribution p2 and is defined as:
where p1 and p2 are the two distributions to be compared and H(p) represents the Shannon entropy. The lower bound is JSD = 0 only when two distributions are identical. The smaller the JSD value is, the more similar the two distributions are.
Then, a null model is built for the reference effect. Keeping the other steps of the proposed method, the null model replaces the LPA process with random labels. The evaluation still compares the simulated popularity curve and real evolutionary curve of each sub-event. The improvement rate is calculated by the difference of JSD between the null model and the proposed model divided by the JSD value of the null model.
The experiment dataset comes from the competition of WRD Big Data, which are about the “Shanghai Tesla self-ignition incident” Weibo data, with 61,688 blog posts from 21 April 2019 to 5 May 2019. The incident is about a Tesla car suddenly smoking and self-igniting, which caused heated public debates on safety and the enterprise’s responsibility. Data pre-processing process is conducted to delete the data labeled as robots, the data of re-tweets without own comment, and microblogging texts less than 10 words. In the remaining 40,119 blog posts, after replacing the deleted stop-words, emojis, special characters, HTML tags, and URLs of various hyperlinks, the TextRank algorithm is used to extract the keywords from the set of blog posts after the word segmentation, and each blog post contains 10 keywords. The unfolding model is conducted as follows.
The first step is to cluster similar posts. By using the SPC method, the original 40,119 blog posts are summarized to 4,050 posts. Each summarized post contains a number of similar documents, in which users are talking about the same content. After sorting the number of documents in descending order, the number of original posts in each summarized post approximately follows the power-law distribution (Figure 2). The results indicate that a large number of post documents are concentrated in a small number of clusters.
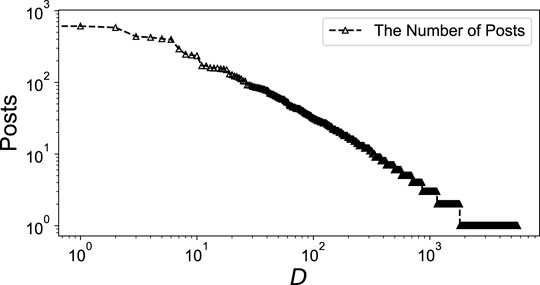
FIGURE 2. Number of posts in each summarized post D.
As is shown in Table 1, there are two typical posts that can be summarized according to the similarity threshold. Here, we set the similarity threshold as 0.75 in SPC. The first kind of similarity is the posts talking about the same content, such as the records 1 and 2 can be seen as one. The second is simply the same content’s re-post, such as the records 3 and 4 are also summarized as one. When the similarity of the post is smaller than the threshold, the records would not be summarized. The records 5 and 6 still stand respectively for two posts. In the last two columns, experts label the summarized posts according to the keywords of the events. There are 8 labels concluded by three experts, i.e. Event Happen, Corporate Respond, Client Respond, Media Report, Fire Control, Weibo Discuss, Event Processing, and Expert Opinion, which are labeled in the first 600 summarized posts.
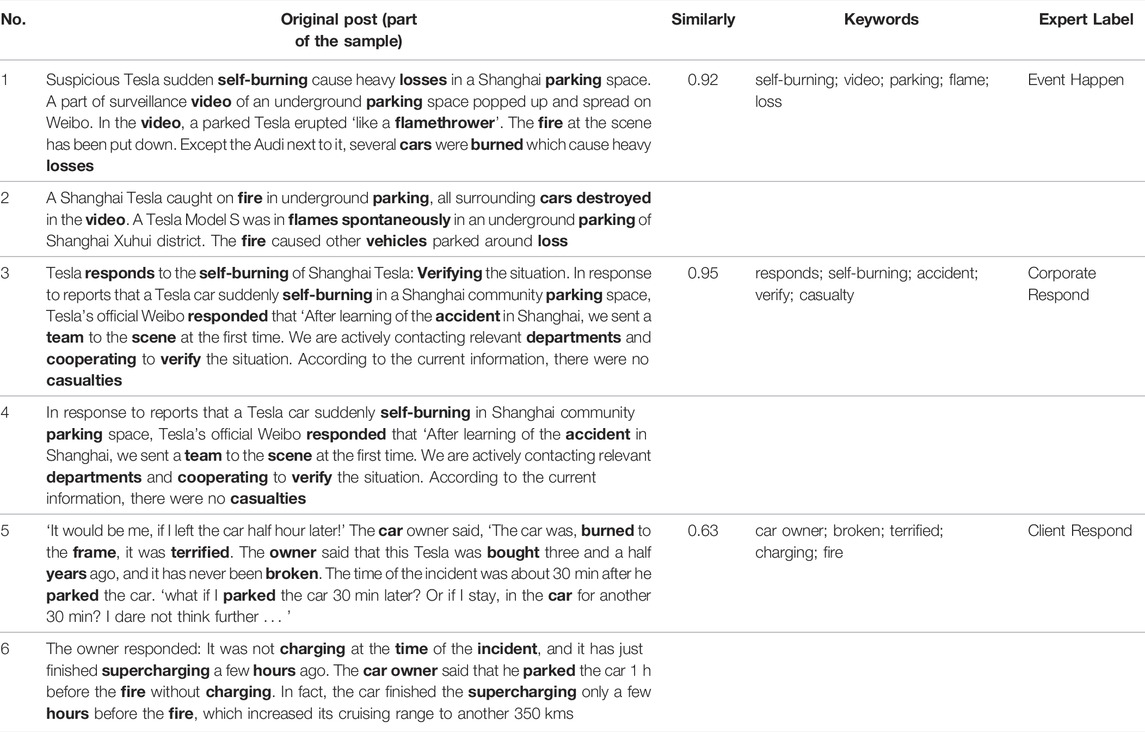
TABLE 1. Example of summarized posts.
The second step is to extract the sub-events. The results are in the form of labeling, which can be seen in Table 2. It gives the standards of expert labeling and the number and prior probability of labeling after the process of the LPA method. The standards of labeling are defined by experts when the first 600 summarized posts are labeled. The frequency of each sub-event
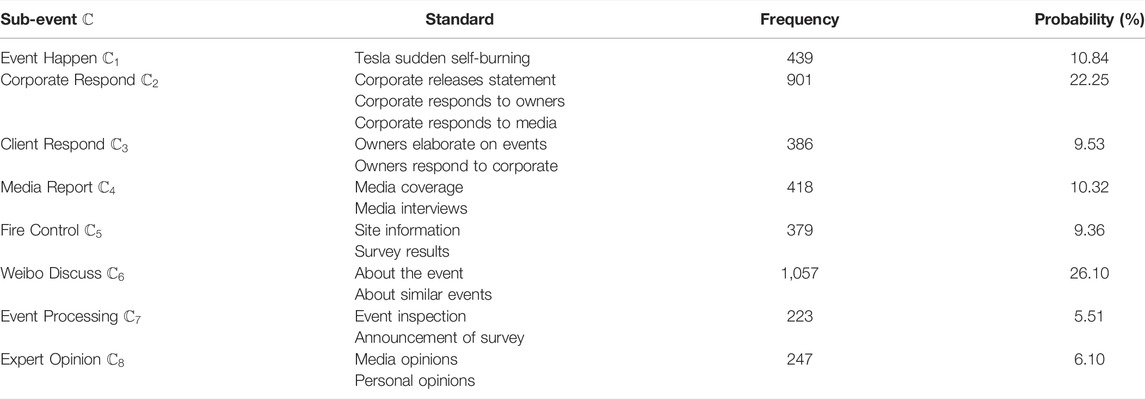
TABLE 2. Label information of sub-events.
The third step is to correlate the sub-events. Through the WMD method, the numbers of pairs between sub-events are used to calculate the evolution probability. The results are shown in Figure 3 as a topic-changing tree. Based on prior probability and evolution probability, the MCMC simulation gives the probability distribution of each sub-event.
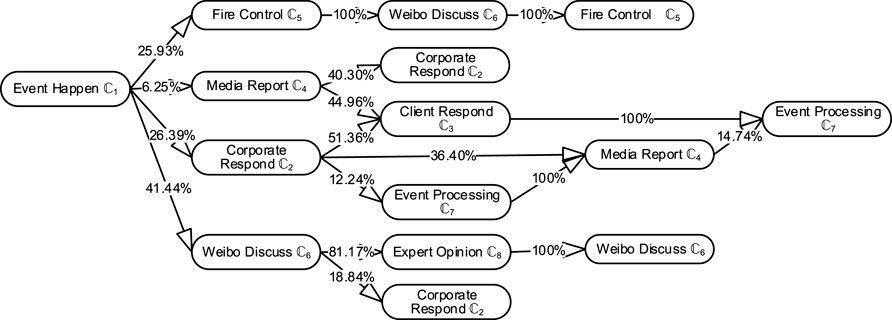
FIGURE 3. Correlation of sub-events as a topic tree.
Finally, the fourth step is to verify the development of the sub-event. The regenerated sub-event curves are compared with the real popularity curves as shown in Figure 4. The JSD value equals 0.0950, 0.0841, 0.0635, 0.06804, 0.2304, 0.2135, 0.3727, and 0.1377 respectively for Event Happen
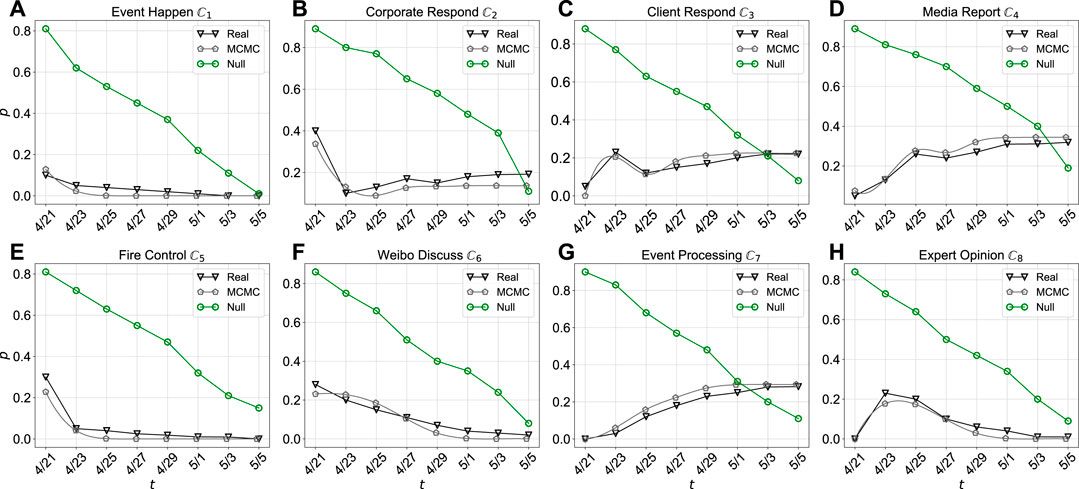
FIGURE 4. Popularity curve of sub-event development. Three curves are the real popularity dynamic, the popularity of unfolding model regenerated by MCMC, and the reference popularity of null model. The evaluations are between the three curves by JSD. For example in (A), the JSD value between real and MCMC popularity is 0.095, which shows the close trends between unfolding model and real dynamic. The JSD value between MCMC and null popularity is 0.7329, indicating the significant difference between the unfolding model and the random model. The rest of JSD values (B–H) can be seen in Table 3.
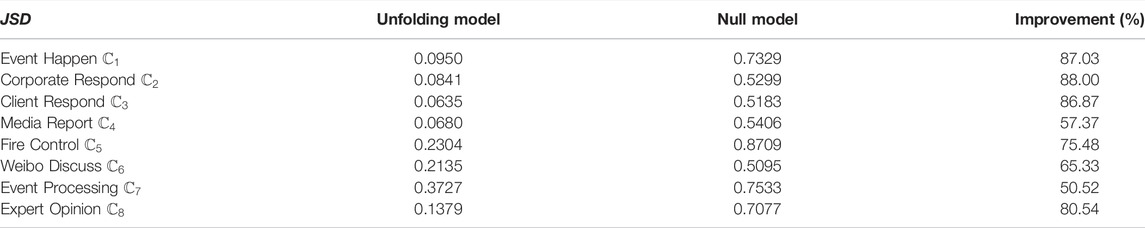
TABLE 3. Model evaluation.
In this article, we use Single Pass Clustering (SPC) to summarize the massive posts. The step is to reduce the redundancy among similar posts and form summarized posts. Then, the Label Propagation Algorithm (LPA) is introduced so that the small-scale expert labels can spread to the whole datasets. Each label is a topic concerned by PR managers and represents a sub-event. The SPC and LPA processes complete the sub-event detection. Among the summarized posts between sub-events, we use Word Mover’s Distance (WMD) to pair the correlated documents. Markov Chain Monte Carlo (MCMC) simulation is finally used to correlate the sub-events and predict each sub-event evolutionary. The WMD and MCMC complete the sub-event correlation. The results show that the procedure is 50.52% ∼ 88% higher than the random null model in the case of “Shanghai Tesla self-ignition incident”.
The reconstruction method can help to intuitively understand different sides of the events and the hotspot shift of public opinion. But there are several limitations of this article. First, external knowledge deserves further study to enhance the comprehensibility and accuracy of sub-events. Second, similarity measurements are essential for the results of classification [40], and which measurement is stable for Weibo post classification is an open question. Third, time-line correlation should be introduced into topic-level sub-event development trends [41]. Lastly, the approach of network reconstruction [42, 43, 44] can be integrated into content reconstruction.
The raw data supporting the conclusion of this article will be made available by the authors, without undue reservation.
R-DL provided this topic and wrote the manuscript. QG, X-KZ, and J-GL guided, discussed, and modified the manuscript. All authors contributed to the manuscript and approved the submitted version.
This research was funded by the National Natural Science Foundation of China (NNSFC) (Grant Nos. 71901144, 71771152, 61773248, 72032003, and 72171150), the Major Program of the National Fund of Philosophy and Social Science of China (Nos. 20ZDA060 and 18ZDA088), and the Fund of University of Shanghai for Science and Technology (No. CFTD223049).
The authors declare that the research was conducted in the absence of any commercial or financial relationships that could be construed as a potential conflict of interest.
All claims expressed in this article are solely those of the authors and do not necessarily represent those of their affiliated organizations, or those of the publisher, the editors, and the reviewers. Any product that may be evaluated in this article, or claim that may be made by its manufacturer, is not guaranteed or endorsed by the publisher.
We thank Chun-ping Cao, Yu Li, Kai-ge Yuan, and Yue Lu for preliminary experience in the second competition of WRD Big Data.
1. Kumar D, Ramakrishnan N, Helm RF, Potts M. Algorithms for Storytelling. IEEE Trans Knowl Data Eng (2008) 20:736–51. doi:10.1109/tkde.2008.32
2. Wu Q, Ma S, Liu Y. Sub-Event Discovery and Retrieval During Natural Hazards on Social Media Data. World Wide Web (2016) 19:277–97. doi:10.1007/s11280-015-0359-8
3. Pohl D, Bouchachia A, Hellwagner H. Online Indexing and Clustering of Social media Data for Emergency Management. Neurocomputing (2016) 172:168–79. doi:10.1016/j.neucom.2015.01.084
4. Rashid MT, Wang D. Covidsens: a Vision on Reliable Social Sensing for Covid-19. Artif intelligence Rev (2020) 1–25. doi:10.1007/s10462-020-09852-3
5. Nolasco D, Oliveira J. Mining Social Influence in Science and Vice-Versa: A Topic Correlation Approach. Int J Inf Management (2020) 51:102017. doi:10.1016/j.ijinfomgt.2019.10.002
6. Huang Y, Shen C, Li T. Event Summarization for Sports Games Using Twitter Streams. World Wide Web (2018) 21:609–27. doi:10.1007/s11280-017-0477-6
7. Meladianos P, Xypolopoulos C, Nikolentzos G, Vazirgiannis M. An Optimization Approach for Sub-event Detection and Summarization in Twitter. In: European Conference on Information Retrieval (Springer) (2018). p. 481–93. doi:10.1007/978-3-319-76941-7_36
8. Phengsuwan J, Shah T, Thekkummal NB, Wen Z, Sun R, Pullarkatt D, et al. Use of Social media Data in Disaster Management: A Survey. Future Internet (2021) 13:46. doi:10.3390/fi13020046
9. Wang D, Amin MT, Li S, Abdelzaher T, Kaplan L, Gu S, et al. Using Humans as Sensors: an Estimation-Theoretic Perspective. In: IPSN-14 proceedings of the 13th international symposium on information processing in sensor networks (IEEE) (2014). p. 35–46. doi:10.1109/ipsn.2014.6846739
10. Pohl D, Bouchachia A, Hellwagner H. Automatic Sub-event Detection in Emergency Management Using Social media. In: Proceedings of the 21st international conference on world wide web (2012). p. 683–6. doi:10.1145/2187980.2188180
11. Rogstadius J, Vukovic M, Teixeira CA, Kostakos V, Karapanos E, Laredo JA. Crisistracker: Crowdsourced Social media Curation for Disaster Awareness. IBM J Res Development (2013) 57:4–1. doi:10.1147/jrd.2013.2260692
12. Vielberth M, Menges F, Pernul G. Human-as-a-security-sensor for Harvesting Threat Intelligence. Cybersecurity (2019) 2:1–15. doi:10.1186/s42400-019-0040-0
13. Avvenuti M, Cimino MG, Cresci S, Marchetti A, Tesconi M. A Framework for Detecting Unfolding Emergencies Using Humans as Sensors. SpringerPlus (2016) 5:43–23. doi:10.1186/s40064-016-1674-y
14. Jin Y, Liu BF, Austin LL. Examining the Role of Social Media in Effective Crisis Management: The Effects of Crisis Origin, Information Form, and Source on Publics' Crisis Responses. Commun Res (2014) 41:74–94. doi:10.1177/0093650211423918
15. Lachlan KA, Spence PR, Lin X. Expressions of Risk Awareness and Concern through Twitter: On the Utility of Using the Medium as an Indication of Audience Needs. Comput Hum Behav (2014) 35:554–9. doi:10.1016/j.chb.2014.02.029
16. Veil SR, Buehner T, Palenchar MJ. A Work-In-Process Literature Review: Incorporating Social media in Risk and Crisis Communication. J contingencies crisis Manag (2011) 19:110–22. doi:10.1111/j.1468-5973.2011.00639.x
17. Lachlan KA, Spence PR, Lin X, Najarian K, Del Greco M. Social media and Crisis Management: Cerc, Search Strategies, and Twitter Content. Comput Hum Behav (2016) 54:647–52. doi:10.1016/j.chb.2015.05.027
18. Lv S, Huang L, Zang L, Zhou W, Han J, Hu S. Yet Another Approach to Understanding News Event Evolution. World Wide Web (2020) 23:2449–70. doi:10.1007/s11280-020-00818-7
19. Nichols J, Mahmud J, Drews C. Summarizing Sporting Events Using Twitter. In: Proceedings of the 2012 ACM international conference on Intelligent User Interfaces (2012). p. 189–98. doi:10.1145/2166966.2166999
20. Shen C, Liu F, Weng F, Li T. A Participant-Based Approach for Event Summarization Using Twitter Streams. In: Proceedings of the 2013 Conference of the North American Chapter of the Association for Computational Linguistics: Human Language Technologies (2013). p. 1152–62.
21. Srijith PK, Hepple M, Bontcheva K, Preotiuc-Pietro D. Sub-story Detection in Twitter with Hierarchical Dirichlet Processes. Inf Process Management (2017) 53:989–1003. doi:10.1016/j.ipm.2016.10.004
22. Huang L. Optimized Event Storyline Generation Based on Mixture-Event-Aspect Model. In: Proceedings of the 2013 Conference on Empirical Methods in Natural Language Processing (2013). p. 726–35.
23. Jin Z, Cao J, Jiang YG, Zhang Y. News Credibility Evaluation on Microblog with a Hierarchical Propagation Model. In: 2014 IEEE International Conference on Data Mining (IEEE) (2014). p. 230–9. doi:10.1109/icdm.2014.91
24. Kumar NP, Rao MV, Krishna PR, Bapi RS. Using Sub-sequence Information with Knn for Classification of Sequential Data. In: International Conference on Distributed Computing and Internet Technology (Springer) (2005). p. 536–46. doi:10.1007/11604655_60
25. Sreenivasulu M, Sridevi M. Comparative Study of Statistical Features to Detect the Target Event during Disaster. Big Data Min Anal (2020) 3:121–30. doi:10.26599/bdma.2019.9020021
26. Khurdiya A, Dey L, Mahajan D, Verma I. Extraction and Compilation of Events and Sub-events from Twitter. In: 2012 IEEE/WIC/ACM International Conferences on Web Intelligence and Intelligent Agent Technology (IEEE), 1 (2012). p. 504–8. doi:10.1109/wi-iat.2012.192
27. Piergiovanni A, Ryoo MS. Learning Latent Super-Events to Detect Multiple Activities in Videos. In: Proceedings of the IEEE Conference on Computer Vision and Pattern Recognition (2018). p. 5304–13. doi:10.1109/cvpr.2018.00556
28. Alam F, Joty SR, Imran M. Domain Adaptation with Adversarial Training and Graph Embeddings. In: Proceedings of the 56th Annual Meeting of the Association for Computational Linguistics (2018). 1077–1087. doi:10.18653/v1/P18-1099
29. Alam F, Joty S, Imran M. Graph Based Semi-supervised Learning with Convolution Neural Networks to Classify Crisis Related Tweets. In: Proceedings of the International AAAI Conference on Web and Social Media (2018).
30. Long R, Wang H, Chen Y, Jin O, Yu Y. Towards Effective Event Detection, Tracking and Summarization on Microblog Data. In: International conference on web-age information management (Springer) (2011). p. 652–63. doi:10.1007/978-3-642-23535-1_55
31. Li Z, Ding X, Liu T. Constructing Narrative Event Evolutionary Graph for Script Event Prediction. In: International Joint Conference on Artificial Intelligence (2018). p. 4201–4207. doi:10.24963/ijcai.2018/584
32. Pichotta K, Mooney R. Learning Statistical Scripts with Lstm Recurrent Neural Networks. In Proceedings of the AAAI Conference on Artificial Intelligence (2016).
33. Liu Y, Peng H, Guo J, He T, Li X, Song Y, et al. Event Detection and Evolution Based on Knowledge Base. In: Proceedings of the KBCOM 2018, WSDM (2018). p. 1–7. doi:10.475/123_4
34. Lv S, Qian W, Huang L, Han J, Hu S. Sam-net: Integrating Event-Level and Chain-Level Attentions to Predict what Happens Next. In: Proceedings of the AAAI Conference on Artificial Intelligence, 33 (2019). p. 6802–9. doi:10.1609/aaai.v33i01.33016802
35. Yuan C, Yuan C, Bai Y, Li Z. Logic Enhanced Commonsense Inference with Chain Transformer. In: Proceedings of the 29th ACM International Conference on Information & Knowledge Management (2020). p. 1763–72. doi:10.1145/3340531.3411895
36. Mao Q, Li X, Peng H, Li J, He D, Guo S, et al. Event Prediction Based on Evolutionary Event Ontology Knowledge. Future Generation Computer Syst (2021) 115:76–89. doi:10.1016/j.future.2020.07.041
37. Reuter C, Stieglitz S, Imran M. Social media in Conflicts and Crises. Behav Inf Technology (2020) 39:241–51. doi:10.1080/0144929x.2019.1629025
38. Chen X, Zhou X, Sellis T, Li X. Social Event Detection with Retweeting Behavior Correlation. Expert Syst Appl (2018) 114:516–23. doi:10.1016/j.eswa.2018.08.022
39. Li RD, Liu JG, Guo Q, Zhang YC. Social Signature Identification of Dynamical Social Networks. Physica A: Stat Mech its Appl (2018) 508:213–22. doi:10.1016/j.physa.2018.05.094
40. Liu JG, Hou L, Pan X, Guo Q, Zhou T. Stability of Similarity Measurements for Bipartite Networks. Sci Rep (2016) 6:18653–10. doi:10.1038/srep18653
41. Nolasco D, Oliveira J. Subevents Detection through Topic Modeling in Social media Posts. Future Generation Computer Syst (2019) 93:290–303. doi:10.1016/j.future.2018.09.008
42. Hu ZL, Han X, Ma L. Network Structure Transmission with Limited Data via Compressed Sensing. IEEE Trans Netw Sci Eng (2020) 7:3200–11. doi:10.1109/tnse.2020.3018134
43. Hu ZL, Wang L, Tang CB. Locating the Source Node of Diffusion Process in Cyber-Physical Networks via Minimum Observers. Chaos (2019) 29:063117. doi:10.1063/1.5092772
Keywords: sub-event mining, sub-event detection, sub-event correlation, sub-event summary, sub-event evolution, expert knowledge, social media
Citation: Li R-D, Guo Q, Zhang X-K and Liu J-G (2022) Reconstruction of Unfolding Sub-Events From Social Media Posts. Front. Phys. 10:918663. doi: 10.3389/fphy.2022.918663
Received: 12 April 2022; Accepted: 12 12 May 20222022;
Published: 24 June 2022.
Edited by:
Mahdi Jalili, RMIT University, AustraliaReviewed by:
Zhao-Long Hu, Zhejiang Normal University, ChinaCopyright © 2022 Li, Guo, Zhang and Liu. This is an open-access article distributed under the terms of the Creative Commons Attribution License (CC BY). The use, distribution or reproduction in other forums is permitted, provided the original author(s) and the copyright owner(s) are credited and that the original publication in this journal is cited, in accordance with accepted academic practice. No use, distribution or reproduction is permitted which does not comply with these terms.
*Correspondence: Jian-Guo Liu, bGl1amcwMDRAdXN0Yy5lZHUuY24=
Disclaimer: All claims expressed in this article are solely those of the authors and do not necessarily represent those of their affiliated organizations, or those of the publisher, the editors and the reviewers. Any product that may be evaluated in this article or claim that may be made by its manufacturer is not guaranteed or endorsed by the publisher.
Research integrity at Frontiers
Learn more about the work of our research integrity team to safeguard the quality of each article we publish.