 Weishan Hu
 Xiaowen Cui
 Ming Li1,2
 Fugui Yang
- 1Beijing Synchrotron Radiation Facility, Institute of High Energy Physics, Chinese Academy of Science, Beijing, China
- 2University of Chinese Academy of Sciences, Beijing, China
The influence of the X-ray mirror errors on the performance of the beamline increases as the X-ray beam’s coherence improves in advanced light sources. The spatial dispersion of the X-ray beam is crucial for spatial resolution and field of view. However, selecting the appropriate merit function for expressing light distribution and identifying its relationship to optical error is very important in beamline design. We develop a high-efficiency wave-optics simulation platform and a deterministic analysis model to address this issue. The simulation experiments evaluated merit functions, including Strehl ratio, root-mean-square spot size, and encircled energy radius. We proved that the encircled energy radius is a good metric of the x-ray beam spatial dispersion, which matches the results of the Church-Takacs theory. In addition, it is found that limiting the contribution of the low frequency
Introduction
X-rays emitted by advanced light sources, including free-electron lasers (FELs) and synchrotron radiation facilities, have advantages such as high flux and brightness. The fourth-generation synchrotron radiation source can achieve sub-micron spatial resolution. It can be used in many applications such as materials science, spectroscopy, chemistry, biology, etc. However, due to the high coherence of X-rays, various optical devices and equipment of beamlines will cause wavefront errors, which will reduce the system’s spatial resolution or the peak intensity of beams. Therefore, these advantages of synchrotron radiation make high demands on optics quality for beamline transmission. For example, the surface shape accuracy of the High Energy Photon Source (HEPS)[1] for the X-ray nano-focusing mirror is required up to 2 nm peak-to-value (PV) or 0.5 nm root-mean-square (RMS), and the slope error is required to be better than 50 μrad RMS.
The influence of X-ray mirror shape errors have always been an essential issue in synchrotron radiation facilities. X-ray optical elements’ specifications have been studied over the past few years. Church and Takacs [2] performed a systematic analysis of the errors of optical focusing elements as early as 1993, and they used the error statistics of the focusing elements to predict the imaging degradation of simple imaging systems. Church’s article presents a model of errors and proposes two types of error, including the figure error left by the molding process during manufacturing and the finish error left by the finishing and polishing process. At the same time, R. Signorato and M. Sanchez del Rio[3] researched X-ray mirrors based on geometric ray tracing. They proposed that the power spectral density (PSD) does not contain all the information about the intensity and position of the light spot. On this basis, Pardini[4] finds that for diffraction-limited systems, within a critical spatial wavelength, the optical focusing element can appropriately relax the slope error requirements and still maintain a good light intensity distribution. Yashchuk[5] studied the effect of the specular error on the quality of the X-ray beam delivered to the sample location at different spatial frequencies. It shows that for a surface irregularity comparable to the mirror length, a significantly reduced photon flux density results in reduced beam quality. On the basis of the theoretical model, the power spectral density function[6–8], surface finish function[9,10] can be used to express the specific requirements of X-ray optical components.
According to the requirements for the manufacturing parameters of optical elements, adequate progress has also been made in manufacturing high-precision optical elements. Many researchers[11,12] have investigated high-precision optical components suitable for X-rays. But inevitably, high-precision optical components are expensive and difficult for manufacture. Also, not all experiments require highly coherent or diffraction-limited light, which means imperfect mirrors can suffice for application. For example, most conventional beamline experiments, including the experiment of small-angle scattering and absorption, only requires regular quality light spots. Westfahl [13] found that in the partially coherent beams of fourth-generation synchrotron radiation sources, use of mirrors with smaller errors caused wavefront distortions, but their coherence lengths were virtually unchanged. Moreover, in Church’s article[2], it is also theoretically demonstrated that the imaging properties of surfaces with fractal errors perform well even if the fractal power spectrum diverges at low spatial frequencies.
In addition, how to implement the construction of such beamlines with low risk and low cost makes it necessary to carry out error evaluation of X-ray optical components for applications. With the improvement of the coherence of the light source, the application of wave optics is increasing, with the problems caused by the wave characteristics of light becoming the key to beamlines and experiments. The beamline simulation platform is important to study these problems. High-level beamline design requires a simulation platform that fully combines wave optics with traditional geometric optics tracing methods. The Ray tracing method can quickly evaluate the beamline’s energy spectrum, the optics layout device’s position, etc. Moreover, the existing simulation softwares are relatively mature, such as SRW, SHADOW, XRT[14,15]. Wave optics can more accurately evaluate the changes in coherence and wavefront errors caused by various device errors and vibrations. How to quickly carry out the wave simulation of optical problems is still difficult for many researchers. To slove the problem, we will introduce our simulation strategy.
As different applications have different requirements on the image quality, Figure 1 shows the HEPS strategy on the error solution in order to give the over-/under- specification of the optics. In this paper, we studied the focusing partially coherent light and give a simplified model of the beamline system. Based on the DABAM numerical simulation, we focus on the study of the energy spatial dispersion characterization of the focused beam, and giving the general requirements for the mirror quality of the beamlines.

FIGURE 1. Issues related to the optics error problem.
Simulation methods
In order to give an explicit explanation, this paper focuses on the wavefront distortion and features of the beam spot on sample in a simplified optical system. The optical system is shown in the Figure 2, where the phase modulation function t (x, y) = A (x, y)eiϕ(x,y) is used to model the X-ray optics. The simplified system setup is beneficial for improving the simulation speed and performing theoretical calculations. Numerical simulation tools have been adopted to study the issues related to the X-ray optics imperfection. It has been proved that the insert device or bending magnet can be simulated with very high precision. Optimizing the source mainly depends on the energy spectrum requirement and has little relationship with the beamline issue we are concerned about in this paper. We will perform the simulation for the specified source.
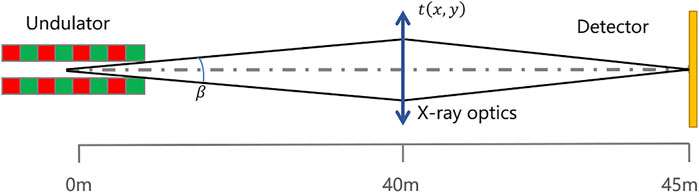
FIGURE 2. Scheme of the beamline system with focusing optics.
In partially coherent light sources, the wave-optics calculation of beamline simulation software is very time-consuming, which also limits its applications in the study of beamline design engineering techniques. The physical basis of the simulation is to modulate the wavefront of the light source into the detected and received data through Fresnel diffraction and to perform calculation and analysis. It can be divided into four parts: model and calculation of the light source of the insert, model of optical components, optical wave-optics propagation, and data analysis. Among them, the first and third steps are the most time-consuming processes. Figure 3 shows our strategy for the simulation platform development. In order to improve the calculation efficiency, we integrated the mature software package (XRT/SRW) and adopted the following calculation strategies:
1) Optimizing light source and beamline set up separately. The source field by multiple electrons is calculated and saved to the local hard disk to avoid the repeated SR source calculations, which are time-consuming. In the beamline design stage, the data is loaded and used to perform beamline simulation. Replacing numerical calculations with local data access also reduces the requirement on the large memory.
2) Optical wave propagation. Bluestein algorithm[16,17] is used to accelerate the Fresnel diffraction calculation. It can avoid the sampling issue in the traditional fast Fourier transform process.
3) MPI-based[18] parallel calculation for multiple electron loop. It has been successfully adopted in SRW.
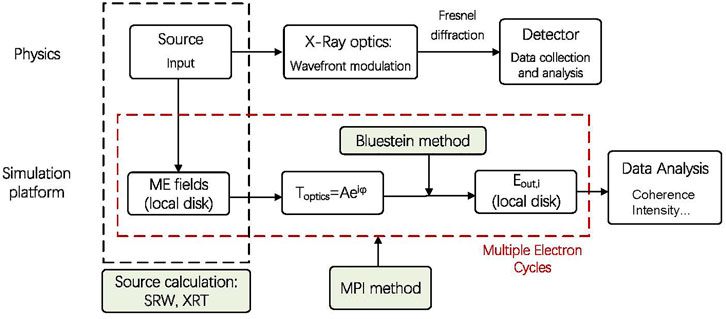
FIGURE 3. Roadmap of the calculation platform for partial coherence system simulation.
Through these three optimization, this project’s calculation time is significantly reduced. In modeling the optical element, the optical element error directly converts into wavefront error. Figure 4 shows the comparison of the SRW and our method in multi-electron simulation. The parameters of the undulator and X-ray light source are given by Table1, 2. In the debug process, the beamline parameters optimization (including sampling range, resolution, etc.) is suggested to be first carried out for single-electron calculation. After the debugging is completed, the multi-electron calculation is finally carried out.
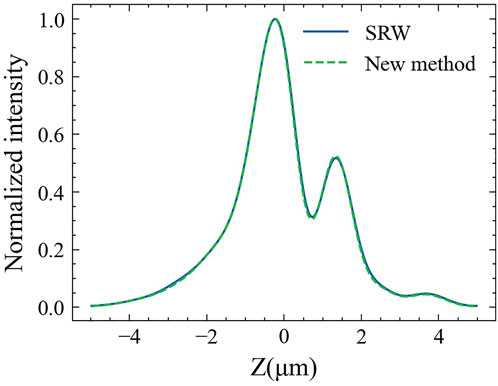
FIGURE 4. Comparison chart of SRW and new method.
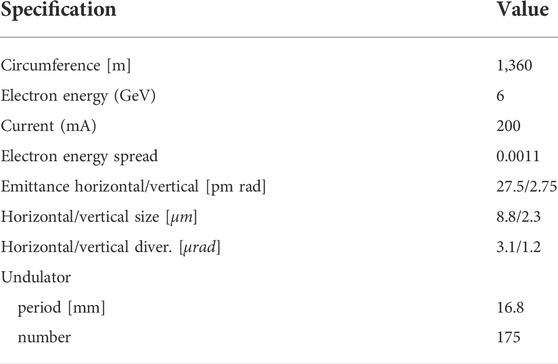
TABLE 1. Parameters for the Storage and undulator.
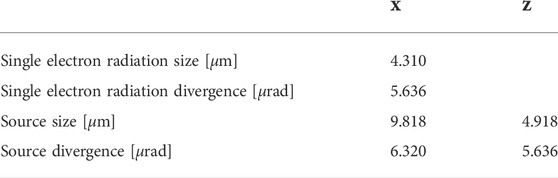
TABLE 2. Parameters of X-ray light source at 10 keV for low beta beamline.
Surface error analysis
Characterization of the surface error
Reasonable specification on the x-ray mirror quality should consider the features of the error data for real mirrors. In Church & Takacs [19] article, the specification of mirrors is studied based on their performance in the optical system. The Strehl Ratio (SR) and the power spectral density (PSD) of the mirror’s surface error, is selected as a merit function of image quality. Because the PSD curve changes significantly with different mirrors, the RMS slope error, RMS height error, and PV height error are commonly used to specify the optics. The surface error statistical data (1D) is obtained from the DABAM database. By subtracting the original shape of mirrors, we extracted residual height and slope error.
As shown in the Figure 5, the raw data of height error (Figure 5A), slope error (Figure 5B) and the PSD (Figure 5C) of mirror M2 from DABAM database is displayed as an example with the coordinates of Figure 5C expressed in logarithmic form.
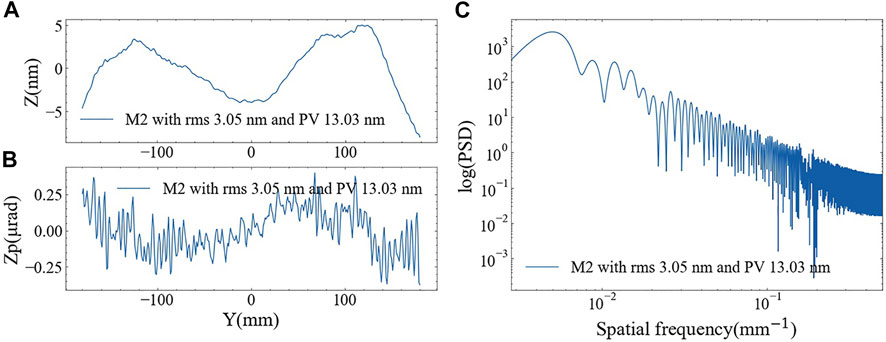
FIGURE 5. (A) The height error of mirror M2 in the DABAM database. (B) The slope error of mirror M2 in the DABAM database. (C) The PSD of the mirror in the DABAM database.
Where there are equal interval df between sampling frequencies during the frequency range
Figure 6 shows the
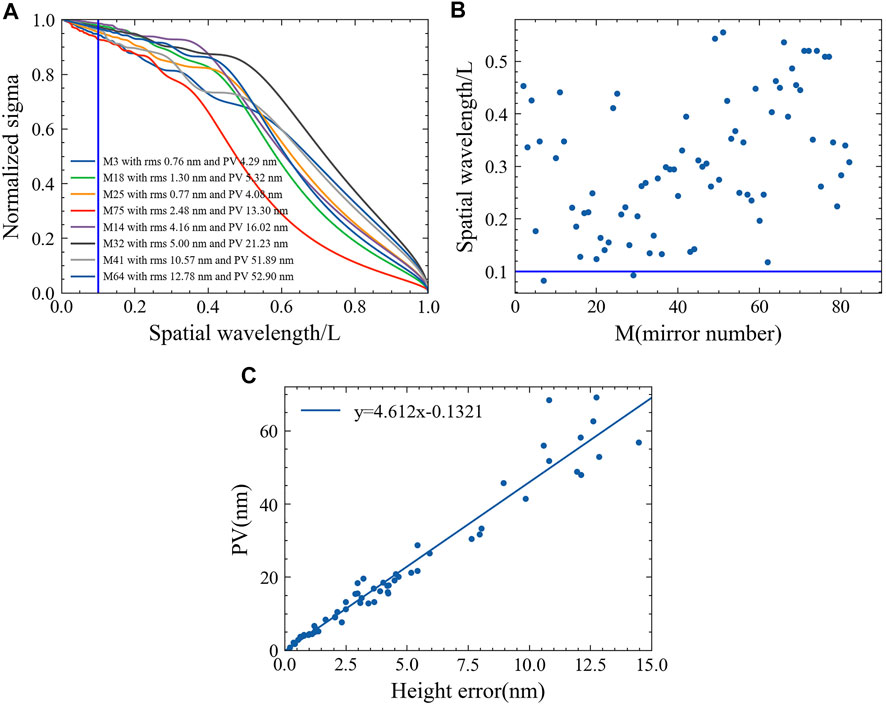
FIGURE 6. (A) The relationshape between σNormalized with the spatial wavelength (/L).(B) the spatial wavelength (/L) of error for existing mirrors in DABAM when the σNormalized reach 0.8.(C) the relationshape between PV with RMS of height error.
Deterministic analysis on the beamline performance
From the point of view of integration calculation, it is challenging to perform an analytical analysis of the low-frequency error. However, the physical rules behind the appearance are more important for practical beamline design work than simulation. In Section 2.2, it can be seen that the low-frequency error is the main component of the machining error. In order to study the influence of the spatial distribution characteristics of the surface shape error on the optical system performance, considering the statistical dilemma, here we develop the deterministic analysis method. In the case of a coherent light field, the entire aperture function t (x1) is divided into many segments, and the transmittance function in each segment can be expressed as
Where wi and ci are segment width and center position.
Where x0 and y0 are the coordinates of the focal plane, x1 and y1 are the coordinates of aperture, k is the wave number, z is the distance to the focal plane,
According to the Formulas 4 and 5, the final light field distribution can be divided into three contributions: [a]. Single slit diffraction factor wisinc(wifx). Slit width determines peak intensity and distribution width. [b]. Positional parameters exp ( − 2πfxci) is the phase factor due to distance between slits. [c]. Diffraction modulation within each single hole
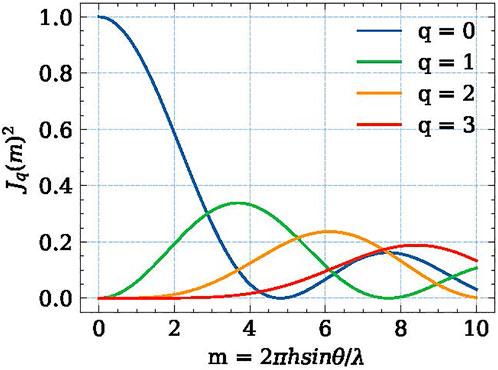
FIGURE 7. Contributions of different diffraction order versus the magnitude of the surface shape error under the cosine shape error model.
To demonstrate the effectiveness of this approach, Figure 8 presents the results of the piecewise approximation of the shape error under parallel light illumination for Mirror-34 from the DABAM database. It is shown that the piecewise approximation can generate the profile of the light field similar to the result by the nature error. It also verifies that the low-frequency error contributes to the structure in the focal spot. The structure feature can be well analyzed by a deterministic method using the segmented model with simple functions.
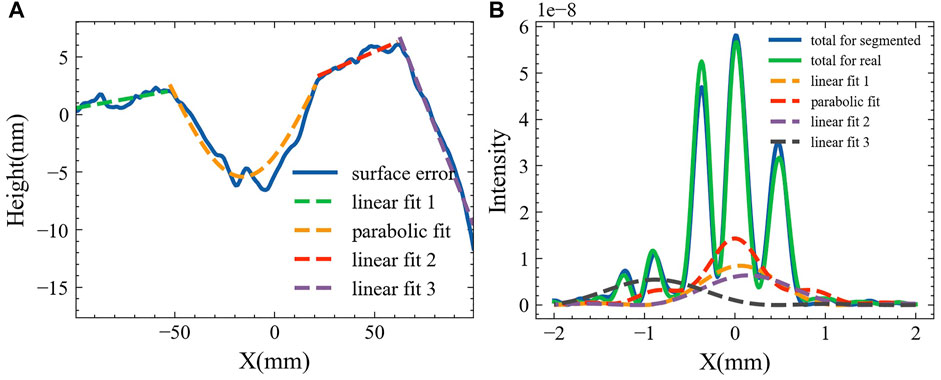
FIGURE 8. Verification of multi-segment decomposition approximation. (A) is shape fit of segmented surface error. (B) gives focused spot profile by different components and their interference.
On the other hand, quantitatively, the simplest single-bump case can be considered to analyze the impact of low-frequency errors. The bump is set in the middle of the section. The width of the bump is w0, the center position c0, and the width of the entire aperture of the amplitude PV is w.
In the case of complete coherence, the distribution of the light spot on the focal plane is shown in the Figure 9 when considering the effect of position, width, height, and shape. The bump’s position will cause the symmetry of the light field distribution, and the width will cause the intensity distribution of the interference fringes. The smaller the width of the bump, the smaller the error contribution of this part. As the height of the bump changes, multiple cycles of wavefront oscillations are formed in the bump, which also causes structural changes. Although the cosine distribution model is used in the above calculation, it does not affect the conclusion of the light field distribution structure compared with the calculation results of the parabolic and flat-topped model.
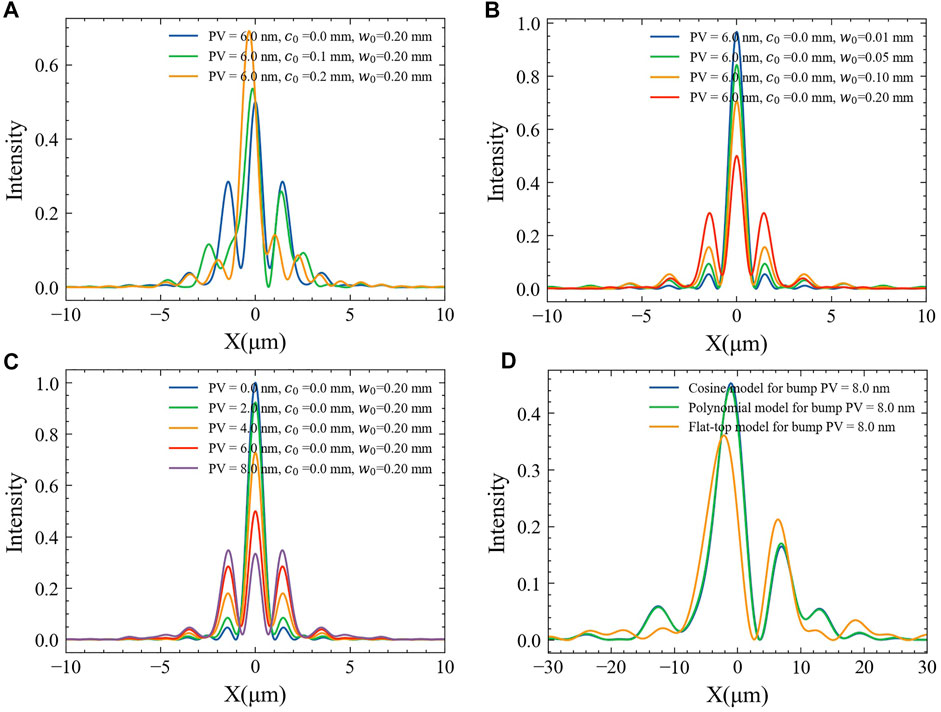
FIGURE 9. Bump model of simulation considering the effect of position (A), width (B), height(C), and shape(D).
Merit function selection
In this section, we perform error experiments in a low-beta beamline of the HEPS light source. The parameters of the HEPS storage ring and the insert device are shown in Table 1, and the corresponding light source parameters are shown in Table 2. The Figure 10 uses the beamline tracing and mode decomposition modules to calculate the coherence and the angular distribution of the light field in different angular ranges. The source can provide X-ray with perfect coherence in the vertical direction, and the coherence ratio in the horizontal direction is less than 20%. The focusing characteristics in these two directions can reflect the relationship between the degree of coherence and error characteristics. At the same time, considering the efficiency of the optical field flux, the acceptance angle range to be studied in this paper is 10 μrad in the vertical direction and 18 μrad in the horizontal direction.
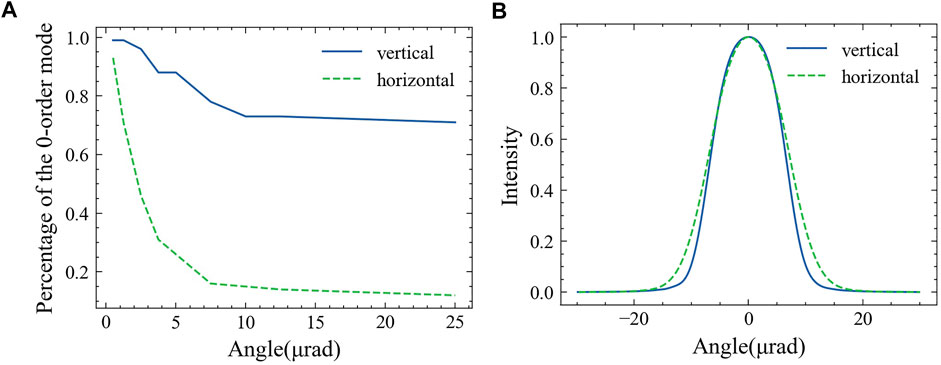
FIGURE 10. Coherence(A) and intensity(B) distribution of light field by the undulator source. Coherence is measured by the percentage of the 0-order mode.
Strehl ratio
SR is the illuminance ratio at the center of the system’s Airy disk to the comparable value in an ideal imaging system. It is widely used as a standard function for diffraction limited systems. SR shows the degree of energy dispersion, the effect of diffraction and aberrations on the Airy disk. When SR is above 0.8, it is usually dependable in most optical system. The closer SR approaches to 1, the better the imaging quality are.
The relationship between the RMS optical path difference Wrms and SR is
Where h is height of mirror. The aberration is relatively modest for SR
The surface error in the DABAM library is added on the horizontal and vertical directions in our simulation process, respectively. In the numerical experiment, the residual shape error is added on the vertical direction for the beamline acceptance angle β = 10 μrad and on the horizontal direction for β = 18 μrad, which corresponds to the different coherence of the light field. Figure 11 is the SR of simulation in which we calculate the theoretical value of SR and the RMS height error using the Formula 7. SR scatter plots for 10μrad and 18 μrad receive angles in response to height error are shown in Figure 11A,B. When 1) and 2) are compared, it is clear that the 10 μrad results differ from the 18 μrad results. The 10 μrad results are more associated in theory than 18 μrad results. This demonstrates that, in good coherence, especially more than 0.8, the theoretical value of SR related to the height error can be utilized as a mirror selection criterion. We also noticed that the correlation between the theoretical and actual values reduces when the SR drops. Figure 11C,D give scatter plots of slope error versus SR value, which do not show a clear correlation between them. The above results show that the SR value can describe the dispersion degree of the light field only in the system close to the diffraction limit. SR is closely related to the height error.
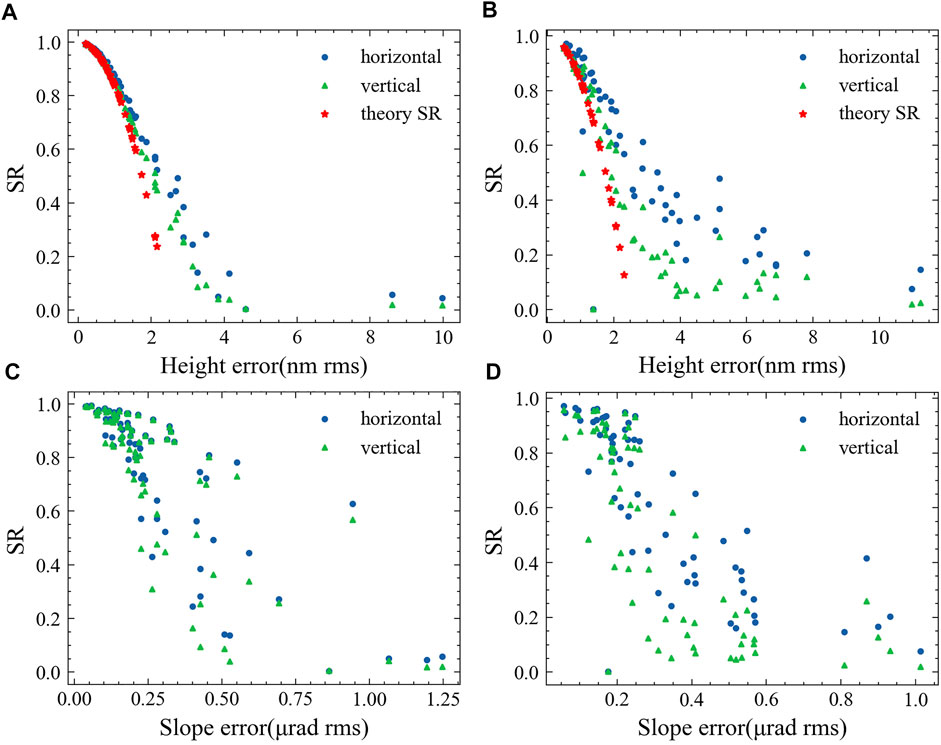
FIGURE 11. SR for Optical Simulation. (A) is the height error - SR scatter plot for 10 μrad acceptance angle, (B) is the height error - SR scatter plot for 18 μrad acceptance angle, (C) is the slope error - SR scatter plot for 10 μrad acceptance angle, (D) is the slope error - SR scatter plot for 18 μrad acceptance angle.
Root-mean-square spot size
The extension of the spot is another measure of the energy or flux spread caused by the error. It should consider three contributions, including diffraction, geometric magnification, and the surface error given by
where
For single slit diffraction, the distribution of the light field is
The value of the integral spot size fluctuates with the range of the light field using this connection. We get
Then, we calculate the light SR field diffracted by the single slit, where the selected acceptance angle is 10 μrad. In the Figure 12, the first integral width sigma value is 0.538μm, the minimum position is 1.593μm, and the ratio is 0.538/1.593 = 0.33. It is consistent with the theoretical slit diffraction width characteristics. However, the integrated sigma value will increase significantly with the increase of the integration range. For example, the sigma value in this calculation is 1.8 μm over ± 30 μm. In practical applications, the experiment will configure a slit to block weak light from a large angle while only maintaining intense light in the central lobe, which already holds 90% of the light field energy and ensures a higher system spatial resolution at the same time. Unlike a Gaussian distribution, the spot’s standard deviation size cannot accurately reflect the spot’s energy dispersion in advanced light sources. As a result, we suggest that it is unsuitable for use as a light field standard.
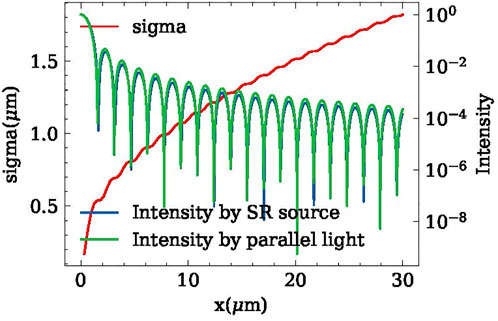
FIGURE 12. RMS spot size calculation for single slit diffraction.
Encircled energy radius
Encircled energy is another metric for specifying the performance of traditional optical systems, which is defined as the flux in a circle as a function of radius. However, it has not yet been studied and used in the SR beamline design. In this section, we will demonstrate that this metric is good for the spatial dispersion of the light field considering different coherence. The encircled energy distribution is calculated by integrating intensity from the center. When no specular error is loaded, the flux obtained by taking the FWHM of the intensity curve of focal plane as the encircling radius which is 70.6% for vertical direction and 72.2% for horizontal direction. And the ratio of the flux at the FWHM of the standard Gaussian distribution is 76%. Therefore, we calculated 76% flux of encircling energy radius.
In Figure 13, 76% encircled energy radius of the focus spot is plotted verse different surface error parameters with a linear regression fit performed. Figure 13B shows a more significant Pearson correlation coefficient and a smaller p-value for the hypothesis test compared to Figure 13A, indicating that the coordinate value of 18 μrad with 76% light intensity is more correlated with the slope error. Similarly, compared to Figure 13D, Figure 13C has a more significant Pearson correlation coefficient and a smaller p-value for the hypothesis test, indicating that the coordinate value of 10 μrad containing 76% of the light intensity is more correlated with the height error. This finding is similar to the result by Church & Takacs [19] that the performance is related to the height error for the coherent system while to the slope error for the low-coherence system. In addition, the PV and RMS height errors have shown no significant difference in the encircled energy radius in both cases, suggesting that both can be used to specify the mirror quality.
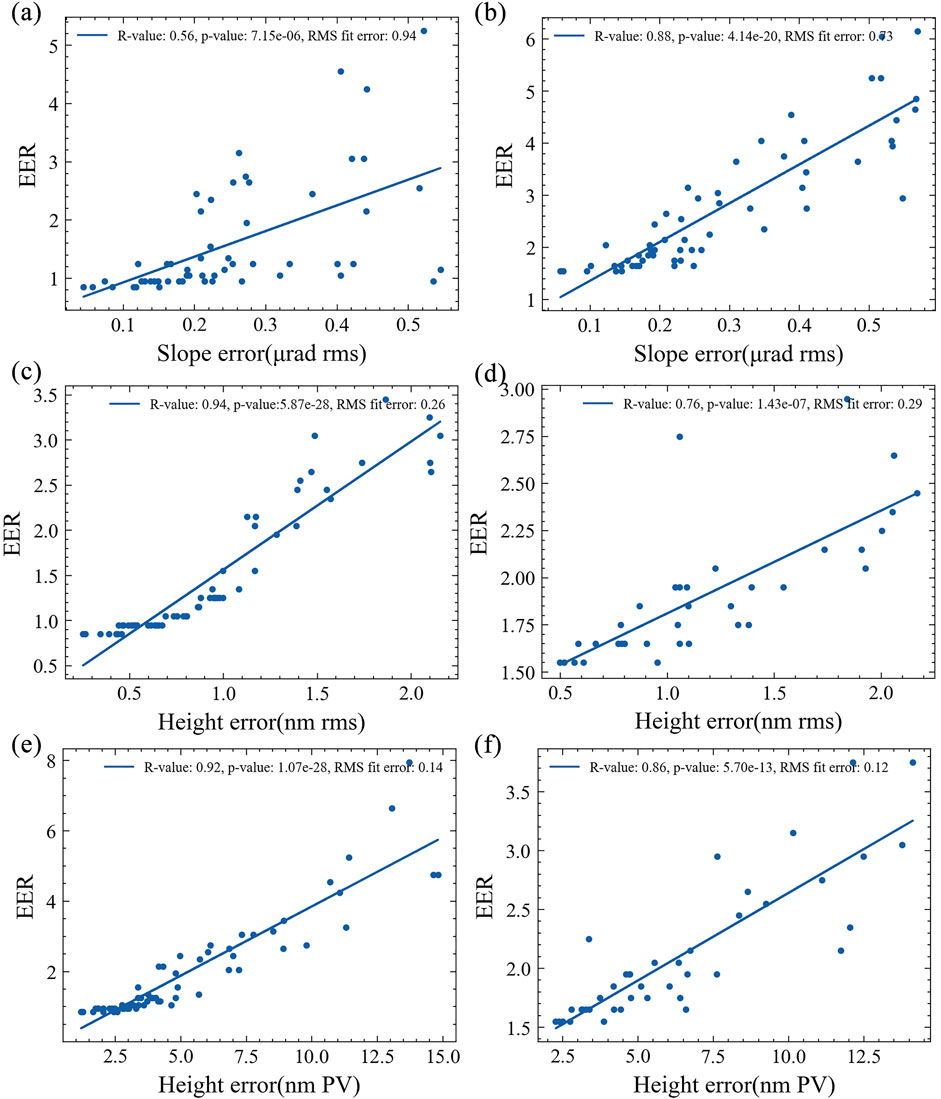
FIGURE 13. Encircled energy spot radius by values of RMS slope error(A,B), RMS height error(C,D) and PV height error(E,F). The left and right columns correspond to 10 μrad acceptance angle in vertical direction and 18 μrad acceptance angle in horizontal direction, respectively. The criterion for the encircled energy spot radius width is 70%.
Conclusions
The influence of X-ray mirror error on beamline system performance is studied in this paper. We employ a simplified model and an accelerated simulation platform with improved computational efficiency for error analysis. It is investigated through the analysis of error characteristics and the simulation of beamline performance in order to identify more effective specification methods for various applications. As a result, we arrive at the following conclusion:
1) While the statistics of individual mirrors are highly debatable, the RMS and PV height error can be used together to constrain mirror errors. Low-frequency component with a period greater than 1/10 L is the major contributor to the fabrication error.
2) It is required to reduce the residual surface error to get an unstructured light spot. We discovered that a low-frequency mistake of more than 1/10 L period impacts system performance through the deterministic analysis and bump simulation.
3) The encircled energy spot size is a good measure for spatial energy dispersion for partial coherence application.
Through the calculation and analysis in this paper, it is helpful to determine the parameter requirements of low-risk optical components. On the other hand, the calculation method in this paper can also be used to study other problems, such as vibration, coherence control, and others, which require many wave calculations. In addition, some adaptive X-ray mirrors have been reported to control and correct low-frequency defects[20,21], and we hope to investigate such mirrors in the future.
Data availability statement
The raw data supporting the conclusions of this article will be made available by the authors, without undue reservation.
Author contributions
WS: taking part in the improvement on the paper work. QJ: calculation and discussion on the error feature. WZ: added frames and contents.
Funding
Youth Innovation Promotion Association of the Chinese Academy of Sciences (2019012); National Natural Science Foundation of China (11875059).
Conflict of interest
The authors declare that the research was conducted in the absence of any commercial or financial relationships that could be construed as a potential conflict of interest.
Publisher’s note
All claims expressed in this article are solely those of the authors and do not necessarily represent those of their affiliated organizations, or those of the publisher, the editors and the reviewers. Any product that may be evaluated in this article, or claim that may be made by its manufacturer, is not guaranteed or endorsed by the publisher.
References
1. Jiao Y, Xu G, Cui X-H, Duan Z, Guo Y-Y, He P, et al. The heps project. J Synchrotron Radiat (2018) 25:1611–8. doi:10.1107/s1600577518012110
2. Church EL, Takacs PZ. Specification of surface figure and finish in terms of system performance. Appl Opt (1993) 32:3344–53. doi:10.1364/ao.32.003344
3. Signorato R, del Rio MS. Structured slope errors on real x-ray mirrors: Ray tracing versus experiment. In: Materials, manufacturing, and measurement for synchrotron radiation mirrors, 3152. Washington, United States: International Society for Optics and Photonics (1997). p. 136–47.
4. Pardini T, Cocco D, Hau-Riege SP. Effect of slope errors on the performance of mirrors for x-ray free electron laser applications. Opt Express (2015) 23:31889–95. doi:10.1364/oe.23.031889
5. Yashchuk VV, Samoylova L, Kozhevnikov IV. Specification of x-ray mirrors in terms of system performance: A new twist to an old plot. In: Advances in computational methods for X-ray optics III, 9209. Washington, United States: SPIE (2014). p. 114–32.
6. Shi X, Assoufid L, Reininger R. How to specify super-smooth mirrors: Simulation studies on nano-focusing and wavefront preserving x-ray mirrors for next-generation light sources. In. 8th International Symposium on Advanced Optical Manufacturing and Testing Technologies: Subnanometer Accuracy Measurement for Synchrotron Optics and X-Ray Optics, 25 October, 2016, Suzhou, China, 9687. SPIE (2016). 9–19.
7. Church EL, Takacs PZ. Optimal estimation of finish parametersOpt Scatter: Appl Meas Theor, 1530. Washington, United States: International Society for Optics and Photonics (1991). p. 71–85.
8. Yashchuk YV, Yashchuk VV. Reliable before-fabrication forecasting of expected surface slope distributions for x-ray optics. Opt Eng (2012) 51:046501. doi:10.1117/1.oe.51.4.046501
10. Church EL, Takacs PZ. Instrumental effects in surface finish measurement. In: Surface measurement and characterization, 1009. Washington, United States: International Society for Optics and Photonics (1989). p. 46–55.
11. Krywka C, Last A, Marschall F, Márkus O, Georgi S, Müller M, et al. Polymer compound refractive lenses for hard x-ray nanofocusing. In: AIP Conference Proceedings, 30 August, 2016, Upton, NY, USA, 1764. AIP Publishing LLC (2016). p. 020001.
12. Mimura H, Takei Y, Kume T, Takeo Y, Motoyama H, Egawa S, et al. Fabrication of a precise ellipsoidal mirror for soft x-ray nanofocusing. Rev Scientific Instr (2018) 89:093104. doi:10.1063/1.5035323
13. Westfahl H, Lordano Luiz SA, Meyer BC, Meneau F. The coherent radiation fraction of low-emittance synchrotrons. J Synchrotron Radiat (2017) 24:566–75. doi:10.1107/s1600577517003058
14. Klementiev K, Chernikov R. Powerful scriptable ray tracing package xrt. In: Advances in computational methods for X-ray optics III, 9209. Washington, United States: SPIE (2014). p. 60–75.
15. Chubar O, Elleaume P. Accurate and efficient computation of synchrotron radiation in the near field region. In: proc. of the EPAC98 Conference; 22-26 June 1998; Stockholm, Sweden, 1177 (1998).
16. Bluestein L. A linear filtering approach to the computation of discrete fourier transform. IEEE Trans Audio Electroacoust (1970) 18:451–5. doi:10.1109/tau.1970.1162132
17. Hu Y, Wang Z, Wang X, Ji S, Zhang C, Li J, et al. Efficient full-path optical calculation of scalar and vector diffraction using the bluestein method. Light Sci Appl (2020) 9:119–1. doi:10.1038/s41377-020-00362-z
18. Dalcin L, Fang Y-LL. Mpi4py: Status update after 12 years of development. Comput Sci Eng (2021) 23:47–54. doi:10.1109/mcse.2021.3083216
19. Church EL, Takacs PZ. Specification of glancing-and normal-incidence x-ray mirrors [also erratum 34 (11) 3348 (nov1995)]. Opt Eng (1995) 34:353–60. doi:10.1117/12.196057
20. Signorato R, Hignette O, Goulon J. Multi-segmented piezoelectric mirrors as active/adaptive optics components. J Synchrotron Radiat (1998) 5:797–800. doi:10.1107/s0909049597012843
Keywords: X-ray mirror, beamline design, simulation, surface error, synchrotron radiation facility
Citation: Hu W, Cui X, Li M, Sheng W, Zhang W, Jia Q and Yang F (2022) Study on the X-ray mirror quality specification in advanced light source. Front. Phys. 10:915182. doi: 10.3389/fphy.2022.915182
Received: 07 April 2022; Accepted: 04 August 2022;
Published: 28 September 2022.
Edited by:
Qiushi Huang, Tongji University, ChinaReviewed by:
Riccardo Signorato, S.RI. Tech s.r.l., ItalySimon Alcock, Diamond Light Source, United Kingdom
Yong Wang, Shanghai Advanced Research Institute (CAS), China
Maurizio Vannoni, European X-Ray Free Electron Laser, Germany
Copyright © 2022 Hu, Cui, Li, Sheng, Zhang, Jia and Yang. This is an open-access article distributed under the terms of the Creative Commons Attribution License (CC BY). The use, distribution or reproduction in other forums is permitted, provided the original author(s) and the copyright owner(s) are credited and that the original publication in this journal is cited, in accordance with accepted academic practice. No use, distribution or reproduction is permitted which does not comply with these terms.
*Correspondence: Fugui Yang, eWFuZ2ZnQGloZXAuYWMuY24=