 Robin Mentheour
- Division of Environmental Physics, Faculty of Mathematics, Physics and Informatics, Comenius University, Bratislava, Slovakia
In the biomedical applications of cold plasma, the dominant biological effect is most typically attributed to the reactive oxygen and nitrogen species (RONS), while the physical effect of electric fields is sometimes overlooked. Here, we investigated the antibacterial effect of RONS in plasma-activated water (PAW) on the inactivation of E. coli bacteria, coupled with a mild 200-nanosecond pulsed electric field (PEF) treatment. By using transient spark discharge plasma in open atmospheric air and closed air reactors, and by adding hydrogen peroxide (H2O2) into the PAW, different chemical compositions of RONS were obtained. We measured the time evolution of the concentrations of key species in the PAW post-discharge:
1 Introduction
Pulsed electric fields (PEF) and cold atmospheric plasma biological treatments bring new applications, such as antibacterial sterilization, cancer therapy, improved wound healing, activation of seed germination and plant growth stimulation in agriculture, disinfection and improvement of food quality and shelf-life extension of food products, and water decontamination [1, 2]. PEF and cold plasma have some common mechanisms of action: electropermeabilization and electroporation of cell membranes due to the electric field [3–5] and induced production of intracellular reactive oxygen species (ROS) [6]. Together with pH decrease in water solutions, these effects play important roles in these emerging applications.
The plasma sources used for biological applications are represented by a multitude of atmospheric cold plasmas, among which streamer corona, dielectric barrier discharge (DBD) [1], helium and argon plasma jets [7], glow discharge, guiding arc [8, 9], and transient spark [10, 11] are well described to induce antibacterial effects. They were also demonstrated to be efficient in other applications, such as cancer therapy [7, 12–14], gene transfer [15], plant growth simulation [16], food industry [17], and wound healing [18, 19]. The mechanisms and the importance of individual effects of plasma agents, and their synergies are not completely understood and are being subjected to intense investigations [13]. They depend on plasma source type, geometry, power delivered, gas molecular composition and humidity [20], ambient pressure and temperature, and target type [7].
The main plasma agents responsible of antibacterial properties are UV radiation, electric field, and especially reactive oxygen and nitrogen species (RONS). The UV radiation (UVA–UVB) generated by plasma is usually not energetic enough to directly inactivate bacteria [21], but it is able to generate RONS in air, which are known for their antibacterial activity or can synergize with plasma-generated RONS [22].
RONS are mainly generated by the reactions of free electrons of the plasma or are the by-products of reactions between radicals and other RONS. RONS generated by plasma are usually classified in two categories. First, species with short lifetime (∼ns–µs–ms), for example, superoxide ion, such as
The presence of water in air plasma can significantly influence the plasma-induced gas-phase chemistry. Highly reactive hydroxyl (•OH) radical can be produced by several reactions, for example, by Eqs. 1, 2.
The •OH radicals recombine resulting in further reactive oxygen species (ROS), such as H2O2 (Eq. 3) and •HO2. [24, 26].
The NO and
Water (either deionized or in various water solutions) treated by plasma, so-called plasma-activated water (PAW), receives RONS from the plasma and retains their biophysical activity, such as antibacterial effects, which makes PAW transportable and applicable even after the plasma treatment [8, 9, 12, 23, 24, 28, 29].
The dissolution of species from the gas phase into the liquid phase is driven in the first approximation by Henry’s law. The Henry’s law solubility coefficient of H2O2 (kH≈103 mol m−3 Pa−1) is about 7–8 orders of magnitude larger than that of NO (≈2 × 10⁻⁵ mol m−3 Pa−1) or
The main long-lifetime species measured in PAW are nitrites (
In contrast to NOx, H2O2 is much more soluble in water than NOx, due to its high Henry’s law coefficient. Thus, most of gaseous H2O2 is immediately absorbed by the liquid. The measured H2O2 in the liquid phase comes dominantly from this dissolution from the air plasma through the plasma–liquid interface, as studied by references [20, 32] and [33]. H2O2 is typically one of the main components of PAW and plays a key role in radical production and in the antibacterial effect. A combination of PAW and H2O2 was tested on S. aureus and led to a significant antibacterial effect in comparison with their individual effects [34].
H2O2 reacts with
The kinetic rate constant of the reaction (Eq. 8) is k=1.1 × 10⁻³ M−2 s−1 at pH 3.3 [28]. Peroxynitrous acid, ONOOH, is considered as a key factor in antibacterial effect of PAW in acidic conditions [10, 24]. Its antibacterial effect was attributed to the degradation products of peroxynitrous acid, which to 30% generates radicals •NO2 and •OH and the other 70% is converted to nitrate
Direct plasma biomedical effects are typically stronger than indirect (remote) effects of PAW. Reactive species with a short lifetime are the best candidates to explain this difference, but the difficulty in quantifying and producing these species makes it complicated to evaluate their roles in the antibacterial effect [21].
The presence of an electric field is another obvious difference between direct plasma and the PAW treatments. Focusing on the effects of the electric field and their synergy with RONS can help us to advance the understanding of plasma treatments in a broader perspective. Studies of E-field measurements in plasma jets [35–37] applied for plasma medical applications demonstrated that an E-field is an important agent in plasma-induced biological effects. This is the key motivation of this study to study the separate and the combined effects of RONS in PAW and the pulsed electric field.
The PEF application typically leads to permeabilization of the cell membrane, which may be reversible. Increased pulse length, pulse amplitude, and numbers of pulses lead to irreversible electroporation, that is, cell death. The application of electrical pulses sufficient to produce a transient, elevated transmembrane potential of typically 200 mV–1 V is required for the formation of pores, which perforate the membrane and are filled by water molecules (the so-called aqueous or hydrophilic pores). This transmembrane potential charges the membrane due to the ion flow and leads to a rapid, localized rearrangement of the molecular structure of the membrane. In some circumstances, when the external electric field is removed, the membrane recovers [38].
The RONS coming from the plasma can be responsible for membrane phospholipid peroxidation. Especially, •OH radicals oxidize unsaturated bonds of membrane lipids by fragmentation to truncated-chain lipids and fatty aldehydes. This lipid peroxidation facilitates electropermeabilization and electroporation by reducing the membrane thickness, increasing its fluidity, and facilitating the electroporation by a low E-field [39], leading to a drop in the average time needed to initiate electroporation [40] and a lower threshold electric field needed for pore formation [40–44]. In certain cases, lipid peroxidation can produce the formation of pores on the order of 10 nm–1 µm in size [39, 43].
The interactions between PAW and PEF were investigated by several studies, for example, on bacteria [45] and cancer cells [12, 46–48], and gave promising results by improving the effectiveness of each individual method. The study mentioned in reference [49] has shown that corona discharge plasma for the same energy was more efficient than PEF for an antibacterial effect. The permeabilization of the cells induced by the electric pulses facilitated the antibacterial or anticancer effect of the RONS by penetration into the cancer cells [50]. In addition, the effect of pH could affect the resistance of bacteria to the PEF. Gram-positive bacteria are more resistant at pH=7 and weaker at pH=4, while Gram-negative ones are more resistant at pH=4 and weaker at pH=7 [51].
In this study, we exposed E. coli in the planktonic form to two different types of PAW, generated by the transient spark discharge with a water electrospray (TS-ES) in open air and transient spark batch water treatment (TS-B) generated in a closed air reactor. TS-ES has been investigated in detail in the precedent works of our group [10, 11, 24], showing strong antibacterial effects for both direct and indirect (PAW) treatment and associated these effects with the gas and liquid phase plasma-induced chemistry. The antibacterial action of TS-B compared with TS-ES and other air discharges treating batch water against uropathogenic infections were studied recently by the study mentioned in reference [52]. In this study, the RONS composition of these two types of PAW were analyzed directly as produced, or was reinforced in the content of hydrogen peroxide by adding H2O2 commercial solution of different concentration values. The antibacterial and chemical effects of PAW only, PAW with added H2O2, and the coupled effects of PAW + PEF were investigated.
2 Methodology
We exposed E. coli in the planktonic form to two different types of PAW (Figure 1), generated by the transient spark discharge with water electrospray (TS-ES) in open atmospheric air and transient spark batch treatment (TS-B) generated in closed air reactor. The antibacterial action of these two types of PAW was tested as they were produced, or were reinforced by adding H2O2 commercial solution of different concentration values. The control and H2O2 only condition were also tested in the same way as the other PAWs. Bacteria were diluted in the PAW with a ratio of 1:100 (overnight culture: PAW) and incubated for 10 min. A fraction of the incubated bacteria in PAW was sampled and placed in a commercial electroporation cuvette where PEF was applied. The bacteria were not separated from the PAW, and no supplementary liquid was used in the electroporation cuvette. The PEF treatment was applied to the cuvette 2 min after the beginning of the incubation and then all bacteria finished their total 10 min incubation in PAW. Rapid dilutions of the treated bacterial solutions were carried out before being placed in Petri dishes with agar for an overnight incubation.
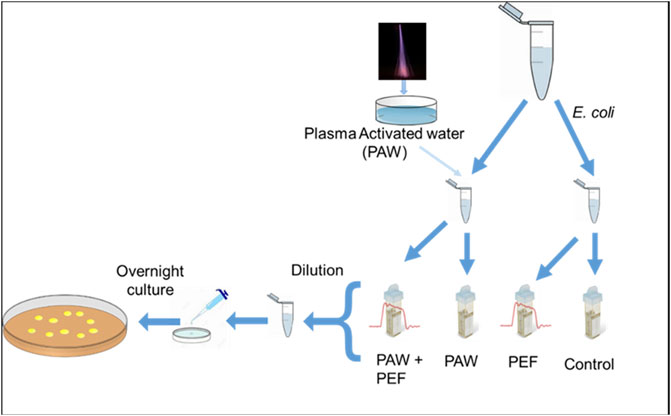
FIGURE 1. Schematics of the experiment to investigate the antibacterial effect of PEF, PAW, and the coupled PAW + PEF.
2.1 Transient Spark in the Batch System in the Closed Air Reactor
Deionized water (DW) is activated by plasma (Figures 2A,B) in a 1L cube-shaped plastic reactor. One side of the cube can be removed, what is here called the “Open reactor” condition, or closed, blocking the renewal of gases from the outside ambient air, what we call the “Closed reactor”. In the reactor, DC-driven transient spark (TS) discharge in positive polarity was generated between the high voltage needle and a surface of 5 ml of DW. DW was contained in a 3-cm-diameter glass Petri dish where a ground stainless steel wire ring electrode was immersed on the dish bottom. TS discharge was initiated by a high electric field that causes a cascade of ionizations by forming pre-spark streamers, which produce ions and pre-heat the channel. Once the channel is sufficiently conductive, the spark appears through the channel as a strong current peak with the amplitude of 1–3 A and duration of 50–150 ns accompanied by a fast voltage drop. A 10 MΩ ballast resistor was placed in series on the output of the HV generator. The electrical discharge parameters were recorded by a digital oscilloscope Tektronix TDS 2024C, the voltage was measured by a high voltage (HV) probe Tektronix P6015A, and the discharge current was measured by a Rogowski coil (Pearson Electronics 2877).
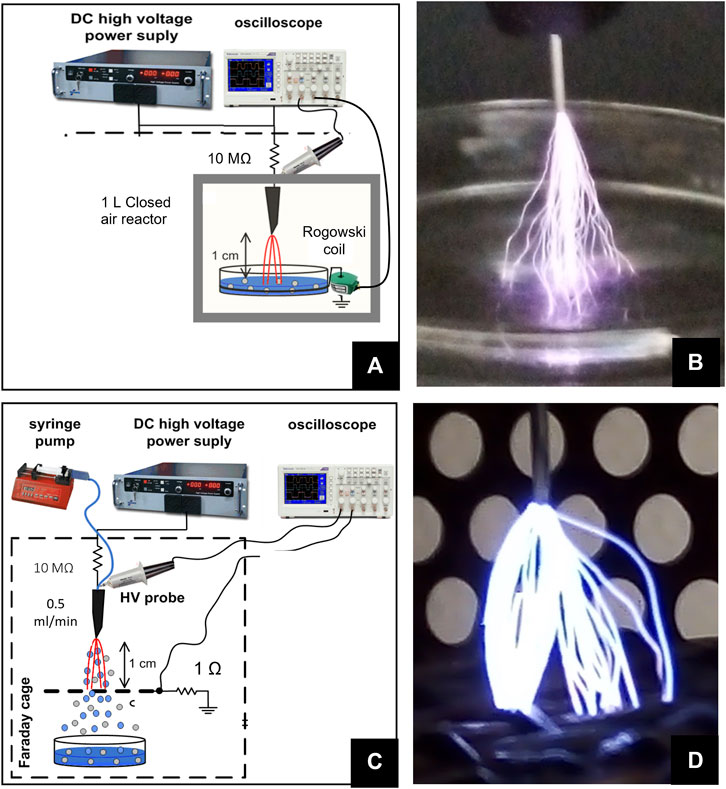
FIGURE 2. (A) Photo of a typical transient spark discharge in the batch (TS-B) discharge in the closed air reactor. (B) Experimental setup of TS-B closed air reactor. (C) Photo of a typical transient spark with water electrospray (TS-ES) open air discharge. (D) Photo of a typical TS-ES open air discharge.
2.2 Transient Spark With a Water Electrospray in Open Air
Plasma-activated water (PAW) in the water electrospray system (Figures 2C,D) was created from DW flowing through a high voltage needle placed 1 cm from a metal grid grounded through a 1 Ω resistor. DW was injected directly into the TS discharge by a syringe pump at the flow rate 1 ml/min and electro-sprayed. More details on the TS with the water electrospray system can be found in our previous studies, for example, [10, 24, 53–55] The PAW was collected in a sterile Petri dish under the grid electrode. Voltage was measured at the needle by a HV probe Tektronix P6015A. Maximum voltage was 15 kV. Current was measured as the voltage drop across the 1 Ω resistor between the grid and the ground. TS with DW electrospray in this configuration typically creates the current pulses of 27–30 A. The oscilloscope measured the frequency of the discharge pulses, which is related to the applied voltage. This frequency is maintained at 1 kHz (+/− 200 Hz) by controlling the output voltage of a DC HV generator. A 10 MΩ ballast resistor was placed on the output of the HV generator.
2.3 Bacteria Cultivation
Bacteria suspension of Gram-negative E. coli (ATCC 25922) was suspended in water in the planktonic form with an initial population of 106 to 107 colony forming units per ml (CFU/ml−1). The suspensions were prepared by the dissolution of bacteria cultivated on sterile liquid nutrient (Lauria–Bertani broth, Biolab). After overnight cultivation (∼18 h at 37°C) bacteria were active and vital. The plasma experiments with bacterial suspensions were performed with PAW generated by TS-ES open air discharge and closed air TS-B, both operating in ambient atmospheric air with water electrospray or batch treatment and were repeated 3–10 times. The number of bacteria cells in the suspension was evaluated immediately after plasma treatment by counting CFUs cultivated on agar plates (Lauria–Bertani agar, Biolab) for 16–18 h at 37°C. Just after experiment, bacteria were diluted several times into saline solution (0.85% NaCl) to stop the plasma agents’ activity. They were spread on agar plates in Petri dishes and incubated overnight. The standard colony forming unit (CFU) cultivation method was employed. The numbers of repetitions per each type of experiment are presented in Table 1.
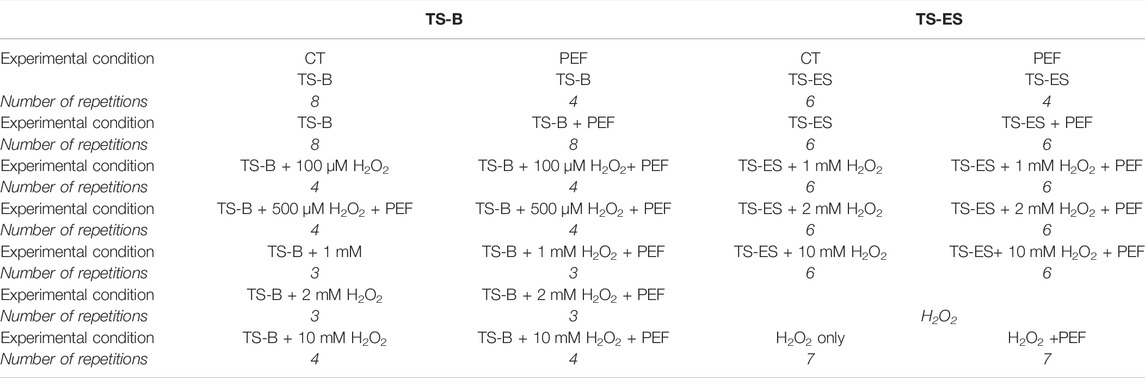
TABLE 1. Number of repetitions of E. coli antibacterial experiment for the different experimental conditions.
2.4 Pulsed Electric Field Application
PAW containing the long-lived RONS is subjected to the pulsed electric field (PEF) to investigate the synergic antibacterial effects of PAW and PEF. E. coli bacteria in the planktonic form in PAW (or DW for reference) were placed in an electroporation cuvette (VWR 732–1136) with a 2 mm interelectrode distance between the planar aluminum electrodes containing 400 μL of liquid. The applied high voltage from SR20-R-1200 Technix power supply was driven by a low voltage 5 V square signal from a function generator controlling a fast high voltage switch (Behlke HTS 301-03GSM). It allowed for the generation of a sequence of square high voltage pulses of 2.5 kV amplitude and 200 ns duration, applied during 100 s at a frequency of 100 Hz in the electroporation cuvette. The voltage was measured by HV probe Tektronix P6015A, and the discharge current was measured by a Rogowski coil (Pearson Electronics 2877). The electrical characteristics were recorded by oscilloscope Tektronix TDS 2024C.
The conductivity of PAW varies with respect to the DW according to the plasma activation times due to the addition of ions. The conductivity was measured by a conductivity meter [GREISINGER Electronique GMH 3430]. The original DW conductivity was 1–2 μS/cm. The plasma activation times 3, 4, and 5 min in a batch closed reactor gave PAW conductivities of 700 μS/cm, 975.5 μS/cm, and 1175 μS/cm, respectively, while the open TS-electrospray reactor made PAW of 474 ± 5 μS/cm. This variable PAW conductivity strongly influenced the amplitude and shape of the square high voltage pulses from the generator. To apply PEFs of similar current/voltage pulse characteristic for the experimental condition “PAW + PEF” and the condition “PEF only”, the conductivity of the control was adjusted to 700 μS/cm by the addition of NaCl in DW.
2.5 Chemical Measurements of RONS in PAW
Long-lived RONS in the PAW are measured by UV/VIS absorption colorimetric methods (spectrophotometer Shimadzu UV-1900).
For hydrogen peroxide H2O2, the colorimetric method described in the study mentioned in reference [56] is applied. A volume of 100 μL of PAW sample is mixed with 10 μL of sodium azide to eliminate the nitrite which reacts with H2O2 and then 50 µL of titanium sulfonate reagent is added to produce pertitanic acid (Eq.10), a yellow color complex, with an absorption peak at 407 nm. According to Lambert–Beer’s law, the concentration of hydrogen peroxide is proportional to the absorption (our calibration gives a molar extinction coefficient ε = 4,03 × 10² L mol−1.cm−1).
In the same way, nitrite
The pH is a key parameter in the PAW chemistry and antibacterial effects [15]. It is measured just after PAW production, using the VTW PH 31–10 pH meter calibrated by 3-point method and after stabilization. The PAW conductivity is measured by using the GREISINGER electronic GMH 3430 conductivity meter.
3 Results and Discussion
3.1 Transient Spark Discharge Characteristics
As shown in Figure 3, DC-driven TS-B and TS-ES discharges in positive polarity were generated in the point-to-plane configuration in ambient air at atmospheric pressure. The TS discharge pulse is always preceded by one or a sequence of small current (∼10 mA) pulses, that is, streamers. For TS-ES (Figure 3B), a steep voltage drop of about 15–20 kV occurs during the strong current pulse of about 15–25 A, for a typical duration of about 20 ns. For TS-B (Figure 3A), the voltage drop is shallower and takes about 1 µs during a weaker current pulse of 2.5 A.
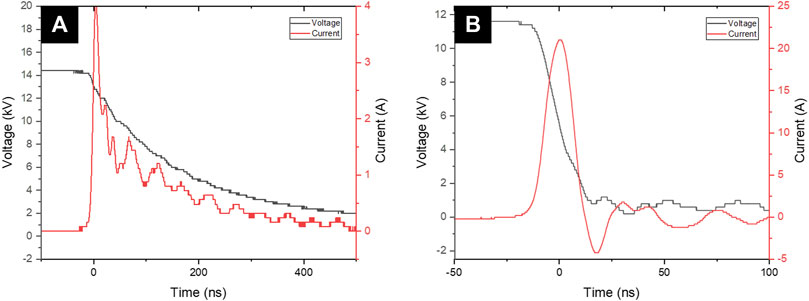
FIGURE 3. Typical voltage/current waveforms for (A) TS-B for 3 min treatment at 1 kHz. (B) TS-ES at 1 kHz and 1 ml/min water flow rate.
TS-ES electrical characteristic is quite stable in time, as this discharge occurs between two metal electrodes (needle-mesh). But for TS-B, in the beginning of the deionized water (DW) plasma exposition, the current pulse/voltage drop duration is very long (several µs). After a few seconds, the pulse duration becomes considerably shorter and reaches its typical µs drop time duration. Along with this pulse duration reduction of the discharge, the current pulse amplitude tends to increase from several hundred mA to several A. The PAW generated between the ground electrode and the positive needle electrode represents an RC circuit. Penetration of plasma charged particles (H+,
3.2 PEF Characteristics–U, I for Different Liquid Conductivities
Figure 4 shows the typical voltage and current pulse of the PEF treatment: a voltage of 2.5 kV amplitude, that is, the electric field of 12.5 kV/cm for the 2 mm spacing in the electroporation cuvette. Bacteria in the LBB culture medium used for the overnight culture were diluted 1:100 in different PAWs or in DW for the control condition. The conductivity of the control condition was adapted to 700 μS/cm with NaCl added to DW before adding bacteria, which is a typical conductivity of PAW (after 3 min TS-B treatment). The adaptation of the conductivity was necessary to obtain a similar I/U pulses for all PEF treatments, since the current pulse amplitude and shape strongly depend on the water conductivity. Application of PEF in the higher-conductive liquid also leads to its heating. The mean pulse power was 0.7 W dissipated in thermal energy into the cuvette.
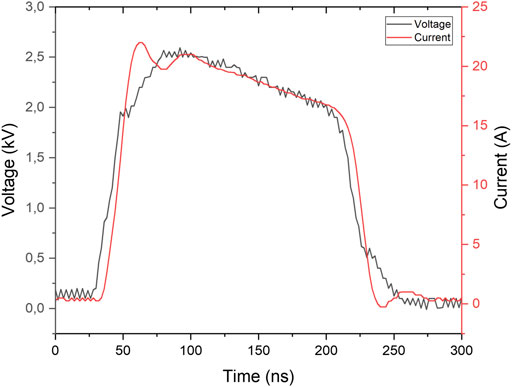
FIGURE 4. Typical electrical characteristic of the PEF applied in the electroporation cuvette with PAW.
3.3 PAW Chemistry–RONS
3.3.1 Open Air Transient Spark With Water Electrospray (TS-ES)
Figure 5A shows the time evolution of H2O2 and
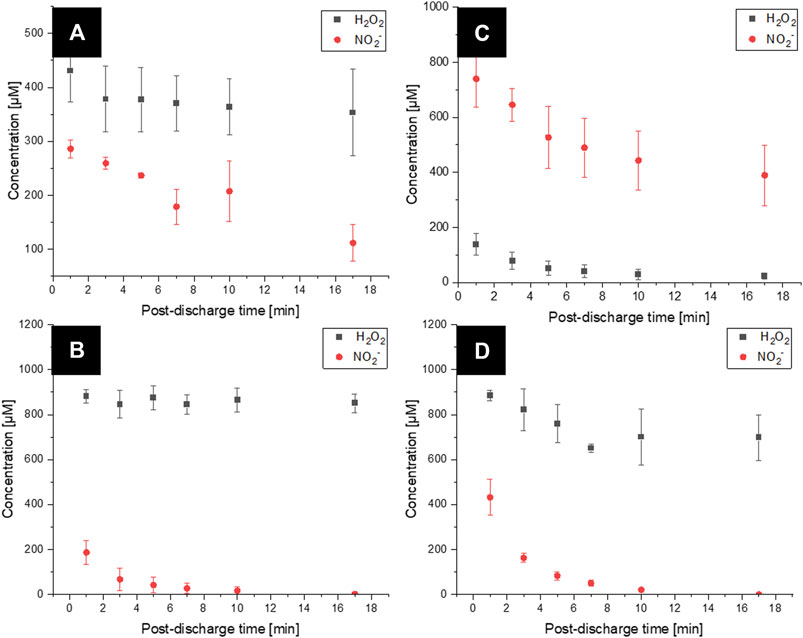
FIGURE 5. Temporal evolution of H2O2 and
3.3.2 Closed Air Reactor Transient Spark Batch Treatment (TS-B)
In the closed reactor batch treatment (TS-B) (Figure 5C), the initial concentration of H2O2 in this PAW was lower (100 µM) than that in the open reactor, and the concentration of
3.3.3. Post-Discharge Time Evolution of RONS After Adding 1 mM H2O2 in PAW
Figures 5B,D show the time evolution of the concentration of hydrogen peroxide and nitrite in PAW TS-ES and TS-B, respectively, after adding 1 mM H2O2. Adding H2O2 after plasma treatment increased the measured concentration of H2O2. The concentration in
In TS-B PAW after adding 1 mM H2O2 (Figure 5D), a higher initial concentration in H2O2 of 900 µM than in the standard TS-B closed air PAW and a lower
3.4 Antibacterial Effects
3.4.1 PEF Only and H2O2 Only
The antibacterial effect can be expressed by two ways: 1) as a direct reduction of the bacteria population in CFU/ml with respect to the control condition, as shown in Figures 6–8; or 2) in log reduction (eq. 15) of the number of bacteria divided by the number of bacteria in the control condition, as shown in Figure 9.
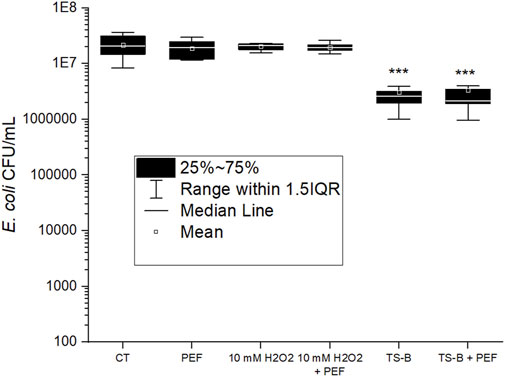
FIGURE 6. E. coli population (CFU/ml) for PEF treatment only, 10 min incubation in 10 mM H2O2 only, and with PEF treatment, PAW generated by TS-B closed air reactor, 10 min incubation in PAW only and coupled with PEF treatment. One-way ANOVA test, (*) p-value < 0.05; (**) p-value < 0.01; and (***) p-value < 0.001 with respect to control (CT). Boxes and whiskers show the median, mean value, interquartile range (IQR), and error bars corresponding to 1.5IQR.
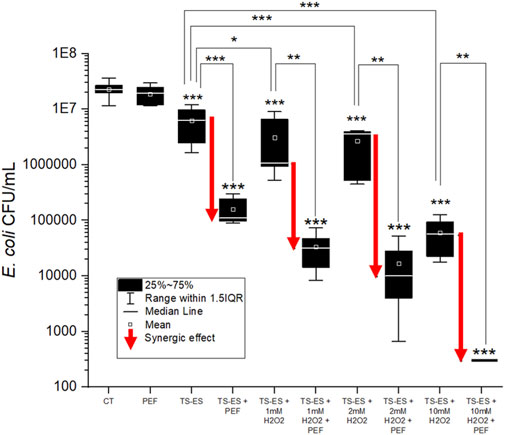
FIGURE 7. E. coli population (CFU/ml) for the different treatments in PAW induced by TS-ES open air reactor without and with adding different concentrations of H2O2 and without and with PEF treatment. One-way ANOVA test, (*) p-value < 0.05; (**) p-value < 0.01; and (***) p-value < 0.001 with respect to control (CT), or other conditions as indicated by lines. Boxes and whiskers show the median, mean value, interquartile range (IQR), and error bars corresponding to 1.5IQR. Red arrows indicate the bacterial population reduction due to synergy of PEF and PAW.
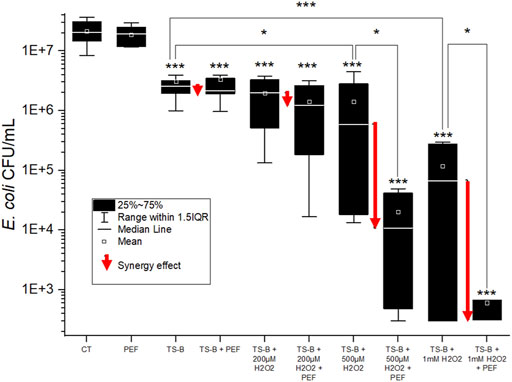
FIGURE 8. E. coli population (CFU/ml) for the different treatments in PAW induced by the TS-B closed air reactor without and with adding different concentrations of H2O2 and without and with PEF treatment. The white dot is the mean, black line in the gray scar is the median, square is the Q1 and Q3, and the whiskers are the extremes value of the experiment. One-way ANOVA test, (*) p-value < 0.05; (**) p-value < 0.01; (***) p-value < 0.001 with respect to control (CT), or other conditions as indicated by lines. Boxes and whiskers show the median, mean value, interquartile range (IQR), and error bars corresponding to 1.5IQR. Red arrows indicate the bacterial population reduction due to synergy of PEF and PAW.
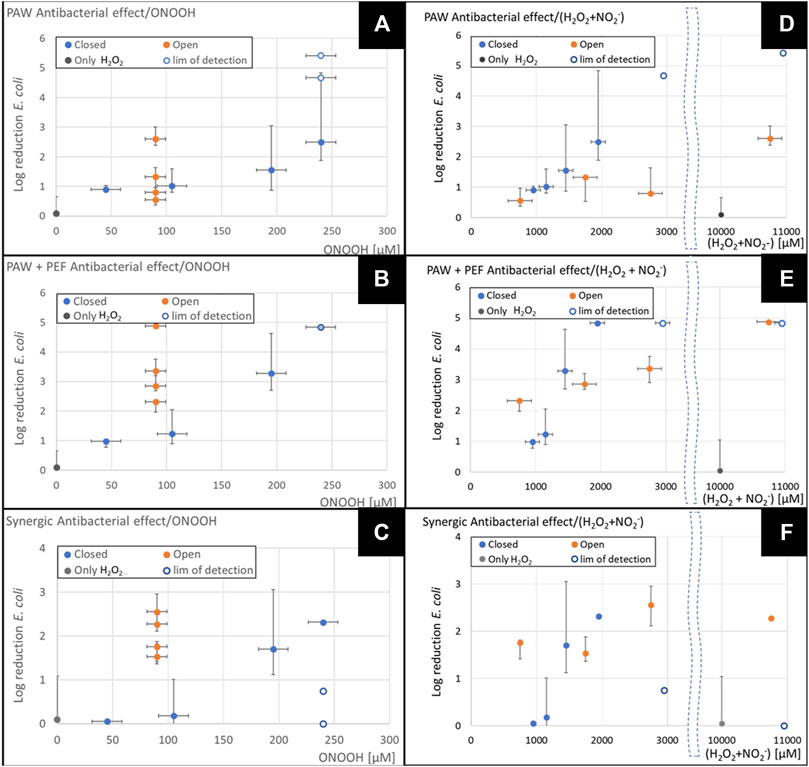
FIGURE 9. Antibacterial effects expressed as log reduction as a function of the sum of
The PEF treatment of 12.5 kV/cm for a pulse duration of 200 ns at a frequency of 100 Hz during a treatment time of 100 s, applied to the E. coli showed no antibacterial effect (Figure 6). This PEF treatment was chosen to be mild to accentuate its synergic effect with PAW and not the antibacterial effect of the PEF itself. A PEF treatment with a longer duration of the pulse or a stronger electric field magnitude can result in a higher efficiency. Also, more repetitions of the pulses can lead to an antibacterial effect due to irreversible electroporation [58], but our mild PEF treatment did not show any lethal effect. The strong electric current circulating in the cuvette during the application produced a temperature increase of a few degrees (from 21 to 30–34°C measured by a thermocouple) for a power of the PEF of approximately 0.7 W. This increase in temperature is known to speed up the pore formation [59, 60]. To prevent this phenomenon from causing a difference in behavior between the control condition and the PAW, the conductivity of the control condition and H2O2 only conditions was adapted to 700 μS/cm (like PAW), as mentioned previously in Section 2.4 and Section 3.2. The same conductivity is needed to obtain the same current/voltage pulse in the cuvette for PAW and for the control or H2O2-only conditions.
In the objective to investigate the antibacterial effect of H2O2 only and its potential interactions with PEF treatment, we tested the highest concentration, 10 mM, which was added in DW, incubated with E. coli and applied PEF treatment during the incubation. The concentration of H2O2 which was added into the PAW was tested in the range 100 μM–10 mM. It is well known that H2O2 as a medical disinfectant is used in much higher concentrations (3% vol., i.e., 0.98 M). H2O2 is also often considered as the key antibacterial or antitumor agent of PAW in synergy with other RONS [61]. However, in our studied maximum concentration of 10 mM H2O2 diluted in DW, we did not observe any antibacterial effect (Figure 6) by H2O2 itself, nor H2O2 combined with PEF. In the PAW studied here, plasma-generated H2O2 concentration did not exceed 600 µM in TS-ES open air discharge and 150 µM in TS-B closed reactor. Even with the addition of 100 μM–1 mM H2O2 in the TS-B or 1–10 mM H2O2 in TS-ES, we operated in the range of H2O2 concentrations far below those where it is typically used as a disinfectant.
Considering this, H2O2 alone should not be considered as the key antibacterial plasma agent. We can hypothesize that H2O2 only cannot be responsible for an efficiency of PEF treatment by penetration through the membrane into the cell or by facilitation of pore formation by peroxidation of the membrane. However, its interaction with other species in the PAW, especially nitrites, makes it a key species resulting in the PAW antibacterial effect, which was even enhanced by PEF, as discussed later.
3.4.2 Open Air TS-ES PAW + PEF
To investigate a coupled antibacterial effect on E. coli of the plasma agents in PAW with PEF treatment, we first incubated the bacteria in PAW generated by the open-air TS-ES discharge. As shown in Figure 7, the 10 min incubation in this PAW obtained a significant antibacterial effect of 0.8 log. The applied PEF treatment during the incubation resulted in the log reduction of 2.2 which represents a synergic effect of 1.4 log. Adding 1, 2 and 10 mM of H2O2 in the PAW further increased the antibacterial effect. The effect of PEF treatment of these PAW + H2O2 conditions also strongly increased the synergy PAW + PEF effect. The log reduction value for the highest added H2O2 concentration (10 mM), is near the detection limit of our microbial cultivation method considering the dilutions (leading to complete sterilization).
Considering our PEF only treatment antibacterial effect is nearly zero, the synergy effect was defined by Eq.16 as a difference between the total PAW + PEF antibacterial effect and the effect of PAW only (in log10 reduction) [62]
In the PAW produced in open-air TS-ES condition (Figure 7), we obtained the antibacterial effect stronger with the addition of PEF than by incubation in PAW only. This synergic antibacterial effect further increased with adding increasing concentrations of H2O2 into the PAW. Increasing H2O2 concentration in this H2O2-dominated PAW did not increase the final product of peroxynitrite (eq. 8) but increased the kinetic of its production and thus increased the quantity of ONOOH and its decay products (radicals OH and
3.4.3 Closed Air TS-B PAW + PEF
The antibacterial effect of TS-B PAW prepared in the closed air reactor and measured without and with the PEF t and with additions of H2O2 (from 0.2 to 10 mM concentration), is shown in Figure 8. PAW only antibacterial effect, as well as PAW + PEF were about 1 log. Adding hydrogen peroxide to the PAW, especially 500 μM and 1 mM, significantly increased its antibacterial effect. PAW + H2O2 combined with PEF treatment induced a strong synergic antibacterial effect.
The antibacterial effects of the PAW open air TS-ES and PAW closed air TS-B are similar, but coupled with PEF treatment, the open-air TS-ES PAW showed a synergy effect, unlike the closed reactor TS-B PAW, which showed no synergy effect with the same PEF treatment. However, adding H2O2 of concentrations 100 μM, 200 μM, 1 mM, 2 and 10 mM to the TS-B PAW have shown a strong and increasing antibacterial effect. The complete sterilization was often observed for the added H2O2 concentrations of 1 and 2 mM, and always for 10 mM. In these cases, the minimum number of colonies was fixed at 300 that corresponds to one colony for every measurement of each experiment repetition. This represents the limit of detection of the countable CFUs. The PEF treatment of these PAW + H2O2 conditions increased the antibacterial effect by increasing the synergic PAW + PEF effect, although less intensely than for TS-ES PAW.
It is interesting that the antibacterial effect of TS-B PAW in the closed air reactor (Figure 8) was as intense as that of TS-ES PAW in the open-air (Figure 7), although PAW in the closed and open air had a different RONS composition. In addition to the reaction between H2O2 and
On the other hand, when adding H2O2, the antibacterial effect increased much more in TS-B than in TS-ES open air for the same added H2O2 concentrations. As discussed earlier in the chemical part, the dynamic of the reaction between H2O2 and
Radicals in contact with the cell membrane cause lipid peroxidation that facilitate the electropermeabilization of the membrane by the PEF treatment. The present data cannot conclude if the synergic antibacterial effect is due to the fragilization of the membrane leading to irreversible electroporation during the PEF treatment or an improvement of RONS lethal activity by passing through the cell membrane and attacking bacterial organelles, DNA, and the internal layer of bacteria membrane’s phospholipids.
3.4.4 Quantification of the Antibacterial Effects in Function of the RONS Concentration
The experiments were performed to investigate the correlations and synergies between the RONS in the PAW and their antibacterial effects tested on E. coli incubated in PAW only, PAW enriched with hydrogen peroxide, and in PAW and PAW + H2O2 coupled with the PEF treatment.
Figures 9A–C shows on the x-axis the sum of the measured concentrations of the key RONS:
The log reduction of E. coli in Figure 9 is shown as the log10 of the median value of each condition divided by the median value of the control (Eq. 15), the same medians shown in Figures 6–8. The asymmetric error bars are calculated by Eq. 18 where Q1 and Q3 are the first and third quartiles of the E. coli population in each treatment condition (as shown in the box graph in Figures 6–8). In the cases of the complete sterilization, we have taken the number of 300 CFU/mL as the detection limit, which corresponds to one colony grown in the lowest dilution on the Petri dish. This minimum CFU/mL value impacts the error bar for the strongest antibacterial treatments (TS-B closed reactor with added 1 mM of H2O2 with and without PEF, TS-B closed with added 500 µM of H2O2; and open-air TS-ES with added 10 mM of H2O2).
Figures 9A–C show that the antibacterial effect increased with the total RONS concentration in a stronger way for the closed TS-B condition than for the TS-ES open condition. The increase of the total RONS is directly linked with the addition of H2O2, which for the open TS-ES reactor simply increased its concentration in the PAW, while for the closed TS-B reactor this also increased the ONOOH concentration, hence the
The estimated ONOOH concentration from the Eq. 8 in Figures 9D–F, shown in the x-axis is obtained from the minimum mean concentration of either H2O2 or
In Figure 9D, TS-ES open air shows a constant concentration of ONOOH estimated to 300 µM for all the conditions because the less concentrated species from either H2O2 or
Figures 9D–F from TS-B closed reactor shows that the increase of ONOOH enhanced the antibacterial effect and also the synergic effect with PEF. We observed that the antibacterial effect of the TS-ES open air PAW was lower than that of the TS-B closed for the same concentration of ONOOH, but the synergic effect (Figure 9F) for the TS-ES was stronger than in the TS-B for the same concentration of ONOOH. The antibacterial effect of H2O2 and the synergic effect of H2O2 with PEF was zero. This result suggests that the presence of ONOOH in the PAW reinforces the effect of the hydrogen peroxide itself and give it a synergic effect with PEF. It was shown by [64] that H2O2 was synergized with longer pulses duration. Maybe the effect of the radicals produced from the ONOOH caused a sublethal damage of the cell membrane facilitating the peroxidation of the phospholipids by the H2O2, which alone had no antibacterial effect, nor was synergic with PEF.
4 Conclusion
The antibacterial effects of atmospheric cold plasma and plasma-activated water are usually investigated separately of the bactericidal treatments of the pulsed electric fields, despite common physicochemical mechanisms and industrial applications. The cold plasma is generated by applying an electric field, hence could lead to electropermeabilization/electroporation mechanisms that contribute in part to the antibacterial effect. PEF treatments generate intracellular RONS and cause lipid peroxidation, and RONS production by PEF treatment is a key factor of the initiation of pore formation in the cell membrane, a promoting factor for a pore growth and for a decrease of the minimum voltage for triggering electroporation.
We investigated the antibacterial effect of PEF and PAW treatment of E. coli individually and in synergy. Chemical measurement of nitrite and H2O2 and antibacterial effects were tested for two types of PAW, generated by transient spark discharge with electrospray in open air (TS-ES) and the same discharge in batch treatment in closed reactor with air (TS-B). This enabled us to obtain different PAW chemistry processes and different roles of the PAW components acting in synergy with PEF in the antibacterial effect. In addition, the PAW was externally doped by the addition of H2O2, and its effect on bacteria coupled with PEF was tested.
PAW generated by TS-ES in open air achieved a ratio of dominant RONS: H2O2/
Despite different RONS in the TS-ES and the TS-B PAW, their antibacterial effects were comparable. In the closed reactor (TS-B) the lower pH and higher concentration of
Figure 10 schematically summarizes the RONS (in the PAW) synergic antibacterial effects with PEF. Knowing if these PEF + PAW combined treatments lead to permeabilization of the cell membrane which would enhance the effect of RONS, or whether the weakening of the membrane will lead to irreversible electroporation, remains an open question. Repeating these experiments with bacteria of different types, in different states, such as biofilms or spores, is necessary in future to make the method generally usable. The understanding of plasma–pulsed electric field–RONS interactions is important not only in bacterial decontamination, but its results can be exploited in other applications, such as wound healing, cancer therapy, food industry, and agriculture.
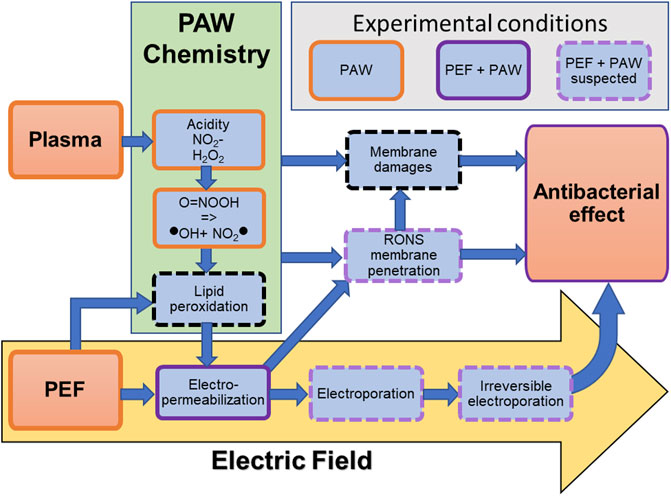
FIGURE 10. Summarizing schematics of the interaction between
Data Availability Statement
The raw data supporting the conclusions of this article will be made available by the authors, without undue reservation.
Author Contributions
RM ran and processed the experiments and wrote the first draft manuscript. ZM planned, organized, and supervised the research, and reviewed and edited the manuscript. All authors have read and agreed to the published version of the manuscript.
Funding
This study was supported by the grant of the Slovak Research and Development Agency (APVV-17-0382) and Slovak Grant Agency VEGA (1/0596/22).
Conflict of Interest
The authors declare that the research was conducted in the absence of any commercial or financial relationships that could be construed as a potential conflict of interest.
Publisher’s Note
All claims expressed in this article are solely those of the authors and do not necessarily represent those of their affiliated organizations, or those of the publisher, the editors, and the reviewers. Any product that may be evaluated in this article, or claim that may be made by its manufacturer, is not guaranteed or endorsed by the publisher.
Acknowledgments
The authors thank Barbora Tarabova (IPP, ASCR Prague) for the help with initial experiments.
References
1. Jablonowski H, von Woedtke T. Research on Plasma Medicine-Relevant Plasma-Liquid Interaction: What Happened in the Past Five Years? Clin Plasma Med (2015) 3(2):42–52. doi:10.1016/j.cpme.2015.11.003
3. Chen C, Smye SW, Robinson MP, Evans JA. Membrane Electroporation Theories: A Review. Med Bio Eng Comput (2006) 44(1–2):5–14. doi:10.1007/s11517-005-0020-2
4. Kotnik T, Rems L, Tarek M, Miklavčič D. Membrane Electroporation and Electropermeabilization: Mechanisms and Models. Annu Rev Biophys (2019) 48:63–91. doi:10.1146/annurev-biophys-052118-115451
5. Casciola M, Tarek M. A Molecular Insight into the Electro-Transfer of Small Molecules through Electropores Driven by Electric fields. Biochim Biophys Acta (Bba) - Biomembranes (2016) 1858(10):2278–89. doi:10.1016/j.bbamem.2016.03.022
6. Nuccitelli R, Lui K, Kreis M, Athos B, Nuccitelli P. Nanosecond Pulsed Electric Field Stimulation of Reactive Oxygen Species in Human Pancreatic Cancer Cells Is Ca2+-dependent. Biochem Biophysical Res Commun (2013) 435:580–5. doi:10.1016/j.bbrc.2013.05.014
7. Szili EJ, Oh J-S, Fukuhara H, Bhatia R, Gaur N, Nguyen CK, et al. Modelling the Helium Plasma Jet Delivery of Reactive Species into a 3D Cancer Tumour. Plasma Sourc Sci. Technol. (2018) 27(1):014001. doi:10.1088/1361-6595/aa9b3b
8. Brisset J-L, Pawlat J. Chemical Effects of Air Plasma Species on Aqueous Solutes in Direct and Delayed Exposure Modes: Discharge, Post-Discharge and Plasma Activated Water. Plasma Chem Plasma Process (2016) 36(2):355–81. doi:10.1007/s11090-015-9653-6
9. Bruggeman PJ, Kushner MJ, Locke BR, Gardeniers JGE, Graham WG, Graves DB, et al. Plasma-Liquid Interactions: A Review and Roadmap. Plasma Sourc Sci. Technol. (2016) 25(5):053002. doi:10.1088/0963-0252/25/5/053002
10. Machala Z, Tarabova B, Hensel K, Spetlikova E, Sikurova L, Lukes P. Formation of ROS and RNS in Water Electro-Sprayed through Transient Spark Discharge in Air and Their Bactericidal Effects. Plasma Process Polym (2013) 10(7):649–59. doi:10.1002/ppap.201200113
11. Tarabová B, Lukeš P, Janda M, Hensel K, Šikurová L, Machala Z. Specificity of Detection Methods of Nitrites and Ozone in Aqueous Solutions Activated by Air Plasma. Plasma Process Polym (2018) 15(6):1800030. doi:10.1002/ppap.201800030
12. Chauvin J, Gibot L, Griseti E, Golzio M, Rols M-P, Merbahi N, et al. Elucidation of In Vitro Cellular Steps Induced by Antitumor Treatment with Plasma-Activated Medium. Sci Rep (2019) 9(1):1–11. doi:10.1038/s41598-019-41408-6
13. Liou G-Y, Storz P. Reactive Oxygen Species in Cancer. Free Radic Res (2010) 44(5):479–96. doi:10.3109/10715761003667554
14. Yan D, Malyavko A, Wang Q, Lin L, Sherman JH, Keidar M. Cold Atmospheric Plasma Cancer Treatment, a Critical Review. Appl Sci (2021) 11(16):7757. doi:10.3390/app11167757
15. Xu D, Wang B, Xu Y, Chen Z, Cui Q, Yang Y, et al. Intracellular ROS Mediates Gas Plasma-Facilitated Cellular Transfection in 2D and 3D Cultures. Sci Rep (2016) 6:27872. doi:10.1038/srep27872
16. Ndiffo Yemeli GB, Švubová R, Kostolani D, Kyzek S, Machala Z. The Effect of Water Activated by Nonthermal Air Plasma on the Growth of Farm Plants: Case of maize and Barley. Plasma Process Polym (2021) 18(1):2000205. doi:10.1002/ppap.202000205
17. Ozen E, Singh RK. Atmospheric Cold Plasma Treatment of Fruit Juices: A Review. Trends Food Sci Technology (2020) 103:144–51. doi:10.1016/j.tifs.2020.07.020
18. Haertel B, Woedtke Tv., Weltmann K-D, Lindequist U. Non-Thermal Atmospheric-Pressure Plasma Possible Application in Wound Healing. Biomolecules Ther (2014) 22(6):477–90. doi:10.4062/biomolther.2014.105
19. Bekeschus S, Schmidt A, Weltmann K-D, von Woedtke T. The Plasma Jet kINPen - A Powerful Tool for Wound Healing. Clin Plasma Med (2016) 4(1):19–28. doi:10.1016/j.cpme.2016.01.001
20. Gorbanev Y, O'Connell D, Chechik V. Non-Thermal Plasma in Contact with Water: The Origin of Species. Chem Eur J (2016) 22(10):3496–505. doi:10.1002/chem.201503771
21. Machala Z, Chládeková L, Pelach M. Plasma Agents in Bio-Decontamination by Dc Discharges in Atmospheric Air. J Phys D: Appl Phys (2010) 43:222001. doi:10.1088/0022-3727/43/22/222001
22. Pavlovich MJ, Sakiyama Y, Clark DS, Graves DB. Antimicrobial Synergy Between Ambient-Gas Plasma and UVA Treatment of Aqueous Solution. Plasma Process Polym (2013) 10:1051–60. doi:10.1002/ppap.201300065
23. Kurake N, Tanaka H, Ishikawa K, Takeda K, Hashizume H, Nakamura K, et al. Effects of OH and NO Radicals in the Aqueous Phase on H2O2 and NO2- Generated in Plasma-Activated Medium. J Phys D: Appl Phys (2017) 50(15):155202. doi:10.1088/1361-6463/aa5f1d
24. Machala Z, Tarabova B, Sersenova J, Hensel K. Chemical and Antibacterial Effects of Plasma Activated Water: Correlation with Gaseous and Aqueous Reactive Oxygen and Nitrogen Species. J Phys D: Appl Phys (2019) 52:03400217. doi:10.1088/1361-6463/aae807
25. Pavlovich MJ, Clark DS, Graves DB. Quantification of Air Plasma Chemistry for Surface Disinfection. Plasma Sourc Sci. Technol. (2014) 23(6):065036. doi:10.1088/0963-0252/23/6/065036
26. Jablonowski H, Bussiahn R, Hammer MU, Weltmann K-D, von Woedtke T, Reuter S. Impact of Plasma Jet Vacuum Ultraviolet Radiation on Reactive Oxygen Species Generation in Bio-Relevant Liquids. Phys Plasmas (2015) 22:122008. doi:10.1063/1.4934989
27. Locke BR, Shih K-Y. Review of the Methods to Form Hydrogen Peroxide in Electrical Discharge Plasma with Liquid Water. Plasma Sourc Sci. Technol. (2011) 20:034006. doi:10.1088/0963-0252/20/3/034006
28. Lukes P, Dolezalova E, Sisrova I, Clupek M. Aqueous-phase Chemistry and Bactericidal Effects from an Air Discharge Plasma in Contact with Water: Evidence for the Formation of Peroxynitrite through a Pseudo-second-order post-discharge Reaction of H2O2and HNO2. Plasma Sourc Sci. Technol. (2014) 23(1):015019. doi:10.1088/0963-0252/23/1/015019
29. Girard F, Badets V, Blanc S, Gazeli K, Marlin L, Authier L, et al. Formation of Reactive Nitrogen Species Including Peroxynitrite in Physiological Buffer Exposed to Cold Atmospheric Plasma. RSC Adv (2016) 6(82):78457–67. doi:10.1039/c6ra12791f
30. Janda M, Hensel K, Tóth P, Hassan ME, Machala Z. The Role of HNO2 in the Generation of Plasma-Activated Water by Air Transient Spark Discharge. Appl Sci (2021) 11:7053. doi:10.3390/app11157053
31. Laurita R, Barbieri D, Gherardi M, Colombo V, Lukes P. Chemical Analysis of Reactive Species and Antimicrobial Activity of Water Treated by Nanosecond Pulsed DBD Air Plasma. Clin Plasma Med (2015) 3(2):53–61. doi:10.1016/j.cpme.2015.10.001
32. Kruszelnicki J, Lietz AM, Kushner MJ. Atmospheric Pressure Plasma Activation of Water Droplets. J Phys D: Appl Phys (2019) 52:355207. doi:10.1088/1361-6463/ab25dc
33. Hassan M, Janda M, Machala Z. Transport of Gaseous Hydrogen Peroxide and Ozone into Bulk Water vs. Electrosprayed Aerosol. Water (2021) 13(2):182. doi:10.3390/w13020182
34. Wu S, Zhang Q, Ma R, Yu S, Wang K, Zhang J, et al. Reactive Radical-Driven Bacterial Inactivation by Hydrogen-Peroxide-Enhanced Plasma-Activated-Water. Eur Phys J Spec Top (2017) 226:2887–99. doi:10.1140/epjst/e2016-60330-y
35. Darny T, Pouvesle J-M, Puech V, Douat C, Dozias S, Robert E. Analysis of Conductive Target Influence in Plasma Jet Experiments through Helium Metastable and Electric Field Measurements. Plasma Sourc Sci. Technol. (2017) 26:045008. doi:10.1088/1361-6595/aa5b15
36. Lin L, Yan D, Gjika E, Sherman JH, Keidar M. Atmospheric Plasma Meets Cell: Plasma Tailoring by Living Cells. ACS Appl Mater Inter (2019) 11(34):30621–30. doi:10.1021/acsami.9b10620
37. Dozias S, Pouvesle JM, Robert E. Comment on 'Mapping the Electric Field Vector of Guided Ionization Waves at Atmospheric Pressure', (2020) Plasma Res. Express 2 025014. Plasma Res Express (2021) 3:038001. doi:10.1088/2516-1067/ac18b9
38. Rems L, Miklavčič D. Tutorial: Electroporation of Cells in Complex Materials and Tissue. J Appl Phys (2016) 119:201101. doi:10.1063/1.4949264
39. Tero R, Suda Y, Kato R, Tanoue H, Takikawa H. Plasma Irradiation of Artificial Cell Membrane System at Solid-Liquid Interface. Appl Phys Express (2014) 7(7):077001–6. doi:10.7567/APEX.7.077001
40. Yusupov M, Van der Paal J, Neyts EC, Bogaerts A. Synergistic Effect of Electric Field and Lipid Oxidation on the Permeability of Cell Membranes. Biochim Biophys Acta (Bba) - Gen Subjects (2017) 1861(4):839–47. doi:10.1016/j.bbagen.2017.01.030
41. Maccarrone M, Bladergroen MR, Rosato N, Agro AF. Role of Lipid Peroxidation in Electroporation-Induced Cell Permeability. Biochem Biophysical Res Commun (1995) 209:417–25. doi:10.1006/bbrc.1995.1519
42. Leduc M, Guay D, Leask RL, Coulombe S. Cell Permeabilization Using a Non-Thermal Plasma. New J Phys (2009) 11:115021. doi:10.1088/1367-2630/11/11/115021
43. Tero R, Yamashita R, Hashizume H, Suda Y, Takikawa H, Hori M, et al. Nanopore Formation Process in Artificial Cell Membrane Induced by Plasma-Generated Reactive Oxygen Species. Arch Biochem Biophys (2016) 605:26–33. doi:10.1016/j.abb.2016.05.014
44. Vernier PT, Levine ZA, Wu Y-H, Joubert V, Ziegler MJ, Mir LM, et al. Electroporating fields Target Oxidatively Damaged Areas in the Cell Membrane. Plos One (2009) 4:e7966. doi:10.1371/journal.pone.0007966
45. Zhang Q, Zhuang J, von Woedtke T, Kolb JF, Zhang J, Fang J, et al. Synergistic Antibacterial Effects of Treatments with Low Temperature Plasma Jet and Pulsed Electric fields. Appl Phys Lett (2014) 105:104103. doi:10.1063/1.4895731
46. Steuer A, Wolff CM, von Woedtke T, Weltmann K-D, Kolb JF. Cell Stimulation versus Cell Death Induced by Sequential Treatments with Pulsed Electric fields and Cold Atmospheric Pressure Plasma. Plos One (2018) 13(10):e0204916. doi:10.1371/journal.pone.0204916
47. Wolff CM, Steuer A, Stoffels I, von Woedtke T, Weltmann K-D, Bekeschus S, et al. Combination of Cold Plasma and Pulsed Electric fields - A Rationale for Cancer Patients in Palliative Care. Clin Plasma Med (2019) 16:100096. doi:10.1016/j.cpme.2020.100096
48. Wolff CM, Kolb JF, Weltmann K-D, von Woedtke T, Bekeschus S. Combination Treatment with Cold Physical Plasma and Pulsed Electric Fields Augments ROS Production and Cytotoxicity in Lymphoma. Cancers (2020) 12(4):845. doi:10.3390/cancers12040845
49. Banaschik R, Burchhardt G, Zocher K, Hammerschmidt S, Kolb JF, Weltmann K-D. Comparison of Pulsed corona Plasma and Pulsed Electric fields for the Decontamination of Water Containing Legionella pneumophila as Model Organism. Bioelectrochemistry (2016) 112:83–90. doi:10.1016/j.bioelechem.2016.05.006
50. Griseti E, Kolosnjaj-Tabi J, Gibot L, Fourquaux I, Rols M-P, Yousfi M, et al. Pulsed Electric Field Treatment Enhances the Cytotoxicity of Plasma-Activated Liquids in a Three-Dimensional Human Colorectal Cancer Cell Model. Sci Rep (2019) 9:7583. doi:10.1038/s41598-019-44087-5
51. García D, Gómez N, Mañas P, Condón S, Raso J, Pagán R. Occurrence of Sublethal Injury after Pulsed Electric fields Depending on the Micro-organism, the Treatment Medium Ph and the Intensity of the Treatment Investigated. J Appl Microbiol (2005) 99(1):94–104. doi:10.1111/j.1365-2672.2005.02611.x
52. Pastorek M, Suchoňová M, Konečná B, Pásztor S, Petrus J, Ivašková N, et al. The Effect of Air Plasma Activated Liquid on Uropathogenic Bacteria. Plasma Chem Plasma Process (2022) 42(3):561–74. doi:10.1007/s11090-022-10239-1
53. Janda M, Martišovitš V, Machala Z. Transient Spark: a Dc-Driven Repetitively Pulsed Discharge and its Control by Electric Circuit Parameters. Plasma Sourc Sci. Technol. (2011) 20:035015. doi:10.1088/0963-0252/20/3/035015
54. Janda M, Machala Z, Niklová A, Martišovitš V. The Streamer-To-Spark Transition in a Transient Spark: a Dc-Driven Nanosecond-Pulsed Discharge in Atmospheric Air. Plasma Sourc Sci. Technol. (2012) 21:045006. doi:10.1088/0963-0252/21/4/045006
55. Tarabová B, Lukeš P, Hammer MU, Jablonowski H, von Woedtke T, Reuter S, et al. Fluorescence Measurements of Peroxynitrite/peroxynitrous Acid in Cold Air Plasma Treated Aqueous Solutions. Phys Chem Chem Phys (2019) 21(17):8883–96. doi:10.1039/c9cp00871c
56. Eisenberg G. Colorimetric Determination of Hydrogen Peroxide. Ind Eng Chem Anal Ed (1943) 15(5):327–8. doi:10.1021/i560117a011
57. Lukes P, Locke BR, Brisset JL. Aqueous-Phase Chemistry of Electrical Discharge Plasma in Water and in Gas-Liquid Environments. Plasma Chem Catal Gases Liquid (2012)(7) 243–308. doi:10.1002/9783527649525.CH7
58. Pillet F, Formosa-Dague C, Baaziz H, Dague E, Rols M-P. Cell wall as a Target for Bacteria Inactivation by Pulsed Electric fields. Sci Rep (2016) 6:19778. doi:10.1038/srep19778
59. Song J, Joshi RP. Temperature Effects on High-Intensity, Ultrashort Electric Pulse Induced Cell Death. 2014 40th Annual Northeast Bioengineering Conference (NEBEC) (2014). doi:10.1109/NEBEC.2014.6972944
60. Joshi R. Synergy Between Electric Pulse and Thermal Effects. Ultrashort Electric Pulse Effects Biol Med (2021) 301–15. doi:10.1007/978-981-10-5113-5_1310.1007/978-981-10-5113-5_12
61. Hohnholt MC, Blumrich EM, Dringen R. Multiassay Analysis of the Toxic Potential of Hydrogen Peroxide on Cultured Neurons. J Neurosci Res (2014) 93:1127–37. doi:10.1002/jnr.23502
62. Trosset J-Y, Carbonell P. Synergistic Synthetic Biology: Units in Concert. Front Bioeng Biotechnol (2013) 1:1–11. doi:10.3389/fbioe.2013.00011
63. Traylor MJ, Pavlovich MJ, Karim S, Hait P, Sakiyama Y, Clark DS, et al. Long-term Antibacterial Efficacy of Air Plasma-Activated Water. J Phys D: Appl Phys (2011) 44:472001. doi:10.1088/0022-3727/44/47/472001
Keywords: cold atmospheric plasma (CAP), plasma activated water (PAW), pulsed electric field (PEF), E. coli (Escherichia coli), antibacterial effect
Citation: Mentheour R and Machala Z (2022) Coupled Antibacterial Effects of Plasma-Activated Water and Pulsed Electric Field. Front. Phys. 10:895813. doi: 10.3389/fphy.2022.895813
Received: 14 March 2022; Accepted: 24 June 2022;
Published: 18 July 2022.
Edited by:
Anna Guller, Macquarie University, AustraliaReviewed by:
Peter J. Bruggeman, University of Minnesota Twin Cities, United StatesHonghua Hu, Macquarie University, Australia
Isaac Ekoto, Sandia National Laboratories (DOE), United States
Copyright © 2022 Mentheour and Machala. This is an open-access article distributed under the terms of the Creative Commons Attribution License (CC BY). The use, distribution or reproduction in other forums is permitted, provided the original author(s) and the copyright owner(s) are credited and that the original publication in this journal is cited, in accordance with accepted academic practice. No use, distribution or reproduction is permitted which does not comply with these terms.
*Correspondence: Robin Mentheour, cm9iaW4ubWVudGhlb3VyQGdtYWlsLmNvbQ==, b3JjaWQub3JnLzAwMDAtMDAwMS04ODkyLTEzMTE=; Zdenko Machala, bWFjaGFsYUBmbXBoLnVuaWJhLnNr, b3JjaWQub3JnLzAwMDAtMDAwMy0xNDI0LTEzNTA=