 Lishuang Li
 Yanan Sun
 Honghui He
 Gaiying He1,2
 Yi Wang
- 1Experimental Research Center, China Academy of Chinese Medical Sciences, Beijing, China
- 2Beijing Key Laboratory of Research of Chinese Medicine on Prevention and Treatment for Major Disease, China Academy of Chinese Medical Sciences, Beijing, China
- 3Guangdong Research Center of Polarization Imaging and Measurement Engineering Technology, Shenzhen Key Laboratory for Minimal Invasive Medical Technologies, Institute of Optical Imaging and Sensing, Tsinghua Shenzhen International Graduate School, Tsinghua University, Shenzhen, China
- 4Institute of Biopharmaceutical and Health Engineering, Tsinghua Shenzhen International Graduate School, Tsinghua University, Shenzhen, China
The primary goal of wound healing therapy is to quickly close the wound and form healthy and functional scar tissue. As capillary system regeneration is an important condition for skin wound healing, it is important to dynamically monitor angiogenesis with multiple methods based on the 3D reconstruction of dermal microcirculation. In this study, we established a quantitative system to comprehensively evaluate angiogenesis and perfusion during wound healing. Full-thickness skin wounds were generated on the back of rats. Laser Doppler anemometer (LDA), laser speckle contrast imaging (LSCI), and medical electronic dermoscopy (MED) are used to observe the vasculature from the horizontal plane and quantify blood perfusion in wounds. We combined immunofluorescence staining and two-photon excited fluorescence microscopy (TPEF) to reconstruct 3D vessels for longitudinal quantification. These results indicated that new blood vessels around the wound grew parallel to the wound surface. The shape of the blood vessels changed from curved to straight, and the density of the surrounding vascular network gradually decreased as manifested by a decrease in the nodes and branches and the total length of the blood vessels. There were dense blood vessels that grew vertically to the wound surface in the center of the wound. This study established a real-time, non-invasive system to monitor re-epithelialization and angiogenesis and quantitatively assess blood vessels during wound healing, which facilitates the evaluation of new treatments for wound healing.
Introduction
Wound healing is a dynamic process that includes re-epithelialization, granulation tissue formation, and angiogenesis [1–3]. During wound healing, the capillary grows rapidly and robustly, reaching three or more times that of normal tissue. This high-density blood vessel system helps restore the supply of oxygen and nutrients for cell proliferation, migration, and metabolic activities to fill the wound [4–6]. Therefore, the degree of angiogenesis during wound healing is a proper indicator to track wound healing. Studies have shown that blood vessels grow around the edge of the wound during wound healing [7]. Furthermore, the accumulation of proliferative and migration epithelial cells forms thickened and rolled wound edges [8–10]. This special structure also clearly locates new blood vessels.
Skin microcirculation can be divided into two horizontal blood vessel plexuses. One is located 1–1.5 mm below the skin surface, and the other is located at the dermis-subcutaneous junction. In the upper plexus, the capillaries rise to form the dermal papillary ring, which continuously supplies the skin with nutrients. At the lower dermis-subcutaneous junction, collecting veins with reverse venous flow prevents blood flow retrogradation. Therefore, restoration of microcirculation in the upper and lower plexus is very important during the wound healing process. Currently, there are a variety of optical methods to detect blood vessels and perfusion in the upper horizontal plexus, such as laser speckle contrast imaging, which rely on quantification of red blood cell (RBC) flow per unit time [11]. We computerized the capillary video microscopy system to observe all dynamic and cooperative processes between capillaries, especially the superficial networks [12]. Although the role of the superior vascular plexus in wound healing appears to be more important than that of the inferior vascular plexus, the blood supply of the upper vascular plexus is derived from the lower vascular plexus during wound healing. However, the evaluation of superficial blood vessels from the horizontal plane cannot represent the actual microcirculation. Therefore, details of the upper and lower vascular plexus must be collected, both in the vertical and horizontal planes, to establish a complete blood vessel evaluation system.
Histological analysis remains the basis for the evaluation of skin wound healing. Currently, optical imaging is emerging as a potential alternative to traditional methods of examining wound healing. In this study, various optical imaging techniques were used to characterize and localize migrating epidermal cells in vivo. In addition, comparing the information collected from tissue slices with live images was beneficial for the in vitro and in vivo localization of migrating epithelial cells, and the localization of regenerated blood vessels was more comprehensive and reliable. The established system for quantifying vessel characteristics and blood flow was then used to dynamically evaluate the wound healing process of the rat model in 15 days.
Materials and Methods
Animals
A total of 12 male Wistar rats (weight 180–200 g) were purchased from Beijing Weitong Lihua Laboratory Animal Technology Co., Ltd. China. The rats were placed under a circumstance with a controlled 12:12 h light–dark cycle, a standard diet, and free drinking water. The animal experiments were supervised and approved by the Research Ethics Committee of the China Academy of Chinese Medical Sciences (ERCCACMS-2106-13).
Modeling Method
Rats were anesthetized with isoflurane, shaved the back hair with a shaver, removed the remaining hair with hair removal creams, and cleaned with saline. The middle part of the back was selected as the surgical area. After disinfection of the surgical area, we cut two pieces of round skin (1.4 cm in diameter and 1.54 cm2 in area) at a point 1 cm away from the spine on both sides to fully expose the muscular layer after the skin excision. Subsequently, we kept the wound open and stained the blood, and the rats used to observe the migration of the edge of the wound were marked with surgical sutures around the wound to denote the direction of migration [13]. Last, rats were placed in a clean cage and fed according to the standard.
Optical Imaging
Optical coherence tomography (OCT): OCT (QSLF-1500, Shenzhen MOPTIM Imaging Technique Co., Ltd., China) was used to observe the vertical plane of the back in vivo. The OCT with a center wavelength λ = 850 nm and a 10-mm linear scanning length can cover the entire wound. A line scanning mode was used to capture the image, and the resolution was 320 × 240. The height and direction of the lens were adjusted to align the line scan area with the center area of the wound until the collected signal strength remained at high-level stability. The image was substantially horizontal and acquired [14, 15] with the image parameters acquired by ImageJ software.
Medical electronic dermoscopy (MED): MED (CH-DSIS-2000, ChuangHong Medical Technology Co., Ltd., China) was used to observe the route and direction of blood vessels using a 20X lens of the dermoscope to acquire a wound area image. Each wound was measured three times.
Laser speckle contrast imaging (LSCI): LSCI (SIM BFI HR Pro, Wuhan XunWei Optoelectronic Technology Co., Ltd., China) was used to observe blood perfusion and the diameter of vessels. The microscope was connected to the computer for real-time positioning and calibration to collect the real-time image and the blood flow image at the same time with an acquisition time of 100 s. After anesthesia with isoflurane, the rat was placed 30 cm vertically away from the stereo microscope. The intensity of the LED light was 4,000, the optical multiple was 12 times, and the brightness was level 1. The image analysis was performed by using the laser speckle blood flow imaging system (SIM BFI-WF; SIM Opto-Technology Co., Ltd., Wuhan, China). The blood perfusion of the back of the rat was collected and calculated as a perfusion unit (PU), in addition to the diameter that could also be counted. The color column range on the right side of the perfusion image was unified to 0–366, which can be divided into different levels, such as 0–90, 90–182, 182–274, and 274–366 (Figure 1). The color column range of 0–90 was not counted because the signal was very low and not in the wound area. The split channel function in ImageJ was used to segment the three RGB channels (red, green, and blue) for statistics, and then, the regions marked under the three channels were separately counted to understand the percentage of the different regions of blood perfusion.
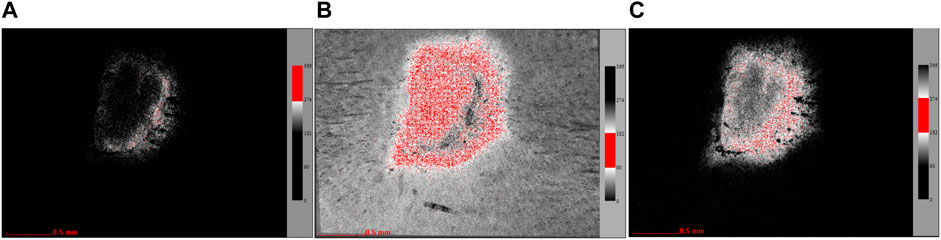
FIGURE 1. Channel split diagram (the red region is the selected area in the exact channel). (A) Images extracted under the red channel (274–366). (B) Images extracted under the blue channel (182–274). (C) Images extracted under the green channel (90–182).
Laser Doppler anemometer (LDA): LDA (CAM1CVF, KK Research Technology Ltd., England) was used to observe the shape and route of the vessel. Several drops of mineral oil were placed on the back surface of the rats in order to change the refractive index, and the laser was focused on the wound area. The image acquisition should be carried out; when the influence of reflection was minimal and the image was the clearest, three images were obtained at each site. Each image was 16 μm (lateral) × 8 μm (axial) [16]. ImageJ software was used for image post-analysis. First, the blood vessel image was manually outlined and exported according to the original image. Angiogenesis analysis plug-in was used to analyze the images; the phase contrast of HUVEC was selected for automatic analysis, and then, the automatic extracted network diagram and the node diagram can be obtained [11]. At the same time, the number of junctions, nodes, main segments, mesh, branches, and other data can also be obtained.
Two-photon excited fluorescence microscopy (TEPF): TEPF was used to observe the specific route and calculate the diameter of small vessels. The rats were injected with rhodamine dextran (RD) solution (8 ml/ml) through the tail vein. Signals were collected from the back using TPEF which had the ×25 objective lens with an aperture of 1.05 with the Mai Tai DeepSee laser (100 fs, 80 MHz; Mai Tai HP DS-OL, Spectra-Physics, Inc. CA). The image acquisition was performed at an excitation wavelength of 860 nm with a 690-nm dichroic mirror and a 605–680 nm emission filter [17–22]. The images were obtained from the epidermis to dermis and stored as a z-stack image sequence (step size of 1 μm on the z-axis). The image size was 512 × 512 pixels, and the scanning speed was 2 μm/pixel.
Masson and H&E Staining
After collecting all the in vivo data, the wound skin tissue was removed and fixed with 4% paraformaldehyde for a week. Then, it was dehydrated and embedded in paraffin to make paraffin sections showing the longitudinal section of the wound. The paraffin sections were dewaxed with water, stained according to the instructions (Masson’s staining Kit, Cat. G1345, Beijing Solarbio Science & Technology Co. Ltd., China; H&E staining, Cat. BLB-05and03, Beijing Jiu Zhou Bai Lin Biotechnology Co., Ltd., China), and finally dehydrated and mounted. The wound was scanned with a panoramic scanner (VS.120, Olympus, Tokyo, Japan).
Immunofluorescence Staining
The paraffin section was deparaffinized and rehydrated, washed with 0.01 M PBS three times, and then blocked with 5% goat serum. A 1:500 dilution of the anti-CD31 antibody EPR17259 (ab182981) was added and incubated overnight at 4°C. After washing with PBS, the sections were incubated for 1 h at room temperature in the dark with a secondary antibody (Alexa Fluor 594-labeled goat anti-rabbit IgG (H + L), dilution 1:500) [23, 24]. After immunostaining, the specimens were examined with a wide-field fluorescence microscope (BX51, Olympus, Tokyo, Japan) fitted with a digital camera (DP71; Olympus).
Statistical Analysis
The image parameters were measured by ImageJ software (V1.8.0). All data are expressed as means with standard and were analyzed by two-way ANOVA or one-way ANOVA tests, and differences between groups were identified by Bonferroni post-tests or Tukey’s post hoc tests using GraphPad Prism v.6.0 (GraphPad software, Inc. La Jolla, Calif.). p < 0.05 was regarded as significant.
Results
Determination of the Observation Area
The back of the rat was divided into six areas, namely, the upper, middle, and lower areas, and each area was evenly divided into the left and right sides (Figure 2A). The LSCI image (Figures 2B,C) showed that the red region in the middle with an even distribution indicated the region with high blood perfusion. The volume of blood perfusion in the right middle region was the highest. The capillaries in the back of the rat were in a network-like distribution, and the upper and lower parts had fewer blood vessel networks. In contrast, more blood vessel networks were in the middle part, especially in the right middle part (Figure 2F), which was consistent with the results of the blood flow observation. The penetration depth of the OCT was approximately 2 mm, and the resolution range was 4–10 μm. The OCT image contains tissue reflectivity information, and the optical attenuation follows depth-wise. The OCT intensity was termed the OCT reflectivity. The intensity of the OCT was stronger and more uniform in the middle and lower back than in the upper back (Figures 2D,E).
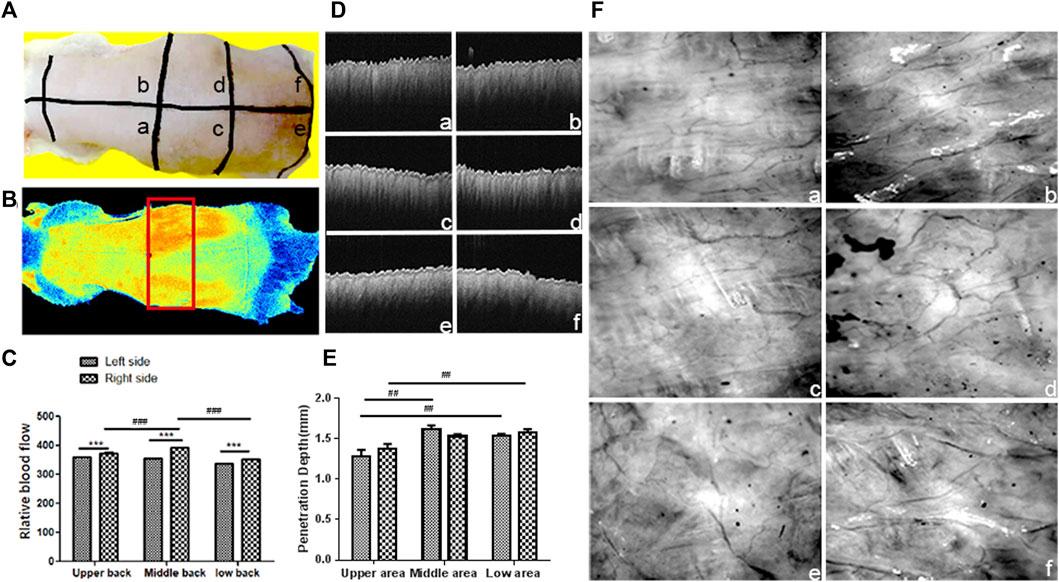
FIGURE 2. Observation of blood perfusion, capillary network, and skin thickness in different regions of the back skin: (A) Image of the back of the rat; the back was divided into six regions by the black line: (A) Upper left region; (B) upper right region; (C) middle left region; (D) middle right region; (E) lower left region; (F) lower right region. (B) Blood perfusion image of the rat back (The red box area is the selected observation area). (C) Statistical chart of blood perfusion; data are expressed as mean ± SD (n = 3) (###p < 0.001 vs. middle right region and ***p<0.001 vs. left side); (D) OCT image of the back skin. (E) Statistical chart of OCT intensity; data are expressed as mean ± SD (n = 3) (##p < 0.001 vs. upper region). (F) LDA image of the capillary network.
In conclusion, LSCI observed that the middle region of the back obtained the highest blood perfusion, corresponding to the results of LDA. The region with a high blood perfusion region also had a rich capillary network. The light penetration and imaging depth of the OCT in the middle and lower regions were extremely high compared to those of the upper region. Since the light transmittance of the skin tissue affects the observation depth, the central part of the back of the rat was selected as the observation area, considering that the light transmittance and blood perfusion in each area of the back of the rat were different.
Capillary Network Tracing in Horizontal and Longitudinal Planes
The region with high blood perfusion was marked with yellow or green in the LSCI image. The path of the main blood vessels and branch vessels was clear, and their diameter and flow could be counted (Figure 3A). The diameter of the main vessel, the blood vessels close to the branches, and the branch blood vessel were 4.328 μm (black line), 3.213 μm (green line), and 2.245 μm (blue line), respectively. The diameter of the vessel marked with the red line could not be measured. The blood perfusion volumes at the thicker branch of the main vessel were 41.8 (black circle) and 43.6 (green circle), respectively. The blood perfusion volumes of the secondary blood vessel branch and the terminal vessels were 40.8 (blue circle), 39.6 (red circle), and 37.5 (purple circle), respectively. The results of the blood flow with different vessel diameters indicated that with the decrease in the diameter of the blood vessel, the blood flow slowed.
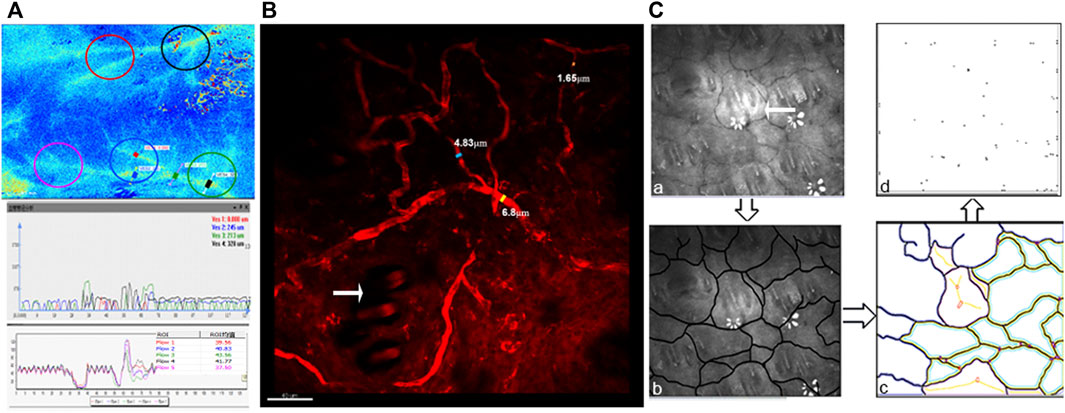
FIGURE 3. Imaging and quantitative analysis of vessels in horizontal planes: (A) LSCI image of the back of the rat (the diameter of the capillaries was marked with blue, green, red and black lines, and blood flow perfusion was marked with red, blue, green, black, and purple circles) and the statistical chart of the capillary diameter and blood flow. (B) TEPF image of capillaries (blue, yellow, and orange lines mark the diameter of the capillaries; the white arrow points to the hair follicle). (C) LDA image of the capillary networks on the back of the rat (white arrows point to hair follicles). The capillary path was outlined manually, and the images of the capillary network and network nodes were extracted.
In the TEPF image (Figure 3B), the path and shape of the blood vessel could be seen more clearly, and the diameter of the blood vessel could be calculated. The diameters of the thick main vessel, branch vessel, and terminal vessel were 6.8 μm (yellow line), 4.83 μm (blue line), and 1.63 μm (orange line), respectively. The microvascular diameter of less than 2 μm could not be counted, and the path of the blood vessel could not be clearly observed using LSCI, compared to TEPF.
Using LDA (Figure 3C), the blood vessel network was observed, and the hair follicles were in the center of the network (white arrow). There were 16 closed blood vessel networks (yellow and green) and nine unclosed blood vessel networks (purple); the total numbers were 25 and 64 nodes of the blood vessel network. The number of both the blood vessel network and the node represented the distribution density of the blood vessels.
In the IF image, there was no distribution of blood vessels in the epidermis (Figure 4A), horizontal, and vertical blood vessels in the superficial and deep layers of the dermis, while the thick blood vessels in the deeper layer of the dermis (white dotted line) had more vessels than in the superficial layer (Figure 4B). In a study based on the vascular assessment of wound healing [25], blood vessels grew in the wound from the bottom and sides of the wound during wound healing, which means that the blood vessels around the wound were mainly parallel to the skin surface, forming horizontal blood vessel networks in the superficial dermis near the epidermis and changing to vertical to the skin surface in the deep dermis. But in the center of the wound, even in the same vertical plane of the skin, whether in the superficial or deep dermis, there were not only blood vessels appearing as circular vessels but also as long strip vessels. Therefore, blood vessels in two directions appear as different shapes in the same vertical section, which should be distinguished in statistics.
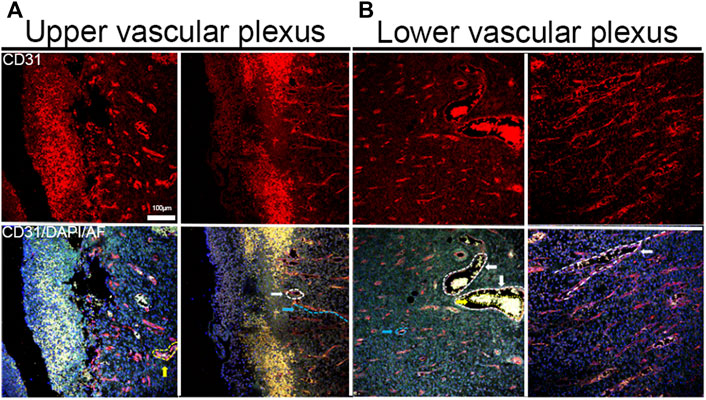
FIGURE 4. IF staining image of blood vessels. (A) Images of horizontal and vertical blood vessels in the superficial dermis (the vertical vessel was marked with blue dotted lines; the horizontal vessel section of horizontal vessels was marked with white dotted lines). (B) Horizontal and vertical blood vessels in the deep dermis (the section of horizontal vessels was marked with blue dotted lines, the sections of large horizontal vessels were marked with white dotted lines, the red blood cells were in large blood vessels, and the path of branch blood vessels was marked with white dotted lines).
Definition of the Wound Edge During Wound Healing
The wound edge with suture migrated to the center during the healing process, that is, the epidermal cells migrated to the center of the wound during the process, which is called re-epithelialization (Figure 5).
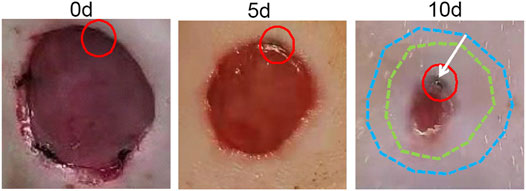
FIGURE 5. Wound migration process. The position of the suture was marked with a red circle after modeling; the shape of the wound after modeling was marked with blue dotted lines; the shape of the wound 5 days after modeling was marked with green dotted lines; the direction of suture migration was indicated by a white arrow.
After 10 days, the granulation tissue grew, and the epidermis covered the wound. Various optical imaging techniques were used to observe the wound edge at this time point (Figure 6F). Migrating epidermal cells appeared as a gray or green circle around the edge of the wound in the LSCI image, according to the color column on the right with a gray level of approximately 2039–3,067 (Figure 6A). The RU range was 182–274 (Figures 6A,B), and the length was 1 mm. Migrating epidermal cells appeared as a pink region around the wound in the MED image (Figure 6B); however, no obvious capillaries were observed. Blood vessels were only observed outside the nascent epithelium (Figure 6B), an observation more clearly achieved using the LDA (Figure 6E). The migrating epidermal cells showed a network structure in the TEPF images (Figure 6C), and a large number of new hair follicles could be observed. HE staining confirmed the observation by in vivo optical imaging, thickened and migrated epidermal cells, and new hair follicles in the dermis were observed in the horizontal sections stained with HE, and the structure was in the same location as the reticular structure observed in the TEPF image (Figure 6D).
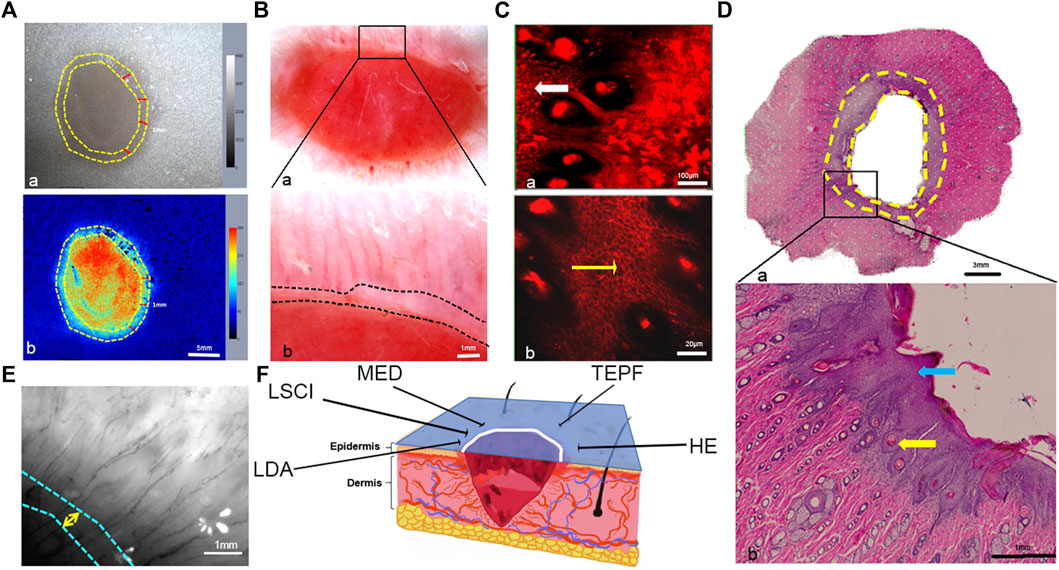
FIGURE 6. Observation of the horizontal plane on the wound margins. (A) Blood perfusion tracking with LSCI (the region between the two yellow dotted lines was the migrating epidermal cells). (B) Wound image with MED and enlarged view of the area marked with a black rectangle (the region between the white dotted lines indicated the migrating epidermal cells). (C) Wound margin imaging with TEPF (the region marked with a white arrow was enlarged, and the yellow arrow indicated the hair follicle). (D) Panorama of the wound with HE staining (the area between the two yellow dotted lines indicated the migrating epidermal cells) and enlarged view of the area marked with a black rectangle (the blue arrow marked the migrated epidermal cells, and the yellow arrow marked the new hair follicle surrounded by the epidermal cells). (E) Wound imaging with LDA (the region between the white and blue dotted lines indicated the migrating epidermal cells). (F) Schematic diagram of the wound and different optical methods (the blue section is the observation area, the white line is the observation area, and the black arrow-pointed direction corresponds to the various observation methods and results, respectively).
The longitudinal plane of the central region of the wound was observed in the OCT image. There was a black hollow with a low reflection signal in the center of the wound (red circle in Figure 7B), corresponding to the photo (Figure 7A). The left and right edges of the wound with low reflected signals (Figure 7B blue and green circles) correspond to the pink regions of the wound edge in the image, indicating nascent immature tissue and inwardly migrating epidermal cells. Therefore, it could be inferred that the low-reflection signal region (the black hollow) on the edge of the wound in the OCT image marked the new immature tissue and the migrating epidermal cells. In the Masson stain image (Figure 7C), the migrating epidermal cells at the wound edge increased and accumulated significantly, and clots were observed in the center, corresponding to the area of low reflection signals in the OCT image. At the edge of the wound, the new hair follicles were observed around the migrating epidermal cells.
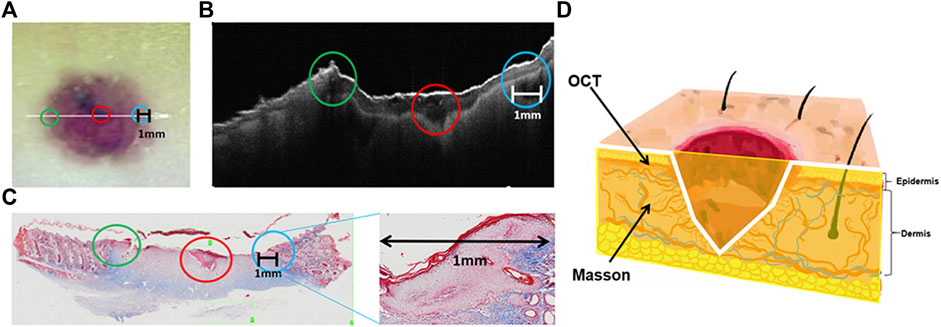
FIGURE 7. Observation of the longitudinal plane of the wound on the skin. (A) Image of the skin wound (the green circle marked the left wound edge, the blue circle marked the right wound edge, the red circle marked the wound center, and the white line marked the length range of the skin wound). (B) OCT image of the longitudinal plane of the skin wound (the green, red, and blue circles are marked with the same content as A). (C) Masson staining of the skin wound and enlarged view of the blue circle (green, red, and blue circles correspond to those in A and B; the black line marks the migration length range of epidermal cells). (D) Three-dimensional sketch of the wound (the yellow section is the observation plane, the white line is the observation area, and the black arrow-pointed direction corresponds to the various observation methods and results, respectively).
Quantitative Analysis of Angiogenesis at Different Time Points During Wound Healing
Blood perfusion could not be measured five days after modeling due to the c blood scab. There was no difference in blood perfusion 10 and 15 days after modeling. The perfusion of blood at the wound edge was greater than in the central area of the wound. The proportion of the mid- and high-perfused regions was smaller, while the proportion of the low-perfused region was higher (Figure 8A). TEPF images showed that the capillaries at the edge of the wound were thin and dense 5 days after modeling, and the diameter of the capillaries was less than 10 μm. At 10 and 15 days, the capillaries were thick and straight, and most of the capillary diameters were 20–30 μm, indicating that the small capillaries gradually faded and remodeled to form thicker capillaries (Figure 8B). On day 5, the small, dense circle of blood vessels grew vertically in the center of the wound. Irregular-shaped vessels are sparsely distributed at the edge of the wound (Figure 8C). Remodeling of blood vessels from small to large occurred primarily around the wound [26]. Wound healing from 5 to 15 days showed capillaries from tortuous to straight. During wound healing, all statistical data, including the number of nodes, junctions, partitions, network length, and branch length, were proportional to capillary density, indicating that the capillary network gradually decreased over time (Figures 8D,E).
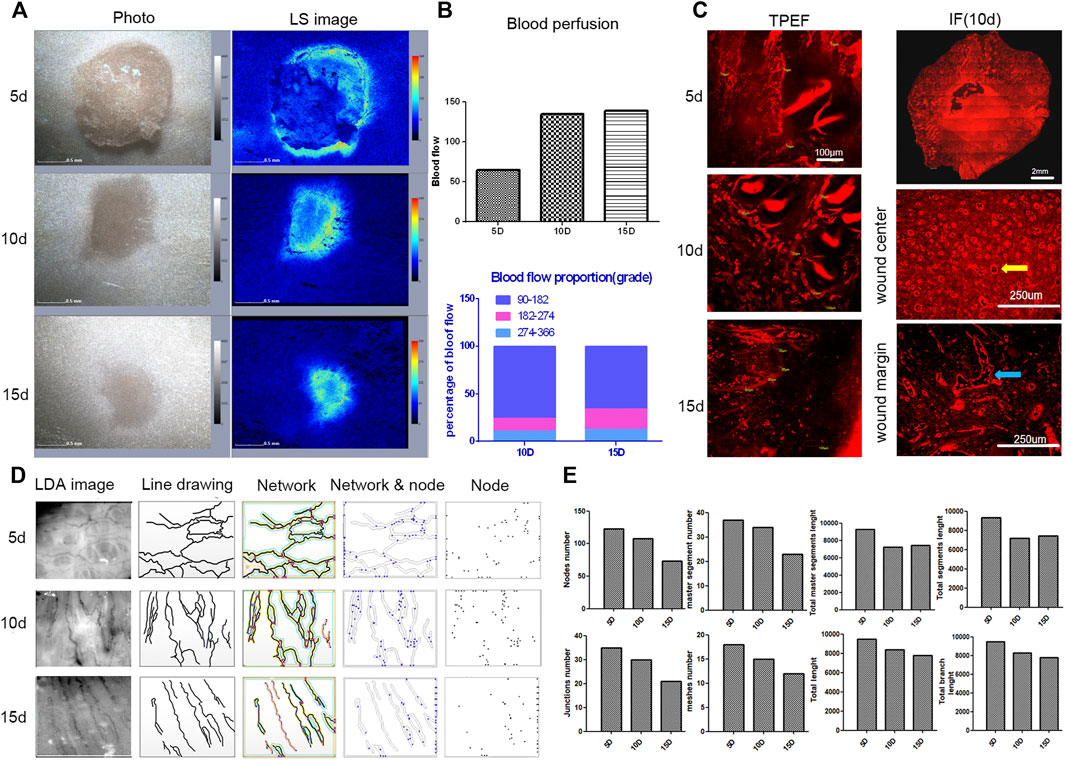
FIGURE 8. Analysis of blood perfusion and vascular morphology during wound healing. (A) LSCI images of wound healing. (B) TPEF images of blood vessels during wound healing. (C) IF staining in horizontal sections of the wound (the panoramic image of the wound and enlarged images of the center of the wound and the wound edge and vertical vessels are marked with yellow arrows). (D) Original and processed images of the LDA in the wound edges (including line drawings, blood vessel network, network and nodes, and nodes). (E) Diagrams of capillary statistics (including node numbers, junction numbers, meshed numbers, master segment numbers, total length, total master segment length, total branch length, and total segment length).
In the superficial dermis, on day 5 of wound healing, the number of blood vessels grew in different directions. The growth direction of blood vessels was consistent and perpendicular to the wound surface 10 days after modeling, but the number of blood vessels decreased compared to 5 days. On day 15, the number of blood vessels was significantly reduced due to remodeling, and capillary networks began to form. In the deep dermis, after wound healing for 5 days, two blood vessels grew vertically and 48 blood vessels grew horizontally, including two thick vessels. After healing for 10 days, the growth direction of blood vessels was consistent and perpendicular to the wound surface (Figure 9A). The number of vertical vessels was 19, and the number of horizontal vessels was four. The number of blood vessels decreased during wound healing for 15 days due to remodeling, and the growth direction was inconsistent. The number of vertical blood vessels was six, and the number of horizontal blood vessels was four (Figure 9B). Therefore, after wound healing from 5 to 15 days, the growth direction of blood vessels remodeled from disordered to consistent to disordered, and the number of blood vessels changed from more to less. This statistical method was based on the classification and counting method mentioned in 3.2. In conclusion, the pattern of angiogenesis during wound healing could be identified by combining in vivo and in vitro observations in horizontal and vertical planes.
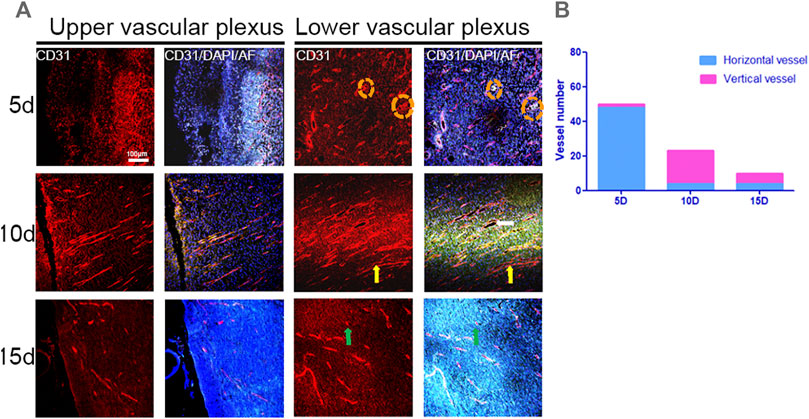
FIGURE 9. IF images of CD31 and statistical graphs of blood vessels in the longitudinal plane in the center of the wound. (A) IF images of superficial and deep dermal vessels at different times during wound healing (red: CD31, blue: DAPI, green: autofluorescence, yellow arrows: vertical vessels, green arrows: orange, and dotted circles: thick vessels). (B) Number of blood vessels.
Using the aforementioned various optical imaging methods, the angiogenesis in the process of wound healing was observed with the rat model. In the process, it has three main stages for angiogenesis: the proliferation stage, the remodeling stage, and the regression stage.
Discussion
The skin wound healing process is complex and consists mainly of four stages: hemostasis, inflammatory, proliferative, and remodeling. There is no obvious time boundary between the four stages. The formation of skin tissue begins with re-epithelialization and the migration of the epidermis over the granulation tissue from the wound edge to the wound center, and angiogenesis in the granulation tissue provides nutrients at the same time. Therefore, these two aspects are important targets for drug development. In order to obtain more pharmacological action data, several modern pharmacological studies on promoting re-epithelialization and angiogenesis during wound healing have been developed to observe these two processes separately [27, 28]. But most of the experimental data were obtained by endpoint measurement and cannot simultaneously observe the morphology of new capillaries and thickened epidermal cells in vivo, which many real-time and dynamic biological features are lost, so the drug activity cannot be accurately assessed. Therefore, a new noninvasive dynamic monitoring method is needed for rapid drug screening for wound healing.
Wound closure through re-epithelialization is the key process in wound healing. With increasing granulation tissue depth [2], both the thickness and length of border epithelial cells are constantly changing [3]. Dermis-derived fibroblasts build up granulation tissue over which the epidermis migrates [1]. The essence of wound healing is epidermal migration and purse-string contraction at the edge of the wound, where basal epidermal cells accumulate on top of each other to transform monolayers into multilayers. This study, showed that epidermal cells accumulated at the edge of the wound and migrated inward, thus shrinking the injury area. LDA, LSCI, and MED combined with Masson and HE staining were used to observe the morphology of the thickened and stacked epithelial cells at the edge of the wound from the horizontal and vertical planes (Figure 10B). New capillaries at the outer edge of the thickened epidermal cells grew toward the center of the wound. This is consistent with the recovery of the capillaries in the wound, that is, the new capillaries around the edge of the wound will grow toward the wound from the normal region. While many studies have observed the process of re-epithelialization, most of them have only used in vitro methods, and we applied in vivo optical imaging to track this particular structure. However, there was no method to observe the new capillary formation and thickened epidermal cells at the same time, as well as to identify their spatial relationship. In this study, we observed new capillaries located outside of thickened epidermal cells, which contributes to the location of the new capillaries by in vivo optical imaging. Full-thickness skin excision was performed in different parts of the back of the rat, and wound healing was different [29]. To choose the most suitable location for observation, we used LSCI and LDA to analyze blood perfusion and vascular morphology in the upper, middle, and lower regions of the rat back, and skin thickness by optical coherence tomography. The results indicated that there was a uniform epidermis, dense blood vessels, and high blood perfusion in the middle region of the rat’s back, which was a suitable region for experimental modeling and observation.
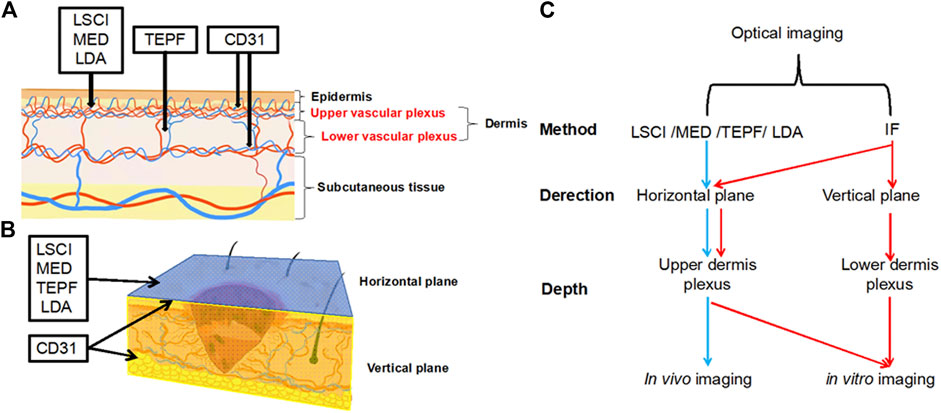
FIGURE 10. (A) Schematic diagram of the vertical plane of skin vessels (the black line indicates the penetration depth). (B) Three-dimensional diagram of the wound on the skin (the blue part represents the horizontal plane, and the yellow section represents the vertical plane). (C) Summary of optical imaging methods.
In wound healing, the growth of capillaries provides the necessary nutrients for the growth, metabolism, migration and survival of various cells and plays an irreplaceable role [29]. A large number of studies [30–32] have proved that the skin microcirculatory system was the characteristics of three-dimensional construction, which was formed by five layers of capillaries from the shallow layer to deep layer according to morphological characteristics. Therefore, a quantitative, multiperspective, and multilevel assessment system should be built [7]. The morphology of blood vessels and blood perfusion are extremely important indicators for evaluating angiogenesis. In this study, optical imaging including LDA, LSCI, MED, and TPEF was used to perform a quantitative analysis of the horizontal plane of blood vessel morphology and blood perfusion on the back of the rat. HE, Masson, and immunofluorescence staining were also used to perform a quantitative analysis of the morphology of blood vessels in the vertical plane of the skin wound (Figure 10B). Various optical imaging methods had their own unique advantages and can be combined to achieve complementary advantages. We roughly divided the applied optical imaging methods into two categories: one was in vivo imaging from the horizontal plane, and the observation depth was the upper level of the dermis; for this, the applied optical methods are LSCI, MED, TEPF, and LDA. The other was to use IF staining for in vitro imaging from horizontal and vertical planes, and the observation depth was the entire dermis, including the upper and lower dermis, as shown in Figure 10A,C. First of all, LSCI and MED were used for macro-observation for in vivo imaging at the horizontal plane. The advantage of LSCI was the macroscopic statistics of blood perfusion and vessel diameter in different parts, but it was not suitable for accurate measurement, especially for the measurement of microvessels smaller than 2 μm [33]. The split channel function was used to segment the three RGB channels of the LSCI image, which could accurately assess the blood flow of functional vessels. The advantage of MED was non-invasive and low-cost in vivo imaging [34], but it was limited to providing a magnified view of the skin surface and cannot perform quantitative statistics. But if the microscopic observation was needed to observe the specific morphology of blood vessels and count the diameter of microvessels, TPEF and LDA were better choices. TPEF was used to accurately measure the diameter of the blood vessel and to evaluate statistical errors [35]. Its advantage was the microscopic observation of the path and shape, especially the measurement of microvessels with a diameter of less than 2 μm, and hair follicles could be seen surrounded by blood vessels, which complemented the insufficiency of LSCI in measuring the diameter of blood vessels. The LDA was used to analyze the flow of the microvascular bifurcation [36]. However, our study was the first to observe the capillary network below the dermal papilla at the junction of the dermal papilla layer and the reticular layer and the surrounding hair follicles using LDA. This study broadened the application of the LDA and established methods that could quantitatively assess the number of capillary networks, and nodes could be calculated by software to represent the density of the capillaries. In the process of angiogenesis, in addition to the density of blood vessels, the growth direction and regularity also characterized the recovery. In this study, immunofluorescence staining was used for in vitro imaging. We classified blood vessels due to inconsistent paths and shapes of vessels on the same vertical plane slice. In CD31 immunofluorescence staining [37], vessels were divided into horizontal and vertical blood vessels to count in both superficial and deep layers of the dermis because the path and shape of blood vessels are inconsistent at the same vertical plane slices.
In conclusion, this study demonstrated the advantages of various optical imaging methods in observing angiogenesis and blood flow statistics and established a horizontal and longitudinal evaluation system of the skin microcirculation system. Briefly, LSCI, LDA, MED, and IF staining were used for observation and angiogenesis statistics, and TPEF was used for microscopic morphological observations to identify the edge of the wound and accurately locate the position of the new capillaries. In this study, on the one hand, a variety of optical imaging techniques complemented each other’s advantages and were combined to perform dermal blood vessel classification and counting; it was also used to observe cells and capillaries simultaneously, which has not been realized in previous studies. On the other hand, combined in vivo and in vitro studies were used to observe the growth direction of new blood vessels in the wound center and around the wound during the wound healing process; the vessels in the center were vertical to the surface of the wound, and the vessels in the surrounding area were horizontal to the wound (Figure 11). However, this study lacked the three-dimensional structural analysis of capillary morphology during wound healing. Therefore, in the following studies, we will focus on the interaction between the microcirculatory systems of different layers of the skin and apply this method to the pharmacological evaluation of wound healing drugs.
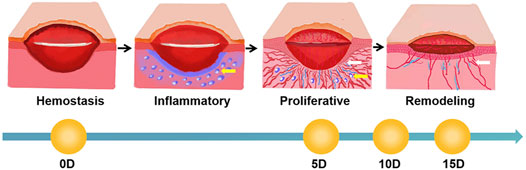
FIGURE 11. Schematic diagram of the wound healing process (white arrows mark new blood vessels, and blue circles indicated by yellow arrows mark areas of inflammation).
Data Availability Statement
The original contributions presented in the study are included in the article/Supplementary Material; further inquiries can be directed to the corresponding authors.
Ethics Statement
The animal study was reviewed and approved by the research ethics committee of the China Academy of Chinese Medical Sciences (ERCCACMS-2106-13).
Author Contributions
Conception and design: YS and YW. Drafting the manuscript: LL and YS. Writing - Review and Editing: HH. Optical coherence tomography, imaging analysis, and model investigation: LL. Operating the two-photon fluorescence microscope: YS. 3D image analysis: SM. Laser Doppler anemometer and laser speckle observation: GH. Staining: WY.
Funding
This work was supported by the Fundamental Research Funds for the Central Public Welfare Research Institutes (JBGS2021007, ZZ13-YQ-077, and XTCX2021002), the National Natural Science Foundation of Beijing, China (7192141), the National Key Research and Development Program of China (No. 2019YFC1709305), and the National Natural Science Foundation of China (81603285).
Conflict of Interest
The authors declare that the research was conducted in the absence of any commercial or financial relationships that could be construed as a potential conflict of interest.
The authors declare that this study received review from Dr. Yong Zhou from Shenzhen Maidu Technology Inc.. Dr Yong Zhou had the following involvement in the study: writing-review.
Publisher’s Note
All claims expressed in this article are solely those of the authors and do not necessarily represent those of their affiliated organizations, or those of the publisher, the editors, and the reviewers. Any product that may be evaluated in this article, or claim that may be made by its manufacturer, is not guaranteed or endorsed by the publisher.
Acknowledgments
We appreciate Dr Yong Zhou from Shenzhen Maidu Technology Inc., for his help in writing—review.
References
1. Amar MB, Wu M. Re-epithelialization: Advancing Epithelium Frontier during Wound Healing. J R Soc Interf (2014) 11:20131038. doi:10.1098/rsif.2013.1038
2. Armstrong MT, Turlo K, Elges CJ, Dayton SM, Lee J, Armstrong PB. A Novel Form of Epithelial Wound Healing of the Embryonic Epidermis. Exp Cel Res (2006) 312:2415–23. doi:10.1016/j.yexcr.2006.04.006
3. Xie L, Yang C, He Y, Zhou M, Liu K. Research Progress on Epithelial-Mesenchymal Transition and Wound Healing. Oral Biomed (2014) 5:202–5.
4. Barnhill RL, Wolf JE Angiogenesis and the Skin. J Am Acad Dermatol (1987) 16:1226–42. doi:10.1016/s0190-9622(87)70161-3
6. Dipietro LA. Angiogenesis and Scar Formation in Healing Wounds. Curr Opin Rheumatol (2013) 25:87–91. doi:10.1097/bor.0b013e32835b13b6
7. Rico-Jimenez J, Lee JH, Alex A, Musaad S, Chaney E, Barkalifa R, et al. Non-invasive Monitoring of Pharmacodynamics during the Skin Wound Healing Process Using Multimodal Optical Microscopy. BMJ Open Diabetes Res Care (2020) 8:974. doi:10.1136/bmjdrc-2019-000974
8. Werner S, Krieg T, Smola H. Keratinocyte-fibroblast Interactions in Wound Healing. J Invest Dermatol (2007) 127:998–1008. doi:10.1038/sj.jid.5700786
9. Wang H, Zhu Z, Li S, Guo J, Wang H. Transient Expanded Cell Proliferation and Skin Stem Cell Migration during Skin Wound Healing. Chin J Histochem Cytochem (2016) 25:328–34.
10. Guo A. Studies on Human Skin Dermal and Keratin Epithelial Cells and In Vivo Wound Models. Doctor. Guangzhou, China: Southern Medical University (2012).
11. Sainthillier J-M, Degouy A, Gharbi T, Pieralli C, Humbert P. Geometrical Capillary Network Analysis. Skin Res Technol (2003) 9:312–20. doi:10.1034/j.1600-0846.2003.00037.x
12. Zhong J, Asker CL, Salerud EG. Imaging, Image Processing and Pattern Analysis of Skin Capillary Ensembles. Skin Res Technol (2000) 6:45–57. doi:10.1034/j.1600-0846.2000.006002045.x
13. Dunn L, Prosser HC, Tan JT, Vanags LZ, Ng MK, Bursill CA. Murine Model of Wound Healing. J Vis Exp (2013) e50265. doi:10.3791/50265
14. Kislevitz M, Akgul Y, Wamsley C, Hoopman J, Kenkel J. Use of Optical Coherence Tomography (OCT) in Aesthetic Skin Assessment-A Short Review. Lasers Surg Med (2020) 52:699–704. doi:10.1002/lsm.23219
15. Monnier J, Tognetti L, Miyamoto M, Suppa M, Cinotti E, Fontaine M, et al. In Vivo characterization of Healthy Human Skin with a Novel, Non‐invasive Imaging Technique: Line‐field Confocal Optical Coherence Tomography. J Eur Acad Dermatol Venereol (2020) 34:2914–21. doi:10.1111/jdv.16857
16. Chappell JC, Wiley DM, Bautch VL. How Blood Vessel Networks Are Made and Measured. Cells Tissues Organs (2012) 195:94–107. doi:10.1159/000331398
17. Vaz PG, Humeau-Heurtier A, Figueiras E, Correia C, Cardoso J. Laser Speckle Imaging to Monitor Microvascular Blood Flow: A Review. IEEE Rev Biomed Eng (2016) 9:106–20. doi:10.1109/rbme.2016.2532598
18. Zieger M, Kaatz M, Springer S, Riesenberg R, Wuttig A, Kanka M, et al. Multi‐wavelength, Handheld Laser Speckle Imaging for Skin Evaluation. Skin Res Technol (2021) 27:486–93. doi:10.1111/srt.12959
19. Sun Y, Zhao J, Li C, Liu Y, Li S, Chen H, et al. Observation of Transdermal Absorption of Human Collagen by Second Harmonic Combined with Two-Photon Fluorescence Imaging. J J Laser Biol (2017) 26:24–9. doi:10.3969/j.issn.1007-7146.2017.01.004
20. Guo Z, Ding H, Ying Z, Dong W, Bai B, Peng T. Three-dimensional Visualization of Human Skin Microvascular Architecture. J Chin Tissue Eng Res Clin Rehabil (2011) 15:653–6. doi:10.3969/j.issn.1673-8225.2011.04.019
21. He G, Tang J, Sun Y, Ma S, Yang W, Wang Y. Application of Two-Photon Imaging Technology in Acne Epidermal Inflammation Caused by Propionibacterium Acnes. J Daily Chem Industry (2020) 50:704–10. doi:10.3969/j.issn.1001-1803.2020.10.009
22. Wang Y, Bao J, Sheng X, Li P, Ma H. Observation of Different Types of Collagen in the Skin Using Optical Second Harmonic Imaging. J J Laser Biol (2005) 274–8. doi:10.3969/j.issn.1007-7146.2005.04.007
23. Figueiredo CC, Pereira NB, Pereira LX, Oliveira LAM, Campos PP, Andrade SP, et al. Double Immunofluorescence Labeling for CD31 and CD105 as a Marker for Polyether Polyurethane-Induced Angiogenesis in Mice. Histol Histopathol (2019) 34:257–64. doi:10.14670/HH-18-038
24. Delisser HM, Christofidou-Solomidou M, Strieter RM, Burdick MD, Robinson CS, Wexler RS, et al. Involvement of Endothelial PECAM-1/CD31 in Angiogenesis. Am J Pathol (1997) 151:671–7.
25. Li WW, Carter MJ, Mashiach E, Guthrie SD. Vascular Assessment of Wound Healing: a Clinical Review. Int Wound J (2017) 14:460–9. doi:10.1111/iwj.12622
26. Jacques SL. Optical Assessment of Cutaneous Blood Volume Depends on the Vessel Size Distribution: a Computer Simulation Study. J Biophotonics (2010) 3:75–81. doi:10.1002/jbio.200900085
27. Kim H, Wang SY, Kwak G, Yang Y, Kwon IC, Kim SH. Exosome‐Guided Phenotypic Switch of M1 to M2 Macrophages for Cutaneous Wound Healing. Adv Sci (2019) 6:1900513. doi:10.1002/advs.201900513
28. Hu Y, Rao S-S, Wang Z-X, Cao J, Tan Y-J, Luo J, et al. Exosomes from Human Umbilical Cord Blood Accelerate Cutaneous Wound Healing through miR-21-3p-Mediated Promotion of Angiogenesis and Fibroblast Function. Theranostics (2018) 8:169–84. doi:10.7150/thno.21234
29. Zhou, S, Wang, W, Zhou, S, Zhang, G, He J, Li Q. A Novel Model for Cutaneous Wound Healing and Scarring in the Rat. Plast Reconstr Surg (2019) 143:468–77. doi:10.1097/PRS.0000000000005274
30. Neubauer-Geryk J, Hoffmann M, Wielicka M, Piec K, Kozera G, Brzeziński M, et al. Current Methods for the Assessment of Skin Microcirculation: Part 2. pdia (2019) 36:377–81. doi:10.5114/ada.2019.83657
31. Braverman IM. The Cutaneous Microcirculation. J Invest Dermatol Symp Proc (2000) 5:3–9. doi:10.1046/j.1087-0024.2000.00010.x
32. Neubauer-Geryk J, Hoffmann M, Wielicka M, Piec K, Kozera G, Brzeziński M, et al. Current Methods for the Assessment of Skin Microcirculation: Part 1. pdia (2019) 36:247–54. doi:10.5114/ada.2019.83656
33. Postnov DD, Tuchin VV, Sosnovtseva O. Estimation of Vessel Diameter and Blood Flow Dynamics from Laser Speckle Images. Biomed. Opt. Expres (2016) 7:2759–68. doi:10.1364/BOE.7.002759
34. Deegan AJ, Wang RK. Microvascular Imaging of the Skin. Phys Med Biol (2019) 64:07TR01. doi:10.1088/1361-6560/ab03f1
35. Suzuki H, Sugashi T, Takeda H, Takuwa H, Kanno I, Masamoto K. Error Evaluation for Automated Diameter Measurements of Cerebral Capillaries Captured with Two-Photon Laser Scanning Fluorescence Microscopy. Adv Exp Med Biol (2021) 1269:241–5. doi:10.1007/978-3-030-48238-1_38
36. Mücke T, Ritschl LM, Balasso A, Wolff KD, Liepsch D. Flow Analyses of Microvascular Bifurcation Using Laser Doppler Anemometry. J Reconstr Microsurg. (2013). 29:399–406. doi:10.1055/s-0033-1343831
Keywords: optical coherence tomography, laser Doppler anemometer, laser speckle, dermoscopy, two-photon excited fluorescence microscopy, angiogenesis, skin wound healing
Citation: Li L, Sun Y, He H, He G, Ma S, Yang W and Wang Y (2022) Quantitative Assessment of Angiogenesis in Skin Wound Healing by Multi-Optical Imaging Techniques. Front. Phys. 10:894901. doi: 10.3389/fphy.2022.894901
Received: 12 March 2022; Accepted: 06 April 2022;
Published: 05 May 2022.
Edited by:
Chao He, University of Oxford, United KingdomReviewed by:
Yunxu Sun, Harbin Institute of Technology, Shenzhen, ChinaDanying Lin, Shenzhen University, China
Copyright © 2022 Li, Sun, He, He, Ma, Yang and Wang. This is an open-access article distributed under the terms of the Creative Commons Attribution License (CC BY). The use, distribution or reproduction in other forums is permitted, provided the original author(s) and the copyright owner(s) are credited and that the original publication in this journal is cited, in accordance with accepted academic practice. No use, distribution or reproduction is permitted which does not comply with these terms.
*Correspondence: Yanan Sun, ZHIuc3VueWFuYW5AZm94bWFpbC5jb20=; Yi Wang, cHJvZi53YW5neWlAZm94bWFpbC5jb20=