 Haeni Lee
 Seongyi Han
 Sinyoung Park
 Seonghee Cho2
 Jinwoo Yoo
 Chulhong Kim
 Jeesu Kim
- 1Departments of Cogno-Mechatronics Engineering and Optics and Mechatronics Engineering, Pusan National University, Busan, South Korea
- 2Departments of Convergence IT Engineering, Mechanical Engineering, and Electrical Engineering, School of Interdisciplinary Bioscience and Bioengineering, Medical Device Innovation Center, Pohang University of Science and Technology (POSTECH), Pohang, South Korea
- 3Department of Automobile and IT Convergence, Kookmin University, Seoul, South Korea
Photoacoustic imaging can be used to extract functional information at the molecular level for imaging the whole body of small animals in vivo. However, the use of a mechanical scanner to image the whole body involves acquiring the data for a period of time which can lead to breathing-related artifacts. Thus, the acquired three-dimensional data cannot be analyzed and visualized using two-dimensional projection rendering techniques unless the respiratory distortions are minimized. In this study, an ultrasound-guided breath-compensation method for the three-dimensional data of photoacoustic macroscopy to facilitate visualization and analysis in the depth direction is presented. Photoacoustic and ultrasound data of the whole body of mice were acquired in vivo, then the distorted skin layers were compensated in ultrasound data. The extracted distortion parameters were then applied to the corresponding photoacoustic data to compensate for the motion. The compensation method was successfully applied to visualize three-dimensional hemoglobin oxygen saturation in the whole body of mice in vivo by using multispectral photoacoustic data. The resulting three-dimensional images show that the developed methodology can be used in various biomedical studies, including monitoring drug delivery, imaging of tumors, and analysis of vasculature networks.
Introduction
Photoacoustic imaging (PAI) is currently attracting much attention in biomedical studies due to its unique ability to visualize functional information in biological tissues at the molecular level at ultrasound (US) resolution. PAI is derived from the photoacoustic (PA) effect, which is energy transduction from light to sound [1]. When a short-pulsed laser stimulates biological tissues, the endogenous chromophores (e.g., oxy-hemoglobin, deoxy-hemoglobin, water, melanin, and lipid) absorb the light energy, then transfer it to heat energy. The heat energy produces volumetric changes through thermoelastic expansion, generating acoustic waves (called PA waves) that propagate in all directions. The generated PA waves are detected by the conventional US transducer and reconstructed to form the PA image [2–6]. In addition to the endogenous chromophores, exogenous contrast agents also can be visualized in PAI [7–9].
Although PA and US images have similar data acquisition and image generation procedures, they provide different but complementary information on the underlying biological structure. The US imaging (USI) is based on the transmission and reflection of acoustic waves providing structural information, while PAI is based on optical absorption, representing functional information at the molecular level [10–12]. The two imaging modalities are typically implemented in a single imaging platform, especially in clinical applications [13–23], to complement each other facilitating better clinical outcomes.
PAI has a unique advantage in that the resolution and imaging depth can be scalable according to its application [24]. The two major types of PAI systems for preclinical application are PA microscopy (PAM) and PA computed tomography (PACT). PAM systems generally equip a single-element focused US transducer to acquire high-resolution images (lateral resolution of ∼5–50 μm) [25–27]. Those imaging systems have been utilized to visualize superficial areas in small animals including the ear [28], brain [29–32], and eye [33–35]. In addition to the shallow imaging depth (∼1–3 mm), one of the key issues in PAM is relatively slow imaging speed because of scanning of both the light and transducer to achieve images. In contrast, PACT systems can achieve images with faster imaging speed by using multi-element detection from various geometry of array transducers including linear, arc, and ring arrays [36–38]. The biodistribution of deep tissue in small animals has been investigated using various PACT systems [39–43]. However, the mathematical image reconstruction algorithms in PACT may generate artifacts, which degrade the quality of the resulting images. In addition, the high cost of the multi-element US array and corresponding multi-channel data acquisition (DAQ) module may burden the researchers.
The mechanical scanning-based PA macroscopic (PAMac) system is one of the initial configurations of PAI for small animal studies [44]. PAMac systems have been used for imaging the whole body of small animals at the organ level with imaging parameters in between PAM and PACT (depth, axial resolution, and lateral resolution of ∼20 mm, ∼150 μm, and 590 μm, respectively) [45–47]. The main applications were monitoring the biodistribution of various agents to investigate biological responses of drugs, nanomaterials, or contrast agents [48–50] in the whole body of living mice for drug delivery monitoring [51], therapeutic assessment [52], tumor imaging [53], gastrointestinal angiography [54], lymphography [55], and cystography [56].
For visualization purposes, the mechanical scanning-based PAMac usually suppresses down its three-dimensional (3D) imaging capability to two-dimensional (2D) projected images. The main reason for displaying 2D images is to avoid depth-related distortion that occurs due to respiratory movement during relatively long (typically 30–60 min for whole-body imaging [47, 57–59]) data acquisition time, which is due to the physical traveling time of a single-element US transducer in the mechanical scanning. For better 3D analysis and visualization, the respiratory-related motion artifacts along the depth direction should be compensated.
To compensate the motion distortion, several studies have been reported for mechanical scanning-based systems. Schwarz et al. compensated motion by detecting skin signals, which were generated by the melanin-containing layers in the skin [60]. Then, they corrected the distortions by smoothing the surface profile. Zhao, et al. proposed a respiratory compensation algorithm, which tracks enhanced vascular structures in high-resolution PA images [61]. The algorithm was successfully applied to rat iris imaging and mice skin imaging. Those methods showed feasibility for motion correction during the mechanical scan, but they require continuous PA signals for motion tracking. Since the PA signals are not generated from the optically transparent tissues, a method that does not rely on PA signals is required for robust motion compensation.
In this paper, the compensation of breathing distortion in 3D whole-body PA data of mice, acquired from the mechanical scanning-based PA and US macroscopy (PAUSMac) system, is demonstrated. The key approach for compensating the motion is the detection of the skin layer in the acquired images, which is often not apparent in PA images. If the skin layer can be detected using US images, where it is easy to identify and motion-compensated, the corresponding compensation can be applied to corresponding PA images to remove motion artifacts. To accomplish this, the recently reported dual-modal PAUSMac system was proposed to be used for whole-body imaging of small animals [62]. This system simultaneously acquires both PA and US data without increasing data acquisition time. The results also showed the potential of the dual-modal imaging system for reinforcing structural information, which can be achieved in USI, and ported onto PAI.
In the proposed method, the skin layers were segmented by using cross-sectional US B-mode data, then used for the distortion compensation in the depth direction. The corresponding distortions in PA data were corrected to achieve 3D images. The resulting images from the compensated data showed better depth-resolving quality compared to the previous images. The 3D distributions of hemoglobin oxygen saturation level (sO2) were also acquired by spectral unmixing of the multispectral data with correction of respiratory distortion. This technique will benefit biomedical research by providing more accurate information on both the anatomy and physiology of the underlying tissue, thus improving the outcome of the in vivo small animal studies.
Methods
Photoacoustic and Ultrasound Data Acquisition
The previously developed dual-modal PA and US imaging system, which can acquire both PA and US data simultaneously, was used for this study (Figure 1). In brief, Nd:YAG pumped Q-switch laser (Surelite III-10, Continuum, United States) generated a laser beam, whose wavelength was tuned by the optical parametric oscillator (OPO) laser system (Surelite OPO PLUS, Continuum, United States). The optical components delivered the laser beam to the target animals, which were placed underneath the bottom-opened water tank. The generated PA waves were detected by a single-element US transducer (V308, Olympus NDT, United States), captured by a pulser/receiver (5072PR, Olympus NDT, United States), stored by a data acquisition module (MSO 5204, Tektronix, United States), and reconstructed as images using Matlab-based custom software. The conventional US gel and membrane-sealed water tank were used to match the acoustic impedance between the US transducer and the target. The US data were acquired between each PA data acquisition. More details of the system can be found in our previous publication [62]. This study used multispectral lasers of wavelengths 750, 800, and 850 nm, with average fluences of 9, 7, and 7 mJ/cm2, respectively. A 60 × 32 mm2 scanning was performed to achieve whole-body images of mice with a step size of 0.2 mm in both x and y directions. The total data acquisition time was ∼100 min at each wavelength.
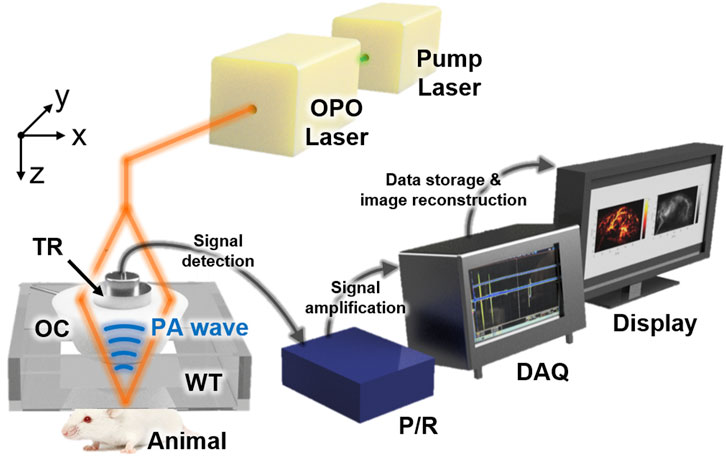
FIGURE 1. Schematic configuration of the dual-modal PA and US macroscopy system for whole-body imaging of mice in vivo. PA, photoacoustic; US, ultrasound; OPO, optical parametric oscillator; OC, optical condenser; TR, transducer; WT, water tank; P/R, pulser/receiver; DAQ, data acquisition module.
Ultrasound-Guided Breath-Compensation
A post-processing algorithm that automatically detects the distortion from respiratory movement during the scanning and compensates the distortion along the axial direction was developed (Figure 2A). Prior to the compensation, the conventional signal processing procedures (i.e., frequency demodulation, envelope detection, and interpolation) were applied to each A-line signal for generating images (Supplementary Figure S1). The breath-compensation algorithm was then applied to each cross-sectional B-mode data. The first step in the breath-compensation algorithm was the segmentation of the skin layer. From the US B-mode images, it was easy to segment the membranes (blue lines in Figure 2A) and skin layers (yellow lines in Figure 2A) using a simple thresholding method. After removing the membrane signal, a low-pass filter in the spatial domain was applied to smoothen skin layers (i.e., compensated skin layers, green lines in Figure 2A). Next, at each lateral point, the difference between the original and compensated skin surface was measured and applied to shift the original data in the axial direction. Through this shifting, the spiking distortions caused by respiratory movement (yellow arrows in Figure 2A) were compensated (green arrows in Figure 2B). The same shifting intervals were also applied to the corresponding PA data to compensate for breathing. Finally, breath-compensation was achieved for 3D PA and US data after repeating this procedure for every cross-sectional B-mode data (Figure 2B) using Matlab-based open-access software (3D PHOVIS, POSTECH, Republic of Korea) [63]. The accuracy of the resulting 3D images was verified by comparing them with anatomical positions from commercial software (3D Rat Anatomy, Biosphera, Brazil).
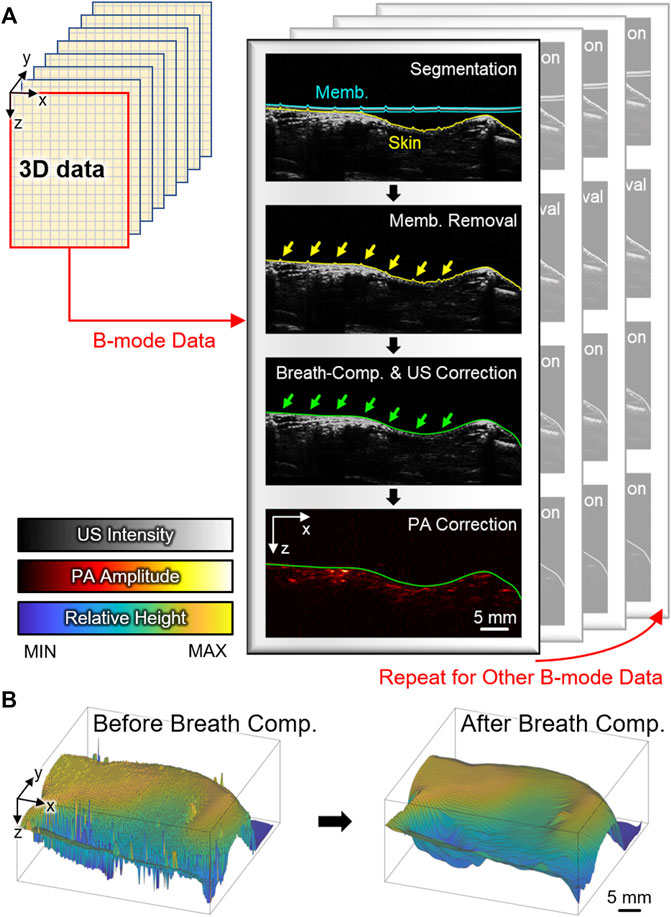
FIGURE 2. (A) Schematic illustration of the US-guided breath-compensation procedure. Blue, yellow, and green lines denote membrane, original skin, and corrected skin layers, respectively. Yellow and green arrows are respiratory distortions before and after correction. (B) Surface profile of the skin before and after breath-compensation. PA, photoacoustic; US, ultrasound; Memb., membrane; Comp., compensation.
Three-Dimensional Distribution of Hemoglobin Oxygen Saturation Level
For obtaining the 3D whole-body sO2 distribution in mice, multispectral PA and US data were acquired using excitation wavelengths of 750, 800, and 850 nm, which are deoxy-hemoglobin dominant, isosbestic, and oxy-hemoglobin dominant points, respectively [64]. The same procedure described in Figure 2 was applied to the acquired volumetric data. The breath-compensated skin profiles were achieved at each wavelength. For accurate sO2, we calculated the intervals between the reference profile to each skin profile, shifted the data to match the axial position, then spectrally unmixed oxy- and deoxy-hemoglobin components at each pixel of volumetric data. The breath-compensated skin profile at 750 nm was used as the reference profile. The relative sO2 level at each pixel was calculated by the conventional linear unmixing method [65, 66]. After smoothing the acquired volume by a 3D 3 × 3×15 median filter, which corresponds to 0.6 × 0.6 × 0.4 mm3 in x, y, and z directions, respectively, 3D distributions of sO2 level in the whole-body mice were calculated.
Animal Preparation
All animal experiments followed the protocol approved by the institutional animal care and use committee (IACUC) of the Pohang University of Science and Technology (POSTECH-2021-0052). Healthy 6-week-old female Balb/c nude mice (∼20 g) were used to acquire PA and US data. The fine hairs that generate distortion in data were removed using a conventional hair removal cream (Nair, Church & Dwight, United States). During the data acquisition, the mice were anesthetized using a vaporized isoflurane gas system with a mixture of 1 L/min oxygen and 0.75% isoflurane. The mice were placed under a membrane-sealed water tank. The acoustic impedance between the membrane and mice skin was coupled using a conventional ultrasound gel (Ecosonic, SANIPIA, South Korea). After in vivo imaging at the left sagittal view, the mice were sacrificed under anesthesia by using an overdose of carbon dioxide gas.
Results and Discussion
Breath-Compensated Whole-Body Images
After US-guided breath-compensation was applied to the 3D volume data, the rendered 3D images of both US and PA were generated (Supplementary Movies S1, S2). In the 3D rendered images, distortions are significantly reduced, and the accuracy of the depth-information is highly improved. In the conventional PAMac images, the volumetric data are projected onto the x-y plane using the maximum amplitude projection (MAP) method along with the whole range of depth of data to hide the respiratory distortions. The combined mean intensity projection (MIP) image of the US and MAP image of PA can visualize co-existing internal organs (e.g., intestine, spleen, and liver) and corresponding major blood vessels that match well with the anatomy (Figures 3A–C). However, the MAP or MIP projected images lose depth information of the signals.
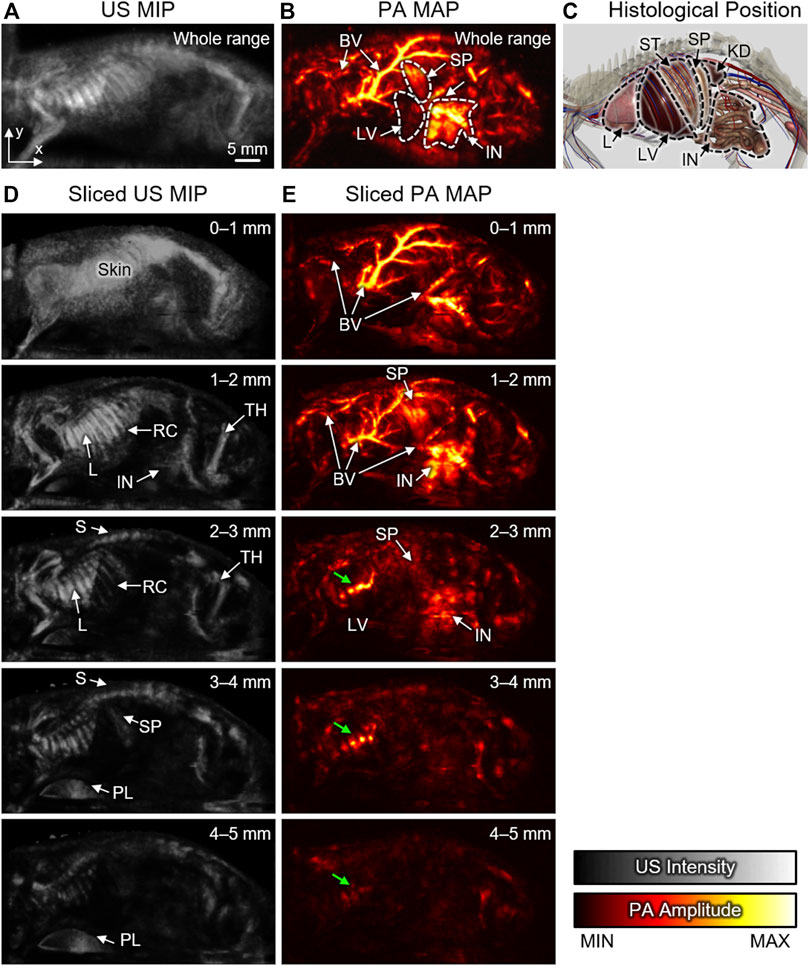
FIGURE 3. Sliced US MIP and PA MAP images from the left sagittal view with different ranges of depth. Whole-range (A) US MIP and (B) PA MAP images in the x-y plane. (C) Histological positions of organs captured from the 3D anatomy software. Sliced (D) US MIP and (E) PA MAP images from the sectioned layers at different ranges of depth. Green arrows denote reflection artifacts by the air in lung. US, ultrasound; PA, photoacoustic; MIP, mean intensity projection; MAP, maximum amplitude projection; 3D, three-dimensional; BV, blood vessel; L, Lung; LV, Liver; S, spine; ST, stomach; SP, spleen; IN, intestine; KD, kidney; RC, rib cage; TH, thigh; PL, plate.
Using the breath-compensation technique developed here, which utilizes the position of the skin surface to compensate for the motion, we can overcome this issue and can calculate the accurate depth of each signal. The sliced images can be obtained by sectioning the data at 1-mm intervals underneath the skin surface. In the sliced US MIP images, structural information is clearly visible at each depth (Figure 3D). Signals from the skin are dominant at the surface, but the internal anatomy and pathology can be visualized at subsequent deeper slices. More specifically, the rib cage, spine, and thigh are identifiable due to the strong reflection of US waves arising from the impedance mismatch between bone and soft tissues. The lung surface also generates strong signals because of impedance mismatch between the lung surface and air. The continuous changes in the sectioned US MIP images from the surface to the depth of 5 mm are shown in the Supplementary Material (Supplementary Movie S3).
The sliced PA MAP images show the optical absorption at each level (Figure 3E) of the volume along with the depth. The colormap used for displaying the blood flow in each image has the same dynamic range. Since the hemoglobin strongly absorbs light, the blood vessels are generally dominant in PA images. As the depth increases, optically absorbing organs, such as the spleen, intestine, and liver, also become visible. Since the PA waves propagate in all directions, the signals from the blood vessels are often reflected by the lung and appear as artifacts in the deep position (green arrows in Figure 3E). The continuous change in the sectioned PA MAP images is also demonstrated in the Supplementary Movie S4.
In addition to the x-y plane, we also successfully achieved PA MAP images in the x-z and y-z planes (Figure 4A) after compensating the distortions. Compared to the conventional landscape visualization of the x-y plane, depth information can be achieved in the other planes. In the x-z and y-z MAP images, the breath-compensation can be noticed after the removal of the respiratory distortion (white arrows in Figures 4B,C) in the compensated images. The cross-sectional B-mode images clearly show the distortion correction in both US and PA images (Figure 4D, the corresponding position in the 3D image is depicted as the green box in Figure 4A). The spiking respiratory motions (white arrows in Figure 4D) are successfully compensated. The results demonstrate the feasibility and effectiveness of our proposed US-guided breath-compensation technique for improving the quality of 3D information, especially for depth-related analysis.
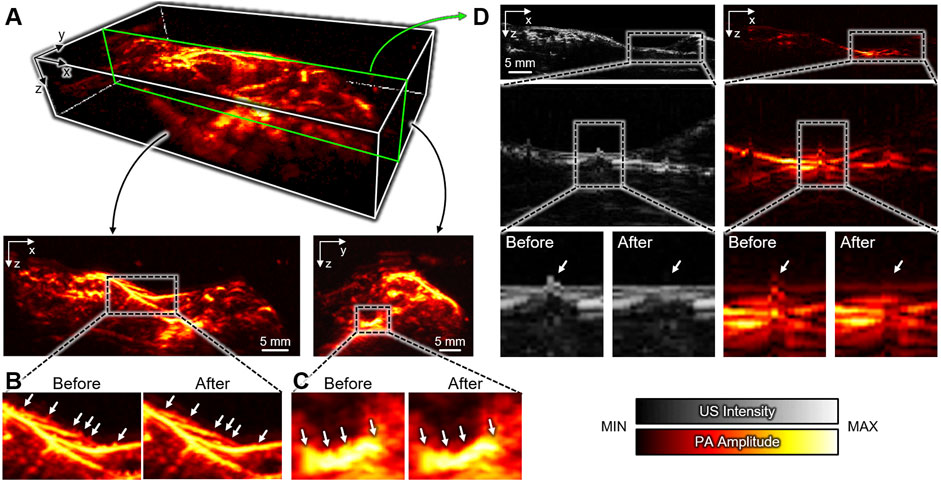
FIGURE 4. Breath-compensated PA images. (A) 3D whole-body PA image and MAP images at the x-z and y-z plates after US-guided breath-compensation. Respiratory distortions in the (B) x-z and (C) y-z planes before and after breath-compensation. (D) Representative cross-sectional B-mode PA and US images showing the correction of respiratory distortion. Insets show the enlarged images. The green box in (A) depicts the corresponding position in the 3D image. US, ultrasound; PA, photoacoustic; MAP, maximum amplitude projection.
Three-Dimensional Distribution of Hemoglobin Oxygen Saturation Level
Similar to other optical imaging techniques, PAI can also calculate the relative sO2 level in biological tissue by unmixing multispectral data. In the conventional PAMac, sO2 calculation is commonly performed using MAP images that are acquired at multiple excitation wavelengths (Figure 5A). However, since the maximum signals may not originate from the same depth, we cannot assume that the multispectral data for spectral unmixing arise from the same position. Thus, in conventional techniques, accurate sO2 calculation is limited due to the loss of depth information in the MAP images (Figure 5B).
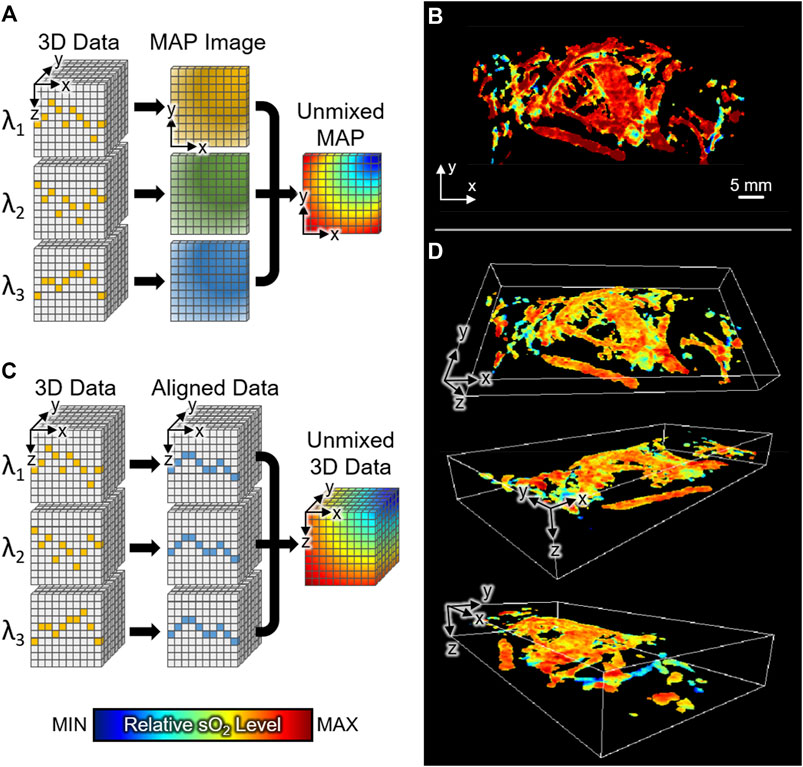
FIGURE 5. The relative sO2 distribution of whole-body mice in vivo. (A) Schematic illustration of conventional method for calculating relative sO2 level in PAMac. (B) MAP image of sO2 distribution with conventional spectral unmixing. (C) Schematic illustration of the proposed 3D unmixing method. (D) 3D distribution of whole-body sO2 level at various angles of view. sO2, hemoglobin oxygen saturation; 3D, three-dimensional; MAP, maximum amplitude projection.
In this study, through breath-compensation at each excitation wavelength, we successfully obtained 3D sO2 levels in the whole body of mice in vivo. Compared to the conventional PAMac studies, we performed spectral unmixing of oxy- and deoxy-hemoglobins before the MAP procedure (Figure 5C). We could then preserve the depth information of each data and match the axial position by shifting signals to the reference skin profile (described in the Method section). We achieved 3D distribution of whole-body sO2 level at various view angles (Figure 5D). The resulting 3D sO2 distribution shows the depth-wise functional information, which otherwise cannot be achieved using conventional techniques. The 3D visualization of relative sO2 distribution is also made available in the Supplementary Material (Supplementary Movie S5).
Conclusion
The mechanical scanning-based PAMac has been used in biomedical studies for analyzing the whole body of small animals in vivo. However, the mechanical scanning leads to a long data acquisition time, thus resulting in respiratory distortion in the depth direction of the acquired volume. With the distortions, it is difficult to visualize the 3D volumetric data in conventional PAMac. As an alternative, landscape MAP images have typically been used for the visualization of signal distribution. Although landscape MAP images are helpful in analyzing functional information distributed in the whole body of mice, they do not provide positions of signals in the depth direction, which are essential for accurate signal processing and visualization.
Here, we have successfully demonstrated a US-guided breath-compensation technique for the 3D visualization of mechanical scanning-based PAMac. We acquired PA and US data from the whole body of mice in vivo by using the previously developed dual-modal imaging system. Using the structural information in the cross-sectional US images, we successfully corrected respiratory distortions in the axial direction for both US and PA images. The successful 3D visualizations of the volumetric data showed the great potential of this technique for investigating the 3D distribution of optical contrast in vivo. The 3D whole-body sO2 level was also calculated at each pixel after compensating respiratory movements. To the best of our knowledge, this is the first report that presents 3D whole-body sO2 levels using PAMac.
The key procedure in the proposed breath-compensation method is detecting skin profiles with US data. The US signals are always generated from the skin surface due to the mismatching of acoustic impedance between skin and water medium. Therefore, the proposed method is not limited depending on the presence or absence of a PA signal. We expect that the US-guided breath-compensation method presented here will open new opportunities to visualize the comprehensive distribution of optical chromophores in various biomedical studies, including drug delivery monitoring, clearance assessment, lymphatic network mapping, and blood vessel imaging. In the near future, we plan to expand the use of the technique into many other areas as listed above.
Data Availability Statement
The raw data supporting the conclusions of this article will be made available by the authors, without undue reservation.
Ethics Statement
The animal study was reviewed and approved by the Institutional Animal Care and Use Committee (IACUC) of the Pohang University of Science and Technology.
Author Contributions
HL, SH, and SP modified, optimized, and managed the dual-modal PA and US imaging system. They also designed and performed all the experiments, collected raw data, analyzed the data, developed the breath-compensation algorithm, and wrote the manuscript. JY optimized the breath-compensation algorithm. SC finalized the 3D figures for the manuscript. CK and JK conceived and supervised the project, designed experiments, interpreted data, and wrote the manuscript. All authors contributed to the critical reading and writing of the manuscript.
Funding
This work was supported by the National Research Foundation (NRF) grants (2021R1A5A1032937; 2019R1A2C2006269; 2020R1C1C1013549; 2020R1A6A1A03047902; 2021M3C1C3097624), the Korea Institute for Advancement of Technology (KIAT) grant (P0008763), the Commercialization Promotion Agency (COMPA) grant for R&D outcomes (1711123345), and BK21 FOUR projects (Pusan National University; Pohang University of Science and Technology) funded by the Korean government (the Ministry of Science and ICT; the Ministry of Education; the Ministry of Trade, Industry and Energy).
Conflict of Interest
The authors declare that the research was conducted in the absence of any commercial or financial relationships that could be construed as a potential conflict of interest.
Publisher’s Note
All claims expressed in this article are solely those of the authors and do not necessarily represent those of their affiliated organizations, or those of the publisher, the editors and the reviewers. Any product that may be evaluated in this article, or claim that may be made by its manufacturer, is not guaranteed or endorsed by the publisher.
Supplementary Material
The Supplementary Material for this article can be found online at: https://www.frontiersin.org/articles/10.3389/fphy.2022.894837/full#supplementary-material
References
2. Kim C, Favazza C, Wang LV. In Vivo Photoacoustic Tomography of Chemicals: High-Resolution Functional and Molecular Optical Imaging at New Depths. Chem Rev (2010) 110(5):2756–82. doi:10.1021/cr900266s
3. Yang J, Choi S, Kim C. Practical Review on Photoacoustic Computed Tomography Using Curved Ultrasound Array Transducer. Biomed Eng Lett (2022) 12:19–35. doi:10.1007/s13534-021-00214-8
4. Jeon S, Choi W, Park B, Kim C. A Deep Learning-Based Model that Reduces Speed of Sound Aberrations for Improved In Vivo Photoacoustic Imaging. IEEE Trans Image Process (2021) 30:8773–8784. doi:10.1109/TIP.2021.3120053
5. Cho S-W, Park SM, Park B, Kim DY, Lee TG, Kim B-M, et al. High-Speed Photoacoustic Microscopy: A Review Dedicated on Light Sources. Photoacoustics (2021) 24, 100291. doi:10.1016/j.pacs.2021.100291
6. Fadhel MN, Hysi E, Zalev J, Kolios MC. Photoacoustic Simulations of Microvascular Bleeding: Spectral Analysis and its Application for Monitoring Vascular-Targeted Treatments. J Biomed Opt (2019) 24(11):1. doi:10.1117/1.JBO.24.11.116001
7. Park B, Lee KM, Park S, Yun M, Choi H-J, Kim J, et al. Deep Tissue Photoacoustic Imaging of Nickel(II) Dithiolene-Containing Polymeric Nanoparticles in the Second Near-Infrared Window. Theranostics (2020) 10(6):2509–21. doi:10.7150/thno.39403
8. Park S, Park G, Kim J, Choi W, Jeong U, Kim C. Bi2Se3 Nanoplates for Contrast-Enhanced Photoacoustic Imaging at 1064 Nm. Nanoscale (2018) 10(44), 20548. doi:10.1039/C8NR05672B
9. Chitgupi U, Nyayapathi N, Kim J, Wang D, Sun B, Li C, et al. Surfactant‐Stripped Micelles for NIR‐II Photoacoustic Imaging through 12 Cm of Breast Tissue and Whole Human Breasts. Adv Mater (2019) 31(40), 1902279. doi:10.1002/adma.201902279
10. Baik JW, Kim H, Son M, Choi J, Kim KG, Baek JH, et al. Intraoperative Label‐Free Photoacoustic Histopathology of Clinical Specimens. Laser Photon Rev (2021) 15(10), 2100124. doi:10.1002/lpor.202100124
11. Ahn J, Kim JY, Choi W, Kim C. High-Resolution Functional Photoacoustic Monitoring of Vascular Dynamics in Human Fingers. Photoacoustics (2021) 23, 100282. doi:10.1016/j.pacs.2021.100282
12. Park J, Park B, Kim TY, Jung S, Choi WJ, Ahn J, et al. Quadruple Ultrasound, Photoacoustic, Optical Coherence, and Fluorescence Fusion Imaging with a Transparent Ultrasound Transducer. Proc Natl Acad Sci U.S.A (2021) 118(11), e1920879118. doi:10.1073/pnas.1920879118
13. Kim J, Park S, Jung Y, Chang S, Park J, Zhang Y, et al. Programmable Real-Time Clinical Photoacoustic and Ultrasound Imaging System. Sci Rep (2016) 6, 35137. doi:10.1038/srep35137
14. Kim J, Park E-Y, Park B, Choi W, Lee KJ, Kim C. Towards Clinical Photoacoustic and Ultrasound Imaging: Probe Improvement and Real-Time Graphical User Interface. Exp Biol Med (2020) 245(4):321–9. doi:10.1177/1535370219889968
15. Kim J, Kim YH, Park B, Seo H-M, Bang CH, Park GS, et al. Multispectral Ex Vivo Photoacoustic Imaging of Cutaneous Melanoma for Better Selection of the Excision Margin. Br J Dermatol (2018) 179(3):780–2. doi:10.1111/bjd.16677
16. Park B, Bang CH, Lee C, Han JH, Choi W, Kim J, et al. 3D Wide‐field Multispectral Photoacoustic Imaging of Human Melanomas In Vivo : a Pilot Study. J Eur Acad Dermatol Venereol (2020) 35(3):669–76. doi:10.1111/jdv.16985
17. Kim J, Park B, Ha J, Steinberg I, Hooper SM, Jeong C, et al. Multiparametric Photoacoustic Analysis of Human Thyroid Cancers In Vivo. Cancer Res (2021) 81(18):4849–60. doi:10.1158/0008-5472.CAN-20-3334
18. Attia ABE, Balasundaram G, Moothanchery M, Dinish US, Bi R, Ntziachristos V, et al. A Review of Clinical Photoacoustic Imaging: Current and Future Trends. Photoacoustics (2019) 16, 100144. doi:10.1016/j.pacs.2019.100144
19. Attia ABE, Chuah SY, Razansky D, Ho CJH, Malempati P, Dinish US, et al. Noninvasive Real-Time Characterization of Non-melanoma Skin Cancers with Handheld Optoacoustic Probes. Photoacoustics (2017) 7:20–6. doi:10.1016/j.pacs.2017.05.003
20. Luís Deán-Ben X, Razansky D. Adding Fifth Dimension to Optoacoustic Imaging: Volumetric Time-Resolved Spectrally Enriched Tomography. Light Sci Appl (2014) 3(1):e137. doi:10.1038/lsa.2014.18
21. Heijblom M, Steenbergen W, Manohar S. Clinical Photoacoustic Breast Imaging: The Twente Experience. IEEE Pulse (2015) 6(3):42–6. doi:10.1109/MPUL.2015.2409102
22. Razansky D, Buehler A, Ntziachristos V. Volumetric Real-Time Multispectral Optoacoustic Tomography of Biomarkers. Nat Protoc (2011) 6(8):1121–9. doi:10.1038/nprot.2011.351
23. Kruger RA, Lam RB, Reinecke DR, Del Rio SP, Doyle RP. Photoacoustic Angiography of the Breast. Med Phys (2010) 37(11):6096–100. doi:10.1118/1.3497677
24. Wang LV, Hu S. Photoacoustic Tomography: In Vivo Imaging from Organelles to Organs. Science (2012) 335(6075):1458–62. doi:10.1126/science.1216210
25. Maslov K, Stoica G, Wang LV. In Vivo dark-field Reflection-Mode Photoacoustic Microscopy. Opt Lett (2005) 30(6):625–7. doi:10.1364/OL.30.000625
26. Hu S, Maslov K, Wang LV. Second-Generation Optical-Resolution Photoacoustic Microscopy with Improved Sensitivity and Speed. Opt Lett (2011) 36(7):1134–6. doi:10.1364/OL.36.001134
27. Maslov K, Zhang HF, Hu S, Wang LV. Optical-Resolution Photoacoustic Microscopy for In Vivo Imaging of Single Capillaries. Opt Lett (2008) 33(33), 929. doi:10.1364/OL.33.000929
28. Bi R, Dinish US, Goh CC, Imai T, Moothanchery M, Li X, et al. In Vivo label‐free Functional Photoacoustic Monitoring of Ischemic Reperfusion. J Biophotonics (2019) 12(7), e201800454. doi:10.1002/jbio.201800454
29. Hu S, Maslov K, Tsytsarev V, Wang LV. Functional Transcranial Brain Imaging by Optical-Resolution Photoacoustic Microscopy. J Biomed Opt (2009) 14(4), 040503. doi:10.1117/1.3194136
30. Chen Q, Xie H, Xi L. Wearable Optical Resolution Photoacoustic Microscopy. J Biophotonics (2019) 12(8), e201900066. doi:10.1002/jbio.201900066
31. Liu Y, Yang X, Gong H, Jiang B, Wang H, Xu G, et al. Assessing the Effects of Norepinephrine on Single Cerebral Microvessels Using Optical-Resolution Photoacoustic Microscope. J Biomed Opt (2013) 18(7), 076007. doi:10.1117/1.JBO.18.7.076007
32. Qin W, Jin T, Guo H, Xi L. Large-Field-of-View Optical Resolution Photoacoustic Microscopy. Opt Express (2018) 26(4):4271–8. doi:10.1364/OE.26.004271
33. Liu W, Schultz KM, Zhang K, Sasman A, Gao F, Kume T, et al. In Vivo corneal Neovascularization Imaging by Optical-Resolution Photoacoustic Microscopy. Photoacoustics (2014) 2(2):81–6. doi:10.1016/j.pacs.2014.04.003
34. Liu W, Zhang HF. Photoacoustic Imaging of the Eye: A Mini Review. Photoacoustics (2016) 4(3):112–23. doi:10.1016/j.pacs.2016.05.001
35. Silverman RH, Kong F, Chen YC, Lloyd HO, Kim HH, Cannata JM, et al. High-Resolution Photoacoustic Imaging of Ocular Tissues. Ultrasound Med Biol (2010) 36(5):733–42. doi:10.1016/j.ultrasmedbio.2010.02.006
36. Li C, Aguirre A, Gamelin J, Maurudis A, Zhu Q, Wang LV. Real-Time Photoacoustic Tomography of Cortical Hemodynamics in Small Animals. J Biomed Opt (2010) 15(1), 010509. doi:10.1117/1.3302807
37. Brecht H-P, Su R, Fronheiser M, Ermilov SA, Conjusteau A, Oraevsky AA. Whole-Body Three-Dimensional Optoacoustic Tomography System for Small Animals. J Biomed Opt (2009) 14(6), 064007. doi:10.1117/1.3259361
38. Xia J, Chatni MR, Maslov K, Guo Z, Wang K, Anastasio M, et al. Whole-Body Ring-Shaped Confocal Photoacoustic Computed Tomography of Small Animals In Vivo. J Biomed Opt (2012) 17(5):050506-3. doi:10.1117/1.JBO.17.5.050506
39. Ho CJH, Balasundaram G, Driessen W, McLaren R, Wong CL, Dinish US, et al. Multifunctional Photosensitizer-Based Contrast Agents for Photoacoustic Imaging. Sci Rep (2014) 4(1):1–6. doi:10.1038/srep05342
40. Dinish US, Song Z, Ho CJH, Balasundaram G, Attia ABE, Lu X, et al. Single Molecule with Dual Function on Nanogold: Biofunctionalized Construct for In Vivo Photoacoustic Imaging and SERS Biosensing. Adv Funct Mater (2015) 25(15):2316–25. doi:10.1002/adfm.201404341
41. Gerling M, Zhao Y, Nania S, Norberg KJ, Verbeke CS, Englert B, et al. Real-Time Assessment of Tissue Hypoxia In Vivo with Combined Photoacoustics and High-Frequency Ultrasound. Theranostics (2014) 4(6):604–13. doi:10.7150/thno.7996
42. Lakshman M, Needles A. Screening and Quantification of the Tumor Microenvironment with Micro-ultrasound and Photoacoustic Imaging. Nat Methods (2015) 12(4):iii–v. doi:10.1038/nmeth.f.381
43. Li L, Zhu L, Ma C, Lin L, Yao J, Wang L, et al. Single-Impulse Panoramic Photoacoustic Computed Tomography of Small-Animal Whole-Body Dynamics at High Spatiotemporal Resolution. Nat Biomed Eng (2017) 1(5):1–11. doi:10.1038/s41551-017-0071
44. Zhang HF, Maslov K, Stoica G, Wang LV. Functional Photoacoustic Microscopy for High-Resolution and Noninvasive In Vivo Imaging. Nat Biotechnol (2006) 24(7):848–51. doi:10.1038/nbt1220
45. Song KH, Wang LV. Deep Reflection-Mode Photoacoustic Imaging of Biological Tissue. J Biomed Opt (2007) 12(6):060503–3. doi:10.1117/1.2818045
46. Song KH, Wang LV. Noninvasive Photoacoustic Imaging of the Thoracic Cavity and the Kidney in Small and Large Animals. Med Phys (2008) 35(10):4524–9. doi:10.1118/1.2977534
47. Jeon M, Kim J, Kim C. Multiplane Spectroscopic Whole-Body Photoacoustic Imaging of Small Animals In Vivo. Med Biol Eng Comput (2016) 54:283–94. doi:10.1007/s11517-014-1182-6
48. Jeong WY, Kang MS, Lee H, Lee JH, Kim J, Han D-W, et al. Recent Trends in Photoacoustic Imaging Techniques for 2D Nanomaterial-Based Phototherapy. Biomedicines (2021) 9(1):80. doi:10.3390/biomedicines9010080
49. Kim J, Park S, Lee C, Kim JY, Kim C. Organic Nanostructures for Photoacoustic Imaging. ChemNanoMat (2015) 2(3):156–66. doi:10.1002/cnma.201500171
50. Fadhel MN, Appak Baskoy S, Wang Y, Hysi E, Kolios MC. Use of Photoacoustic Imaging for Monitoring Vascular Disrupting Cancer Treatments. J Biophotonics (2020), e202000209 [Epub ahead of print]. doi:10.1002/jbio.202000209
51. Lee D, Beack S, Yoo J, Kim S-K, Lee C, Kwon W, et al. In Vivo Photoacoustic Imaging of Livers Using Biodegradable Hyaluronic Acid-Conjugated Silica Nanoparticles. Adv Funct Mater (2018) 28(22), 1800941. doi:10.1002/adfm.201800941
52. Lee M-Y, Lee C, Jung HS, Jeon M, Kim KS, Yun SH, Biodegradable Photonic Melanoidin for Theranostic Applications. ACS Nano (2015) 10:822–31. doi:10.1021/acsnano.5b05931
53. Jung H, Park S, Gunassekaran GR, Jeon M, Cho Y-E, Baek M-C A Peptide Probe Enables Photoacoustic-Guided Imaging and Drug Delivery to Lung Tumors in K-rasLA2 Mutant Mice. Cancer Res (2019) 79(16):4271-4282. doi:10.1158/0008-5472.can-18-3089
54. Zhang Y, Jeon M, Rich LJ, Hong H, Geng J, Zhang Y, et al. Non-Invasive Multimodal Functional Imaging of the Intestine with Frozen Micellar Naphthalocyanines. Nat Nanotech (2014) 9(8):631–8. doi:10.1038/nnano.2014.130
55. Lee C, Kim J, Zhang Y, Jeon M, Liu C, Song L, et al. Dual-Color Photoacoustic Lymph Node Imaging Using Nanoformulated Naphthalocyanines. Biomaterials (2015) 73:142–8. doi:10.1016/j.biomaterials.2015.09.023
56. Park S, Kim J, Jeon M, Song J, Kim C. In Vivo Photoacoustic and Fluorescence Cystography Using Clinically Relevant Dual Modal Indocyanine Green. Sensors (2014) 14(10), 19660. doi:10.3390/s141019660
57. Moothanchery M, Pramanik M. Performance Characterization of a Switchable Acoustic Resolution and Optical Resolution Photoacoustic Microscopy System. Sensors (2017) 17(2):357. doi:10.3390/s17020357
58. Periyasamy V, Das N, Sharma A, Pramanik M. 1064 Nm Acoustic Resolution Photoacoustic Microscopy. J Biophotonics (2019) 12(5), e201800357. doi:10.1002/jbio.201800357
59. Luo X, Li X, Wang C, Pang W, Wang B, Huang Z. Acoustic-Resolution-Based Photoacoustic Microscopy with Non-coaxial Arrangements and a Multiple Vertical Scan for High Lateral Resolution In-Depth. Appl Opt (2019) 58(33):9305–9. doi:10.1364/AO.58.009305
60. Schwarz M, Garzorz-Stark N, Eyerich K, Aguirre J, Ntziachristos V. Motion Correction in Optoacoustic Mesoscopy. Sci Rep (2017) 7(1):1–9. doi:10.1038/s41598-017-11277-y
61. Zhao H, Chen N, Li T, Zhang J, Lin R, Gong X, et al. Motion Correction in Optical Resolution Photoacoustic Microscopy. IEEE Trans Med Imaging (2019) 38(9):2139–50. doi:10.1109/TMI.2019.2893021
62. Park E-Y, Park S, Lee H, Kang M, Kim C, Kim J. Simultaneous Dual-Modal Multispectral Photoacoustic and Ultrasound Macroscopy for Three-Dimensional Whole-Body Imaging of Small Animals. Photonics (2021) 8(1):13. doi:10.3390/photonics8010013
63. Cho S, Baik J, Managuli R, Kim C. 3D PHOVIS: 3D Photoacoustic Visualization Studio. Photoacoustics (2020) 18, 100168. doi:10.1016/j.pacs.2020.100168
64.Oregon Medical Laser Center. omlc ori edu spectra (2018). Available at: http://omlc.org/spectra (Accessed March 09, 2022).
65. Lee H, Kim J, Kim H-H, Kim C-S, Kim J. Review on Optical Imaging Techniques for Multispectral Analysis of Nanomaterials. Nanotheranostics (2022) 6(1):50–61. doi:10.7150/ntno.63222
Keywords: photoacoustic imaging, ultrasound imaging, dual-modal imaging, 3D imaging, breath-compensation, hemoglobin oxygen saturation, whole-body imaging
Citation: Lee H, Han S, Park S, Cho S, Yoo J, Kim C and Kim J (2022) Ultrasound-Guided Breath-Compensation in Single-Element Photoacoustic Imaging for Three-Dimensional Whole-Body Images of Mice. Front. Phys. 10:894837. doi: 10.3389/fphy.2022.894837
Received: 12 March 2022; Accepted: 29 April 2022;
Published: 12 May 2022.
Edited by:
Xose Luis Dean Ben, University of Zurich, SwitzerlandReviewed by:
Mithun Kuniyil Ajith Singh, CYBERDYNE,INC., NetherlandsMuhannad Fadhel, Yale University, United States
Copyright © 2022 Lee, Han, Park, Cho, Yoo, Kim and Kim. This is an open-access article distributed under the terms of the Creative Commons Attribution License (CC BY). The use, distribution or reproduction in other forums is permitted, provided the original author(s) and the copyright owner(s) are credited and that the original publication in this journal is cited, in accordance with accepted academic practice. No use, distribution or reproduction is permitted which does not comply with these terms.
*Correspondence: Jeesu Kim, amVlc3VraW1AcHVzYW4uYWMua3I=; Chulhong Kim, Y2h1bGhvbmdAcG9zdGVjaC5lZHU=
†These authors have contributed equally to this work