 Andreas Wetscherek1*†
 Erik van der Bijl2†
 Astrid L. H. van Lier3
 Joan Chick1
 Steven Jackson4
 Stephen Gibson5
 Vivian van Pelt6Signe W. Hasler7,8Rob H. N. Tijssen9
- 1Joint Department of Physics, The Institute of Cancer Research and the Royal Marsden NHS Foundation Trust, London, United Kingdom
- 2Department of Radiation Oncology, Radboud University Medical Center, Nijmegen, Netherlands
- 3Department of Radiotherapy, University Medical Center Utrecht, Utrecht, Netherlands
- 4Christie Medical Physics and Engineering, The Christie NHS Foundation Trust, Manchester, United Kingdom
- 5Townsville Cancer Centre, Townsville Hospital and Health Service, Townsville, QLD, Australia
- 6Department of Radiotherapy, Netherlands Cancer Institute, Amsterdam, Netherlands
- 7Laboratory of Radiation Physics, Department of Oncology, Odense University Hospital, Odense, Denmark
- 8Department of Clinical Research, University of Southern Denmark, Odense, Denmark
- 9Department of Radiation Oncology, Catharina Hospital, Eindhoven, Netherlands
MR-guided radiotherapy on hybrid MR-Linacs exploits the excellent soft-tissue contrast of MRI to deliver daily adaptive precision radiotherapy. Geometric fidelity and long-term stability of MRI components are essential, but their longitudinal performance under daily exposure to scattered ionizing radiation is unknown. We report on longitudinal stability of periodic MRI QA on eight clinical 1.5T MR-Linac systems. We provided measurement instructions for periodic MRI QA and received data from seven different centers within the Elekta MR-Linac consortium, which contributed data over acquisition periods ranging from 3–24 months. We tested B0 and B1 homogeneity using a 37 cm diameter cylindrical phantom, which was measured monthly in axial orientation, supplemented by quarterly sagittal and coronal acquisitions. We report average, standard deviation and peak-to-peak variation (99th-1st percentile) within a region of interest (ROI) of 35 cm diameter. Dependence of B0 on the gantry angle and gradient non-linearity were tested quarterly. We analyzed the longitudinal stability of selected metrics of the vendor-provided periodic image quality tests. We found high temporal stability of B0 and B1 measurements and good agreement between different MR-Linac systems. For all measurements, the standard deviation of B0 within the analyzed ROI was below 0.66/0.33/0.33 ppm for axial/sagittal/coronal orientation. The average standard deviation of the ratio between actual and nominal flip angle was 0.022/0.100/0.088 for axial/sagittal/coronal orientation. Systems exhibited distinctively different gantry angle dependencies of B0, with sensitivities of B0 to the gantry angle differing by factors of up to two between systems. Gradient non-linearity analysis yielded average radii of 172 and 242 mm for which 98% of the phantom markers had deviations below 1 and 2 mm, respectively. All analyzed periodic image quality tests were passed, but major events including a body coil replacement and ramp down were apparent in the time series. Overall we found very similar performance of the tested systems and our results could inform the implementation of MR imaging QA for MR-Linacs. While we found differences of the gantry angle dependence of B0 between systems, the high temporal stability found for all tests is a foundation for stereotactic radiotherapy and multi-center clinical trials involving quantitative MRI.
Introduction
Imaging plays an increasingly important role in modern radiation therapy [1]. One of the major recent innovations has been the introduction of onboard magnetic resonance imaging (MRI) guidance in the form of hybrid MRI-Linear accelerator (Linac) systems [2–5]. MR-Linacs enable online adaptive radiotherapy by utilizing the superior soft tissue contrast of MRI in combination with fast treatment plan adaptation to re-optimize the treatment accounting for daily changes in anatomy, for example different filling of hollow organs [6]. Furthermore, MR-Linacs allow for seamless integration of functional MR imaging into treatment workflows to assess response to therapy or adjust treatment dose levels in biologically adaptive radiotherapy. For the discovery or monitoring of useful imaging biomarkers stable MRI performance is important, as well as low inter-system variability [7]. The feasibility of quantitative MRI on the Elekta 1.5T MR-Linac was demonstrated [8]. In addition, recently, MR-guided radiotherapy (MRgRT) has been extended beyond the field of oncology to non-invasively treat cardiac disease, such as ventricular tachycardia [9]. Over the last few years the number of MR-Linac installations has increased rapidly across the globe. At the time of writing, more than 100 MR-Linac systems are in clinical use world-wide.
Because the imaging performance of these systems plays a critical role in the accuracy of the treatment delivery, an adequate quality assurance (QA) program is essential. MR-Linac systems enable recalculation of treatment plans based on MR images acquired on the day of treatment only minutes before treatment delivery. This use case results in increased requirements for geometric fidelity which require modification of the protocols currently used for diagnostic MRI [10, 11]. In addition, the potential interactions of the Linac components with the MRI, in particular between the rotatable metal gantry and the static magnetic field, require a distinct set of QA measurements compared to the set of measurements described by the recently published guidelines on MRI for radiation therapy planning (MR-sim) [12, 13]. An overview of relevant measurements was provided, for instance, by Snyder et al. in their report on commissioning, where they included also some end-to-end tests [14]. In this longitudinal study we focus on characterizing the MR imaging components, which are the static magnetic field (B0 homogeneity), the integrated transmit body coil (B1 homogeneity), the magnetic field gradients used for spatial encoding (geometric fidelity) and the receive coils (periodic image quality tests).
Since the clinical introduction of the 0.35T ViewRay MRIdian MR-Linac in 2017, several papers have reported individual acceptance and commission results [15–17]. The initial system performance of the 1.5T Elekta Unity system was characterized by the Elekta consortium, where a comprehensive commissioning protocol was conducted on four Unity systems [18]. While that study provided an overview of the system performance at baseline and of the variability between MR-Linacs at different institutes, data on the longitudinal stability of MR-Linac systems is scarce. Some data on the long-term stability of the Linac components is available [19], but to our knowledge no data on the longitudinal stability of the MRI subsystem has yet been published.
Knowledge of the longitudinal stability of a system is essential, as it provides the necessary information to assess the achievable tolerances and set the frequency at which the specific QA measurements need to be performed. Without information on the long-term stability of MR-Linac systems in routine clinical use, most institutes currently rely on the advised periodicity and tolerances set by the vendor.
This paper reports on the longitudinal MRI QA measurements conducted in seven institutes that have installed and clinically implemented a 1.5T Elekta Unity MR-Linac system from 2018 onwards. A comprehensive QA program was conducted over a period of two years to provide information on the temporal stability of a range of quality control metrics. The results presented in this report can either be used by individual institutes who are setting up their QA program or by future task groups that provide guidelines on MRgRT. In order to reproduce the results shown in this paper, the scan protocols, as well as the analysis code have been made publicly available as detailed below.
Materials and Methods
Study Design
To facilitate wide-spread adoption of the longitudinal QA experiments, we aimed to include only tests that could be carried out in clinical operation mode of the MR-Linac systems, without the need for additional research agreements with the system vendor or purchase of specialized QA phantoms. This attempt was successful with the exception of the B0 homogeneity mapping, as it was not possible to set up a B0 mapping protocol of similar quality in clinical mode compared to the B0 mapping clinical science key that was available to all but one participating institute (MRL F).
Data Acquisition
Within the Elekta MR-Linac research consortium, we asked for participation of institutes with installed 1.5T MR-Linac Systems (Unity, Elekta AB, Stockholm). Participating sites were asked to regularly perform MRI QA measurements and send the resulting images and results of the vendor-provided Philips PIQT (periodic image quality test) for longitudinal comparative analysis. Detailed instructions of measurement procedures and scan protocols (i.e., examcards) as handed out to the participants are provided in the Supplementary Material. The measurements consisted of refinements of a subset of the measurements detailed in [18]. Modifications were mainly aimed to shorten the measurement time, thereby making the measurements suitable for inclusion of periodic QA into busy clinical schedules. The frequency of measurements was prescribed following a consultation with specialists from all participating centers. Table 1 provides an overview of the tests that we analyzed in this work and the initially suggested measurement frequencies. To understand the impact of hardware changes and allow for correlation of test results and hardware failures, we asked all centers to provide us with an overview of changes to the MRI system throughout the data acquisition period.
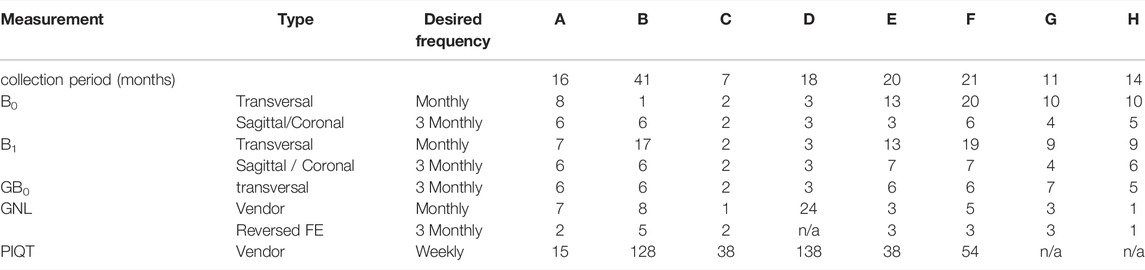
TABLE 1. Measurements and their desired frequency according to the instructions as sent out to the participating centers. For each measurement and MR-Linac system (A–H), the number of datasets is listed, which were suitable for analysis. For each MR-Linac system the data collection period is stated (between first and last measurement). Measurements include B0 and B1 homogeneity, B0 dependency on gantry angle (GB0), gradient non-linearity (GNL) and periodic image quality test (PIQT).
All tests were conducted at gantry angle 0° with the exception of the gantry-dependent B0 homogeneity test. Tests were grouped by the used phantom into examcards, to minimize the required time for phantom setup and settling of the phantom liquid. For B0 homogeneity, B1 homogeneity and the dependence of B0 on the gantry angle, a large cylindrical “body” phantom (37 cm diameter) provided by the vendor was used, which can be placed in a cradle in the isocenter of the MR-Linac system, along the three main axis of the system. Because of the size of the phantom the radio-translucent anterior and posterior receive coils have to be removed and the B0 and B1 measurements are performed with the integrated body coil. Phantom setups for the different measurements are shown in Figure 1. The posterior coil, which is located below the treatment table and the anterior coil shown in Figure 1C are only used for the measurements of the PIQT phantom. Details of the sequence parameters are found in Table 2. Data analysis for all tests was performed in Python 3.8+ with code available online (https://github.com/ErikvanderBijl/MRI_QA).
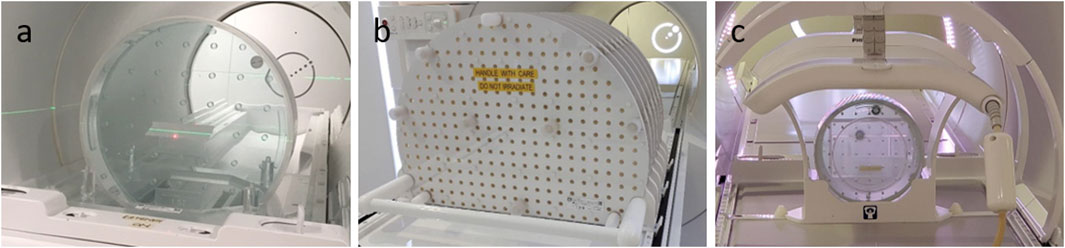
FIGURE 1. Phantom setups used in this study. (A) Philips Body phantom used for B0 and B1 mapping in axial orientation, placed in the phantom holder. In this setup the posterior coil is removed. The phantom can be positioned in sagittal orientation or coronal (lying on top of the phantom holder). (B) Vendor-provided phantom with seven slabs with markers used for geometric distortion measurements. This phantom is placed directly on top of the treatment couch following the vendor-provided instructions. (C) Periodic Image Quality Test (PIQT) phantom in vendor-provided phantom holder. The anterior receive coil is placed directly on top of the phantom holder.
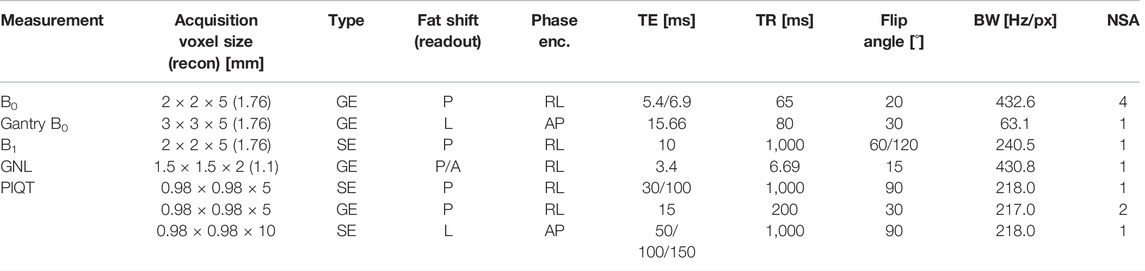
TABLE 2. Sequence parameters for the protocols used in this study. For each measurement series, sequence type, frequency (readout) and phase encoding direction are stated. In-plane recon voxel size is stated if it differs from the acquisition voxel size. Additionally echo time (TE), repetition time (TR), flip angle, readout bandwidth (BW) and number of signal averages (NSA) are listed. B0 and B1 measurements were acquired with identical timing for sagittal and coronal orientation. Increasing the flip angle for B1 led to a BW increment of 12.2 Hz/px. GNL measurements were repeated with opposed readout polarity, leading to anterior (A) instead of posterior (P) fat shift.
B0 Homogeneity
In addition to a suggested monthly axial measurement frequency, coronal and sagittal scans were performed every 3 months, see Table 1. For B0 mapping, phase images were acquired with a slice-selective spoiled gradient echo sequence with echo times TE1/TE2 = 5.4/6.9 ms. Echoes were acquired in separate repetition time (TR) intervals to minimize echo spacing and the amount of resulting phase wrapping. A vendor-provided reconstruction of the B0 map was used. For each measurement, we report mean and standard deviation within a cylindrical ROI of diameter 35 cm in five slices centered around the isocenter and display their evolution over time. The size of the ROI was chosen slightly smaller than the phantom to avoid partial volume effects and sensitivity to small differences in positioning. Slice positions were chosen to cover the whole phantom and number of slices was limited to keep measurement time short. Additionally, the range from 1st to 99th percentile and the average absolute value (abs) of the B0 off-resonance within the ROI are calculated. For each of the aforementioned properties mean and standard deviation are calculated for each MR-Linac system (intra-site) and overall (inter-site). Furthermore, to assess spatial constancy of the B0 homogeneity, for each phantom orientation, we provide maps of mean and standard deviation per voxel calculated over all datasets averaged over the five slices acquired.
B1 Homogeneity
B1 homogeneity was measured with a slice-selective spin echo sequence using the double flip angle method [20]. Two images were acquired with flip angles of 60° and 120° and otherwise identical imaging parameters. Based on the associated magnitude images
Gantry-Dependent B0 Homogeneity
The gantry-angle dependency of B0 was tested every 3 months using the same body phantom setup in transverse orientation. The Linac was positioned at 13 different gantry angles in 30° increments from −180° to 180° and for each position, phase images were acquired without re-shimming, using a slice-selective spoiled gradient echo sequence with TE = 15.7 ms. This echo time is particularly well-suited for intuitive interpretation of the phase images, as a phase difference of
Geometric Fidelity
The geometric fidelity test evaluates whether the vendor-provided correction adequately corrects the image distortions due to spatial non-linearity of the MR imaging gradients. We asked participating sites to perform this experiment every 3 months. To characterize the split gradient system of the Unity MR-Linac, a large (500 × 375 × 330 mm3) 3D geometric QA phantom (Philips, Best, Netherlands) is used, which is provided with each Unity system. This phantom consists of 7 slabs with a total of 1,932 markers aligned to a rectangular grid with grid spacings of 25 × 25 × 55 mm3. Participating centers were asked to follow the automated geometric fidelity QA procedure provided by the system vendor and subsequently acquire an identical image with reversed frequency encoding (FE) direction to disentangle gradient non-linearity and B0 inhomogeneity. The frequency encoding was applied along the vertical (posterior-anterior) axis. On the Unity system the polarity of the frequency encoding gradient is denoted by the fat shift direction parameter, corresponding to the direction that MR signal from protons in fat would be dislocated, compared to signal originating from protons bound in water. The fat shift direction is posterior (FSP) in the protocol run in the automated QA procedure and anterior (FSA) for the additional scan.
The high intensity (99.5th percentile) voxels of the acquired magnitude images after Gaussian filtering were extracted from the dataset. These voxels were clustered and detected marker positions were assigned to the centers of mass of these clusters. Phantom setup inaccuracies were accounted for by using a rigid registration of the central detected marker positions to the central expected marker positions; more details can be found in [22]. Longitudinal stability was assessed for the radii for which 98% of the corrected marker positions were within 1 and 2 mm. The choice of 98% was made to reduce the sensitivity of this test to noise at the edge of the images identified as markers.
For datasets that were acquired in the same session with both FE directions, marker positions prior to setup corrections were compared along the three main directions. Furthermore, the radii with deviations were calculated for the average marker positions over the two scans and compared to the radii without correction for the two scans with opposite FE directions.
General Image Quality Tests
The vendor-provided PIQT phantom–a multi-purpose phantom with 20 cm diameter, similar to the ACR phantom [11]–was used for weekly image scaling and SNR tests. Here we report on the longitudinal stability of central frequency, flood field uniformity [NEMA int. uniformity, NEMA S/N (B)], spatial linearity (NEMA perc. Diff), spatial resolution (horizontal and vertical pixel size) and slice profile (FWHM). These measurements are performed by a vendor-provided analysis script based on a dual-echo spin echo sequence using the radio-translucent anterior and posterior receive coils. Mean and standard deviation per system were calculated.
Results
Response and Overview of Datasets
We received longitudinal data from seven institutes acquired on eight different MR-Linac systems. A summary of the datasets available for analysis is provided in Table 1. We noticed that the requested QA frequencies were not adhered to by all institutions and received confirmation that due to COVID regulations research scans were not possible at all desired times. However, from some centers we received data throughout the first 2 years of clinical operation of their MR-Linac system.
B0 Homogeneity
Figure 2 displays the results of the B0 homogeneity analysis. Overall, excellent agreement between the different MR-Linac systems is found and measurements are stable over time. Within the circular ROI of diameter 35 cm, we found an average resonance frequency offset of (−0.63 ± 0.10) ppm across all measurements for axial phantom orientation, (0.29 ± 0.24) ppm for sagittal phantom orientation and (0.30 ± 0.06) ppm for coronal phantom orientation. For all measurements, the standard deviation within the analyzed ROI was below 0.66, 0.33, and 0.33 ppm for axial, sagittal and coronal orientation, respectively. Average peak-to-peak values (difference between 99th and 1st percentile) across all MR-Linac systems were (2.16 ± 0.29) ppm, (1.29 ± 0.13) ppm and (1.30 ± 0.22) ppm for transverse, sagittal and coronal orientation. The values for the average absolute off-resonance (abs) within the ROI were (0.64 ± 0.09) ppm, (0.30 ± 0.02) ppm, and (0.32 ± 0.06) ppm. These are in line with the vendor’s specification of root mean square values of <0.17 ppm for a spherical diameter of 30 cm, given the phantom-induced field distortions and the different metric. For a maximal FOV of 50 cm × 50 cm × 45 cm, a root mean square value of < 2 ppm is specified. Detailed results for each orientation and MR-Linac system can be found in Table 3.
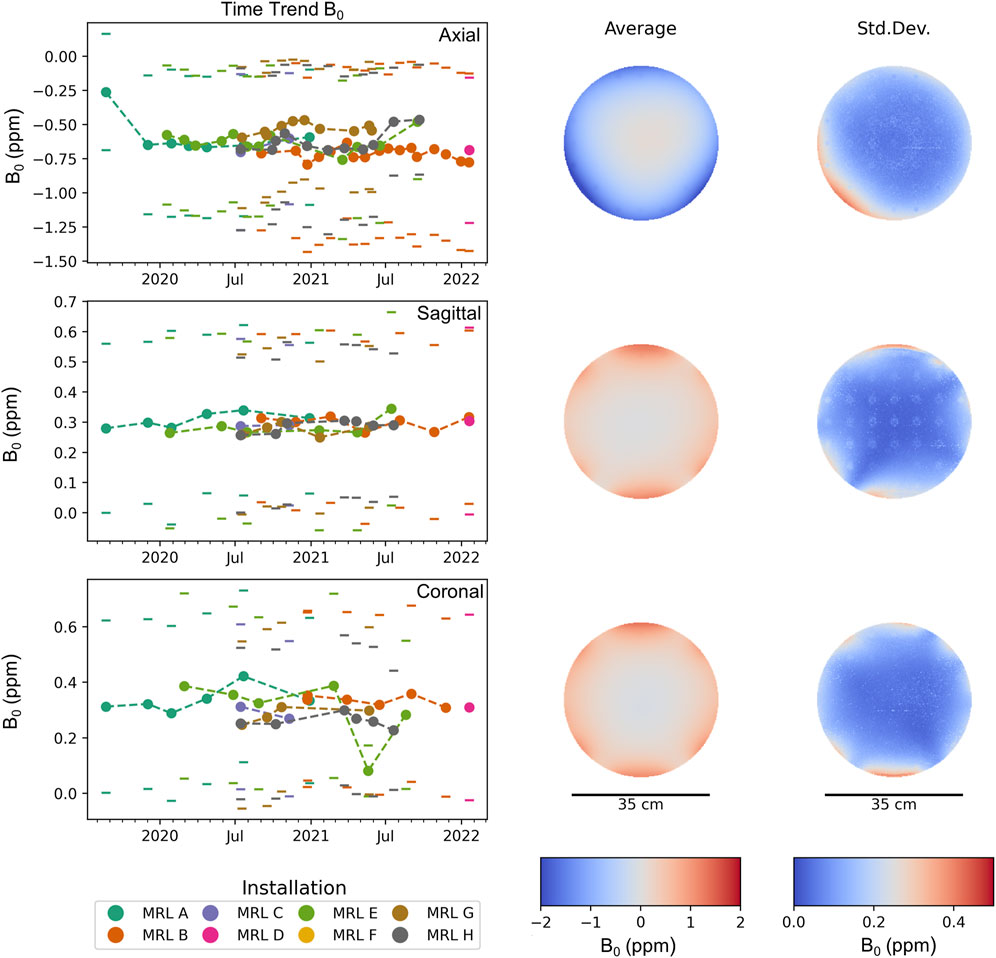
FIGURE 2. Average B0 inhomogeneity (off-resonance) within a circular ROI of diameter 35 cm in parts per million (ppm). Each time point corresponds to one measurement, where the standard deviation is indicated by a pair of horizontal lines. Different MR-Linac systems are distinguished by color. For each orientation, the mean and standard deviation of the off-resonance frequency across all measurements is spatially mapped. The standard deviation between different measurements (and MR-Linac systems) is much smaller than the variation across the ROI, confirming the high longitudinal reproducibility of the B0 measurements.
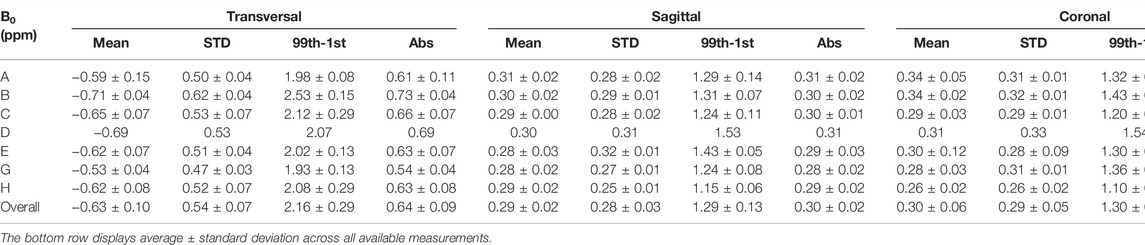
TABLE 3. B0 homogeneity results. Each row corresponds to a different MR-Linac system (A-H). We report on mean, standard deviation, peak-to-peak difference (99th-1st percentile) and the mean absolute off-resonance (abs) within an ROI of 35 cm diameter for each MR-Linac system and phantom orientation. Displayed values are in ppm and we report average ± standard deviation across all measurements for the respective MR-Linac system. The vendor-provided B0 mapping technique was not available on MRL F and only one acquisition per orientation could be acquired on MRL D.
B1 Homogeneity
Results of the B1 flip angle accuracy test are displayed in Figure 3 and show a very high level of agreement between different systems and stability over time. The average ratio between actual and nominal flip angle within a circular ROI of diameter 35 cm was 1.03 ± 0.004 across all measurements for axial phantom orientation, 0.90 ± 0.008 for sagittal phantom orientation and 0.93 ± 0.011 for coronal phantom orientation. Within the analyzed ROI, the maximum standard deviation was 0.022, 0.100, and 0.088 for axial, sagittal and coronal orientations. The average peak-to-peak ranges within the ROI across all MR-Linac systems were 0.06 ± 0.010, 0.34 ± 0.018, and 0.31 ± 0.013 for transverse, sagittal and coronal orientation. Detailed results for each orientation and MR-Linac system are provided in Table 4.
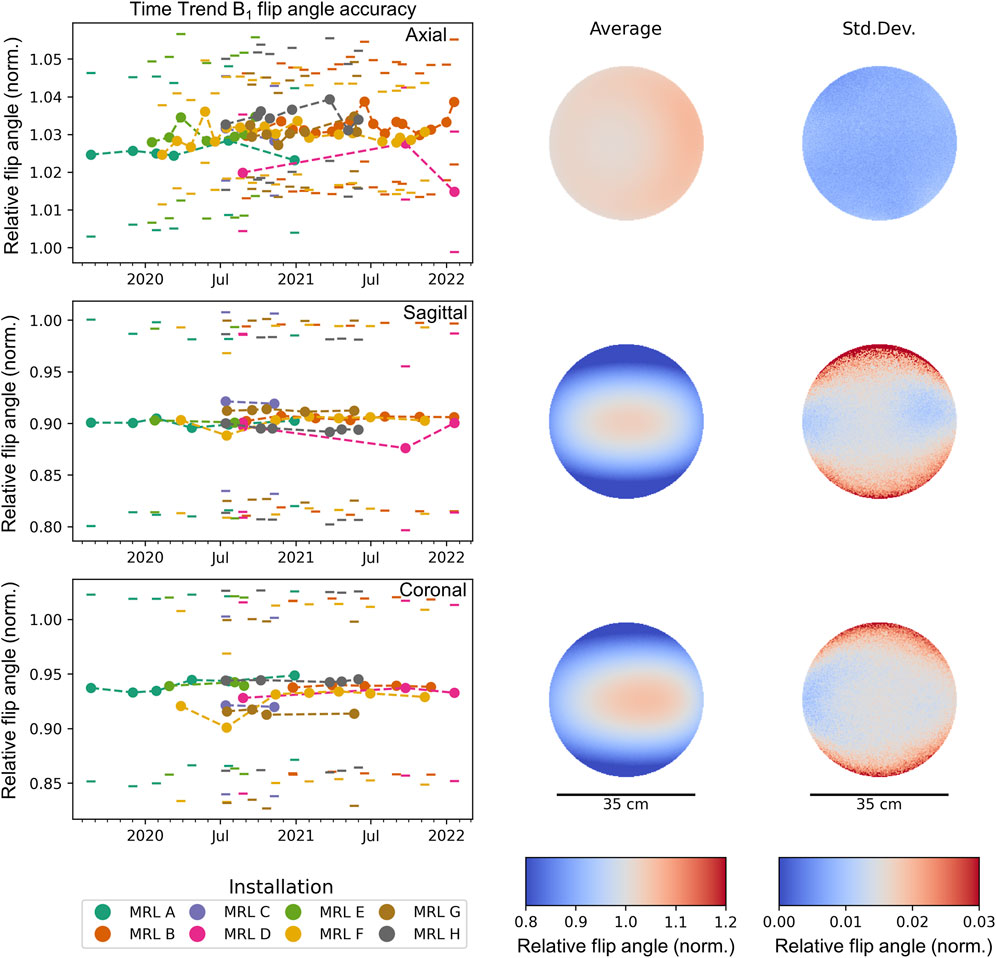
FIGURE 3. Average longitudinal flip angle accuracy within a circular ROI of diameter 35 cm through the isocenter. Each time point corresponds to one measurement, where the standard deviation across the ROI is indicated by a pair of horizontal lines. Different MR-Linac systems are distinguished by color. For each orientation, the mean and standard deviation of the flip-angle accuracy across all measurements is spatially mapped. The standard deviation between different measurements (and MR-Linac systems) is much smaller than the variation across the ROI, confirming the high longitudinal reproducibility of the B1 map.
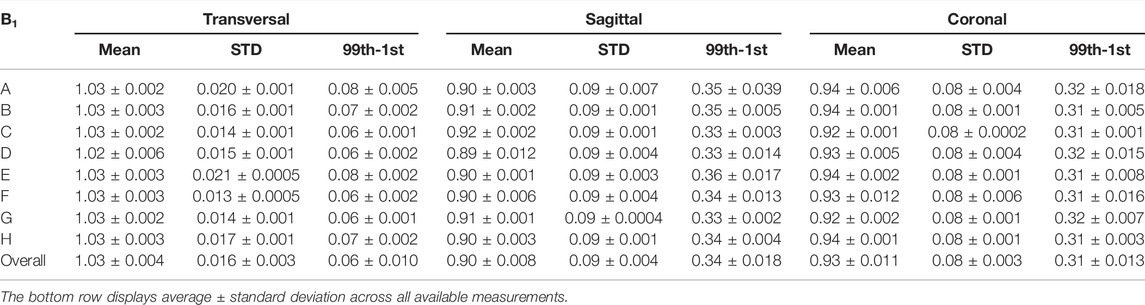
TABLE 4. B1 homogeneity results. Each row corresponds to a different MR-Linac system (A–H). We report on mean, standard deviation and peak-to-peak difference (99th-1st percentile) of the ratio between actual and nominal flip angle within an ROI of 35 cm diameter for each MR-Linac system and phantom orientation. Across all measurements for the respective MR-Linac system, average ± standard deviation are reported.
Gantry-Dependent B0 Homogeneity
Figure 4 shows the dependency of the main magnetic field homogeneity on the gantry angle. Measurements are grouped by MR-Linac system into different subplots and are highly reproducible on each individual MR-Linac system. Large differences are found, however, between MR-Linac systems, which leads to some MR-Linac systems showing a stronger dependence of B0 on the gantry angle. At the opposite gantry positions of the reference at 0°, the effects of the Linac rotation are twice as strong on MR-Linac B compared to MR-Linac C.
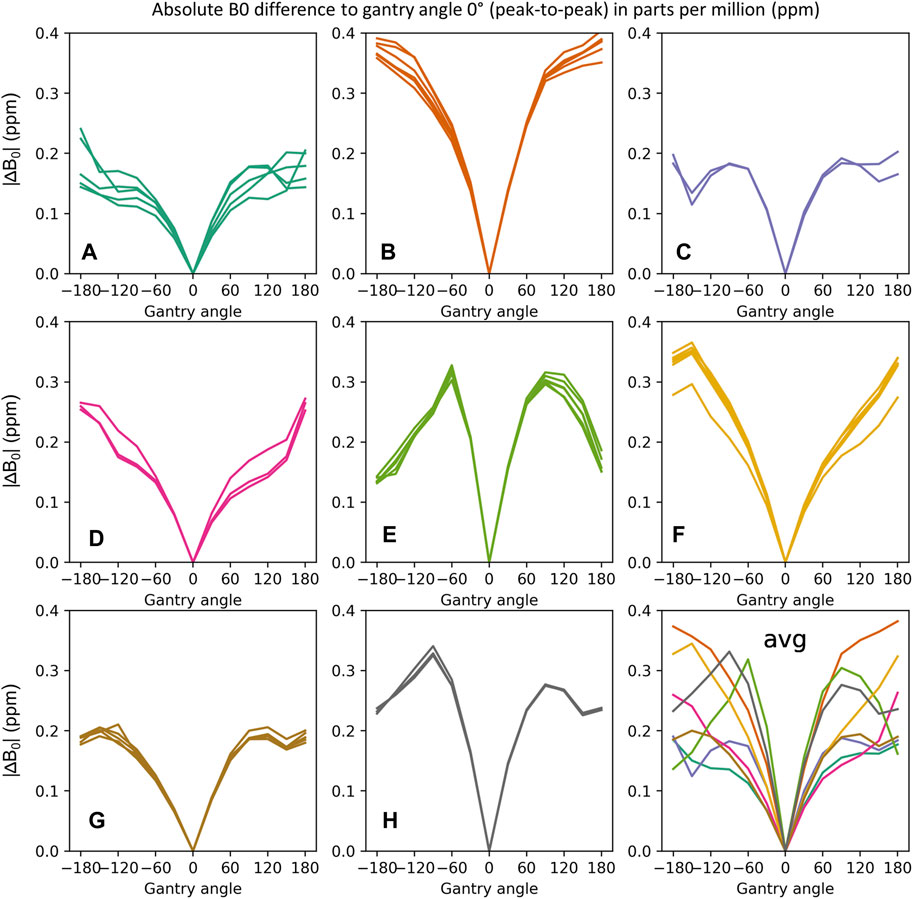
FIGURE 4. Gantry angle dependence of B0 measured as difference to gantry angle 0°. The sub-plots display the peak-to-peak values (between 99th and 1st percentile) of the absolute B0 difference within a circular ROI of 35 cm diameter. Measurements of the same MR-Linac system are grouped (A–H). The average gantry angle dependencies for all MR-Linac systems are displayed in the last subplot. While the gantry angle dependency of B0 for each MR-Linac system is stable over time, characteristic differences between MR-Linac systems are observed.
Geometric Fidelity
We detected a median 1,743 of the 1,932 markers on the image sets provided, where the points farthest from the isocenter were most challenging to detect. Setup uncertainties were small (0.3 ± 0.3, −0.9 ± 0.3, −0.5 ± 2.0) mm in LR, AP, and CC directions respectively. The maximum absolute Euler angles for rotational setup errors were αmax = 0.15°, βmax = 0.26°, and γmax = 0.24° across all datasets. The average radii for which 98% of the markers had deviations below 1 or 2 mm were 172 and 242 mm. In Figure 5A the longitudinal results for all different MR-Linacs are shown. The systems show stable performance of the geometric fidelity over time and only limited differences are observed between MR-Linac systems. In Figures 5B–D all 52 datasets are plotted for three axial slices with increasing distance from the isocenter, where the average deviation of each marker from its reference position is color-coded. The dashed lines show the average radii for all institutions within which distortions are below 1 and 2 mm, respectively.
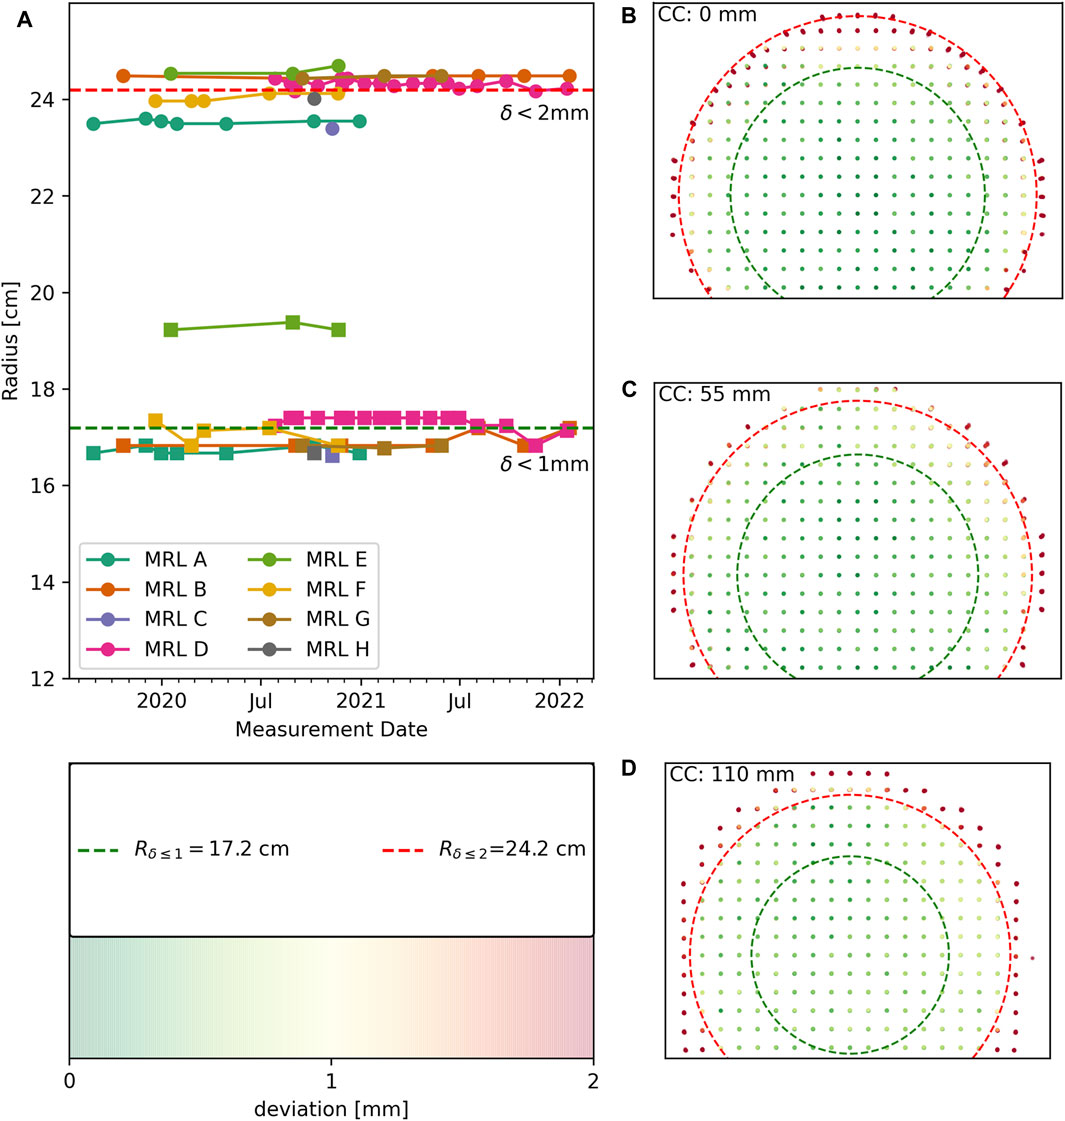
FIGURE 5. Geometric fidelity results for all measurements with fat shift in posterior direction (n = 47). (A) longitudinal geometric fidelity of different MR-Linacs coded by color. Lines between data points serve as guide to the eye. Squares represent the radii within which deviations are below 1 mm and circles correspond to deviations below 2 mm. Average radii across all measurements are indicated by dashed lines. (B–D) Datasets are plotted superimposed after correcting for setup inaccuracies using the color coding of distortions that is displayed in the bottom left insert.
A total of 16 paired measurements with the FE directions swapped from AP to PA were analyzed in order to separate B0 effects from gradient induced distortion. Average differences in marker positions were found to be LR: 0.0 ± 0.8, AP: 0.4 ± 2.9, CC: 0.0 ± 0.3 mm, with deviations increasing with distance to the isocenter. The differences along the frequency encoding direction (AP) were stable over time and of the same magnitude for all systems. Finding the largest differences in marker positions along the frequency encoding direction is expected, because off-resonance leads to a dislocation along this axis [23]. When assessing the distortions based on the average positions of the markers between the FSP and FSA scans, we found that the radii within which distortions were below 1 and 2 mm increased by a median of 5 and 9 mm, respectively.
General Image Quality Tests
In Figure 6 the results for the longitudinal analysis of the PIQT data are shown. In addition to the reported central frequency, we selected a subset of all checks and indicators that represent the four main categories checked in the PIQT tests: flood field uniformity, spatial linearity, spatial resolution and slice profile, as can be seen in Figures 6A–E. Field drift is required to be within 1 ppm/day. For system F, a phase of extensive hardware changes between May and August 2021 resulted in a breach of this norm Figure 6A, this replacement is also apparent in Figure 6C. The PIQT results also indicate stable performance of the systems well within the vendor-set bounds on the different indicators. For system D, the body coil was swapped in June 2021.
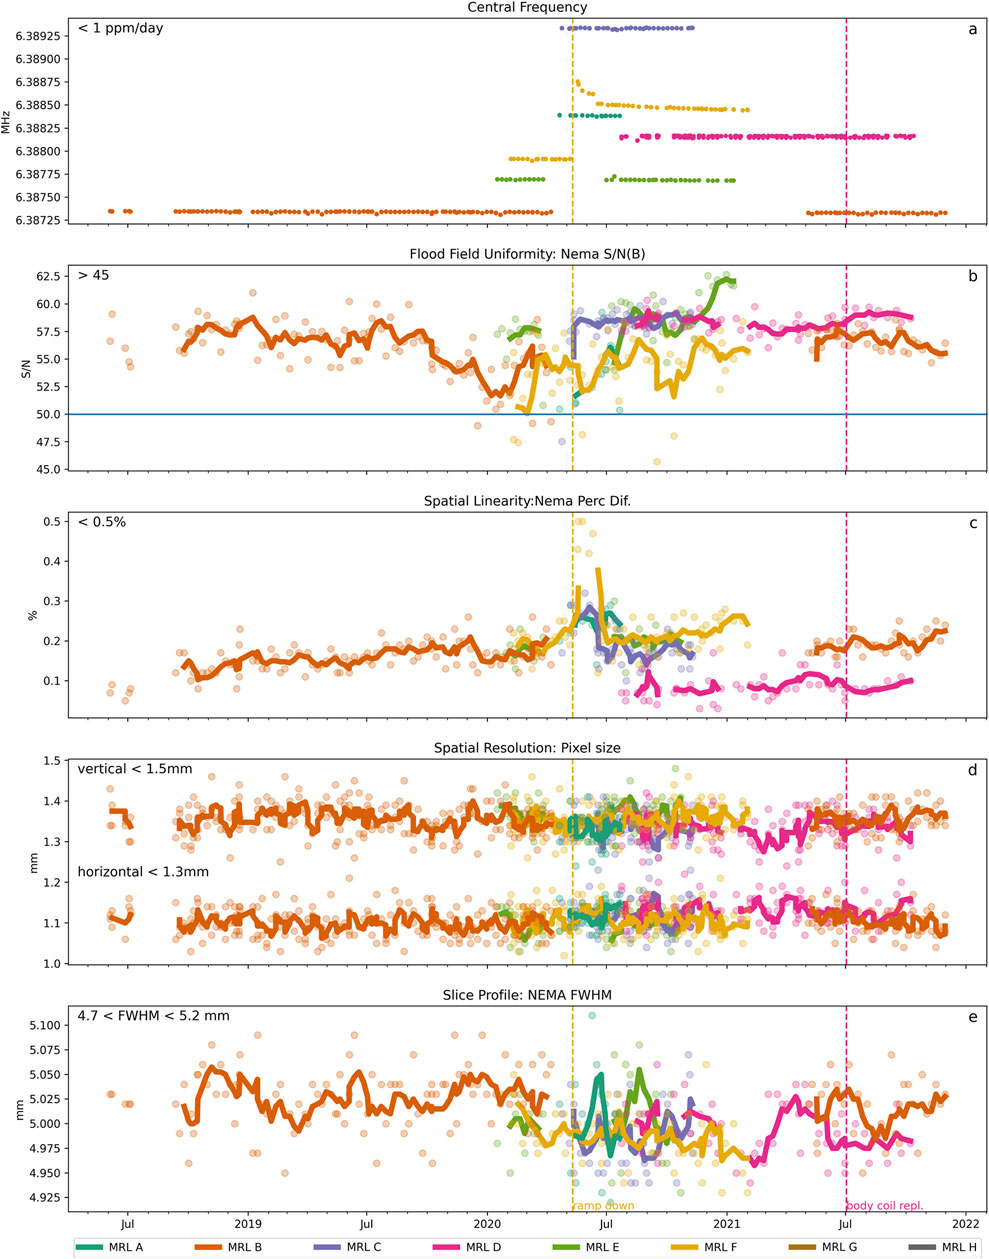
FIGURE 6. Longitudinal behavior of selected PIQT measurements over time. Solid lines represent the moving average calculated across 4 successive time points. (A) Central Frequency was stable with field drifts below 1 ppm/day except for MR-Linac F for which a quench had occurred in May 2020. All other tests were passed, respectively within the tolerances: (B) Flood Field Uniformity, (C) Spatial Linearity, (D) Spatial Resolution along vertical and horizontal axes and (E) Slice profile (between the 4.75 and 5.2 mm).
Discussion
MR-Linacs represent the latest evolution in image guided radiation oncology. Only a few years after its initial introduction, this new technology is rapidly making its way into mainstream clinical use with the number of worldwide installations increasing rapidly. While the initial system characterization during the commissioning phase has been extensively reported in numerous scientific articles, little has been published on the longitudinal stability of these systems.
To the best of our knowledge, this paper presents the first multi-institutional data set that reports on the long-term QA results of the onboard MRI of the 1.5T Elekta Unity MR-Linac. The study was conducted across seven institutes, which are members of the Elekta MR-Linac research consortium as early adopters of this new technology. These data give valuable insight into 1) the variation between installations, 2) the stability over time, and 3) whether the tolerances as set by the vendor are representative of the actual, long term, performance.
The periodicity of the tests (Table 1) was determined based on a consensus meeting with all the participants in order to find the right balance between obtaining a comprehensive data set and considering practical limitations, such as availability of phantoms, machine time, and staffing. In setting the periodicity of each of the measurements, the expected stability (based on theoretical grounds) and the duration of the measurement were weighed against each other. In order to minimize the additional workload, the test protocol largely consisted of tests that were already part of the vendor suggested QA program, such as the Philips PIQT and geometric fidelity tests. These tests were supplemented with tests on B0/B1 homogeneity and additional gradient linearity tests with reversed readout polarity. Additional tests using third party phantoms, such as ACR measurements, were not included in this analysis to enable participation by as many institutes as possible and to enable curation of a homogeneous data set. In many countries, for example in the United States, MR imaging QA is a requirement for reimbursement and fixed test frequencies are prescribed for diagnostic MR scanners. For MR simulators and MR-Linac systems, however, country specific rules might not yet be in place or differ from the latest recommendations [13] of AAPM Task Group 284. We hope that our work can contribute to standardization and homogenization of requirements for MR imaging QA on MR-Linac systems.
B0 and B1 homogeneity were stable over time: For the systems included in this study variations within the 35 cm diameter ROI were much larger than longitudinal variations. In addition, the spatial pattern of inhomogeneities was very comparable between different systems. These results are very encouraging and suggest that MR-Linac systems are suitable for multi-center quantitative MR imaging (qMRI) studies [7], in particular T1/T2 mapping [24] and MR fingerprinting [25, 26] which rely on accurate flip angles. They also highlight, however, that the characteristic spatial variations of both B0 and B1 fields need to be taken into account, when calculating qMRI parameters. While we successfully characterized the various MRI subsystems, such as the imaging gradients, B0 and B1 fields, additional qMRI specific system QA is advised when setting up (multi-center) qMRI studies, like suggested by existing qMRI guidelines [27, 28]. Further, radiotherapy patients often carry implants and patient-specific B0 mapping [29, 30] would be required to fully ensure correct MR imaging performance, while patient-specific B1 mapping could be required for sensitive qMRI studies. An interesting result of this work is that the standard deviation of B0 is considerably larger in axial orientation. Using the same phantom, we measured similar asymmetry on a diagnostic MR scanner. This would suggest that this finding is not characteristic for the MR-Linac system, but could be explained by the interactions of the phantom with the static magnetic field. A spherical phantom would be preferable for measuring B0 homogeneity, but we could not guarantee the availability of an identical spherical test object at each site. Regarding the B1 mapping we found lower relative flip angles for sagittal and coronal phantom orientation, in particular with increasing distance from isocenter in head-foot direction. This finding is consistent across installations and could be explained by the characteristics of the transmit coil and the interactions of the phantom with the B1 field.
For the gantry dependent B0 measurements, peak-to-peak amplitudes were constant over time for each MR-Linac system, while distinctively different characteristics were observed between systems. These results highlight again the longitudinal stability of the tested MR-Linac system, but suggest that for MR imaging experiments that are sensitive to small changes in B0, re-shimming should be performed after the gantry angle is changed. Further, our results suggest that imaging during gantry rotation could be susceptible to effects related to B0, which has been previously described in literature [31] and also might have implications for qMRI techniques acquired during treatment delivery [32]. Jackson et al. found that imaging while rotating the gantry did not impact clinical imaging, but could affect EPI-based imaging techniques [33]. A tight integration between the Linac and MR components in MR-guided radiotherapy systems could overcome these challenges by automatically applying gantry-angle specific shim settings. The shimming process during installation is a two-step approach. First, the MRI is shimmed (using the regular shim trays) at a fixed gantry angle (G = 0°). Once the magnet is shimmed at gantry angle G = 0°, measurements are conducted to test the influence of the moving gantry on the B0 homogeneity. Based on these measurements at installation, additional shims are placed on the gantry (further away from isocenter) to mitigate the effect that the gantry angle has on B0, which could explain the observed characteristic differences between MR-Linac systems in this study [18].
Apart from limiting the effects of B0 inhomogeneity, the most important determinant for geometric fidelity is the vendor-provided correction for gradient non-linearity. It is essential for the use of MR images in radiotherapy treatment planning and whenever possible a 3D distortion correction should be applied [34]. In our study we found that geometric fidelity was very stable for all systems and radii within which 98% of the markers were within 2 mm of the expected positions showed good inter-system agreement. For the analogous 1 mm deviation one system (MRL E) performed better, but this could be related to the non-zero manufacturing tolerances of the phantom itself. The effect appears exacerbated in Figure 5 due to the discretized nature of the distribution of distances of marker positions on the grid from the isocenter. Our results support that for the assessment of longitudinal stability a single acquisition with constant frequency encoding direction is sufficient. Our results also demonstrate that geometric fidelity on first generation 1.5T MR-Linac systems is on par with current diagnostic MR systems and we did not observe any indication of decline throughout clinical use. The good agreement between institutes is encouraging for multi-center studies involving stereotactic radiotherapy [35] and for qMRI techniques that are sensitive to spatial gradient non-linearity, such as diffusion-weighted MRI [36]. However, post-processing might be required to account for distortions related to long-term eddy currents generated from the diffusion-weighting gradients [32].
The selected PIQT metrics, such as f0, SNR, spatial resolution, and slice profile, show some variation over time, but remain for the most part within the specifications set by the vendor. These specifications are similar to those found on diagnostic MRI scanners, for which the PIQT is also part of the standard QA program. A jump in f0 was observed for MRL F, which coincided with a period of extensive maintenance including ramp down and recalibrations. This finding coincided with a sharp increase in the spatial linearity metric. We indicated major MRI-related events on the Unity systems with horizontal lines on the PIQT plot.
The B0 homogeneity results presented for the eight installations in this paper are similar to the results presented in [18] with peak-to-peak values in the order of 500 nT. The geometric fidelity results were slightly different to those reported in [18], with slightly smaller displacement values within a 35 cm diameter spherical value (DSV) observed in this paper. The main reason for this is most likely the fact that the B0 contribution has not been removed in the analysis presented here (not all centers were able to acquire the required additional polarity scan). The added effect of B0 inhomogeneity may therefore slightly bias the results presented in Figure 5. While this is not an issue for long term consistency tests, it is advisable to separate the effects of gradient non-linearity and B0 for commissioning purposes. The gradient non-linearities are extremely stable over time, which is in line with reports from diagnostic scanners [25, 37, 38]. Mechanically the gradients are not expected to move, unless as part of servicing or corrective maintenance. Since the gradient non-linearities are determined by the physical design of the gradient, these are not expected to vary over time, unless the GNL correction, which is applied during the image reconstruction process, is altered, for example as part of a re-calibration. Scaling of the gradient amplitude related to gradient amplifiers, however, is more likely to vary over time, but would result in an overall scaling of the image, and can thus be detected with smaller phantoms, such as the PIQT phantom. This check is part of the recommended daily QA on the Elekta Unity system.
Even though the periodicity was agreed on by all the participating centers and more centers planned to participate in this study, the eventual number of data sets that were received was less than initially planned. Part of this was due to the fact that some measurements were additional to the standard QA programs of the institutes and had to be conducted in research time. Due to COVID-19 many of the participating institutes had to temporarily stop all non-essential activities, including research. Nevertheless the amount of data that was collected provides a large amount of information on the stability of many aspects of the MRI subsystem. With the amount of data at hand an in-depth benchmark comparison between the eight MRI systems is possible. In this paper, however, the main focus was to investigate the longitudinal stability. Further analysis on the variability across different systems may be a topic of future research. One limitation of this study is that information on the clinical duty cycle and number of delivered treatment fractions was not collected and could not be retrieved retrospectively. Different treatment fractionation schemes and treated tumor types between centers make comparisons challenging. Furthermore, working hour arrangements and the pause of MR-Linac treatments during the COVID-19 pandemic differed across countries. Another limitation of this study is related to the design choice that only phantoms available at each Unity MR-Linac site were used. This results, for example, in a B1 field distribution that is dependent on the orientation of the cylindrical shaped Philips large Body phantom (Figure 2). This could be minimized by using a spherical oil-filled phantom. Furthermore, techniques using non-selective excitation would minimize the impact of the slice profile on B0 and B1 maps. Third-party phantoms for assessment of gradient non-linearity are available, which have potentially smaller manufacturing tolerances regarding the marker positions. While we requested all experiments to be carried out at gantry angle 0°, this information is not stored in the MR Dicom files or PIQT logs and it is not possible to verify this retrospectively.
Another important aspect of MR imaging in MR-guided radiotherapy are potential performance changes with heating of the gradient coils, which is not assessed by the set of tests that were analyzed in this study. While this might not play a big role in a standard MR-guided treatment workflow, heavy-duty cycle sequences, such as diffusion-weighted EPI used in functional imaging could lead to gradient heating. Another possible source is continuous fast gradient echo imaging to monitor motion during treatment delivery, in particular for longer hypo-fractionated treatments. We included a test for ghosting and stability, which is an MR-Linac adapted version of the FBIRN test for fMRI [39, 40], in the supplemental material. This test could allow for a qualitative assessment of field and gradient drifts during heavy-duty cycle imaging, but was not included in this report as we received less regular data than for the other tests and no robust automated quantitative analysis was available for longitudinal analysis.
Information on the longitudinal stability of the MR subsystem of MR-Linacs, which rely heavily on their imaging performance is essential. Our results suggest extremely similar performance between the eight tested Elekta Unity MR-Linac systems. The data therefore provides valuable information for institutes implementing this type of system, and can help to determine the required periodicity for their specific QA program. The results presented in this paper can however not be generalized to other MR-Linac system designs. Further, we only analyzed data acquired over a period of up to 2 years, which does not allow for conclusions regarding the potential effects on MR imaging electronics from long-term accumulation of total dose due to scattered ionizing radiation. Also, the stability of the Linac components is not considered in this paper. As the (corrective) maintenance of the Linac subsystem (e.g., dismantling/replacing ferromagnetic parts on the gantry ring) may influence the MRI, this could have an influence on the eventual MRI QA program as well.
Data Availability Statement
The datasets presented in this article are not readily available, because a test data set will be made available after publication. Requests to access the datasets should be directed to AW, YS53ZXRzY2hlcmVrQGljci5hYy51aw==.
Author Contributions
AW and RT designed the study and developed the ExamCards for the experiments. They drafted and disseminated instructions for longitudinal QA measurements. AW and EB developed analysis code and performed the data analysis, including preparation of figures and tables. AW, EB, and RT developed the manuscript concept and wrote the first manuscript draft. All authors contributed to acquiring data and revising the manuscript.
Funding
AW acknowledges support from Cancer Research UK (C33589/A28284).
Conflict of Interest
The authors declare that the research was conducted in the absence of any commercial or financial relationships that could be construed as a potential conflict of interest.
Publisher’s Note
All claims expressed in this article are solely those of the authors and do not necessarily represent those of their affiliated organizations, or those of the publisher, the editors and the reviewers. Any product that may be evaluated in this article, or claim that may be made by its manufacturer, is not guaranteed or endorsed by the publisher.
Supplementary Material
The Supplementary Material for this article can be found online at: https://www.frontiersin.org/articles/10.3389/fphy.2022.891600/full#supplementary-material
References
1. Beaton L, Bandula S, Gaze MN, Sharma RA. How Rapid Advances in Imaging Are Defining the Future of Precision Radiation Oncology. Br J Cancer (2019) 120(8):779–90. doi:10.1038/s41416-019-0412-y
2. Lagendijk JJW, Raaymakers BW, Raaijmakers AJE, Overweg J, Brown KJ, Kerkhof EM, et al. MRI/linac Integration. Radiother Oncol (2008) 86(1):25–9. doi:10.1016/j.radonc.2007.10.034
3. Fallone BG, Murray B, Rathee S, Stanescu T, Steciw S, Vidakovic S, et al. First MR Images Obtained during Megavoltage Photon Irradiation from a Prototype Integrated Linac-MR System. Med Phys (2009) 36(6Part1):2084–8. doi:10.1118/1.3125662
4. Keall PJ, Barton M, Crozier S. The Australian Magnetic Resonance Imaging-Linac Program. Semin Radiat Oncol (2014) 24(3):203–6. doi:10.1016/j.semradonc.2014.02.015
5. Mutic S, Low D, Chmielewski T, Fought G, Hernandez M, Kawrakow I, et al. TU-H-BRA-08: The Design and Characteristics of a Novel Compact Linac-Based MRI Guided Radiation Therapy (MR-IGRT) System. Med Phys (2016) 43(6Part36):3770. doi:10.1118/1.4957630
6. Dunlop A, Mitchell A, Tree A, Barnes H, Bower L, Chick J, et al. Daily Adaptive Radiotherapy for Patients with Prostate Cancer Using a High Field MR-Linac: Initial Clinical Experiences and Assessment of Delivered Doses Compared to a C-Arm Linac. Clin Translational Radiat Oncol (2020) 23:35–42. doi:10.1016/j.ctro.2020.04.011
7. van Houdt PJ, Saeed H, Thorwarth D, Fuller CD, Hall WA, McDonald BA, et al. Integration of Quantitative Imaging Biomarkers in Clinical Trials for MR-Guided Radiotherapy: Conceptual Guidance for Multicentre Studies from the MR-Linac Consortium Imaging Biomarker Working Group. Eur J Cancer (2021) 153:64–71. doi:10.1016/j.ejca.2021.04.041
8. Kooreman ES, van Houdt PJ, Nowee ME, van Pelt VWJ, Tijssen RHN, Paulson ES, et al. Feasibility and Accuracy of Quantitative Imaging on a 1.5 T MR-Linear Accelerator. Radiother Oncol (2019) 133:156–62. doi:10.1016/j.radonc.2019.01.011
9. Mayinger M, Kovacs B, Tanadini-Lang S, Ehrbar S, Wilke L, Chamberlain M, et al. First Magnetic Resonance Imaging-Guided Cardiac Radioablation of Sustained Ventricular Tachycardia. Radiother Oncol (2020) 152:203–7. doi:10.1016/j.radonc.2020.01.008
10. Jackson E, Bronskill M, Drost D, Och J, Pooley R, Sobol W, et al. Acceptance Testing and Quality Assurance Procedures for Magnetic Resonance Imaging Facilities. American Association of Physicists in Medicine (2010). Published online December. doi:10.37206/101
11. Price R, Allison J, Clarke G, Dennis M, Hendrick RE, Keener C, et al. Magnetic Resonance Imaging Quality Control Manual (2015).
12. Speight R, Dubec M, Eccles CL, George B, Henry A, Herbert T, et al. IPEM Topical Report: Guidance on the Use of MRI for External Beam Radiotherapy Treatment Planning *. Phys Med Biol (2021) 66(5):055025. doi:10.1088/1361-6560/abdc30
13. Glide-Hurst CK, Paulson ES, McGee K, Tyagi N, Hu Y, Balter J, et al. Task Group 284 Report: Magnetic Resonance Imaging Simulation in Radiotherapy: Considerations for Clinical Implementation, Optimization, and Quality Assurance. Med Phys (2021) 48(7):e636–e670. doi:10.1002/mp.14695
14. Snyder JE, St-Aubin J, Yaddanapudi S, Boczkowski A, Dunkerley DAP, Graves SA, et al. Commissioning of a 1.5T Elekta Unity MR-Linac: A Single Institution Experience. J Appl Clin Med Phys (2020) 21(7):160–72. doi:10.1002/acm2.12902
15. Ginn JS, Agazaryan N, Cao M, Baharom U, Low DA, Yang Y, et al. Characterization of Spatial Distortion in a 0.35 T MRI-Guided Radiotherapy System. Phys Med Biol (2017) 62(11):4525–40. doi:10.1088/1361-6560/aa6e1a
16. Saenz DL, Yan Y, Christensen N, Henzler MA, Forrest LJ, Bayouth JE, et al. Characterization of a 0.35T MR System for Phantom Image Quality Stability Andin Vivoassessment of Motion Quantification. J Appl Clin Med Phys (2015) 16(6):30–40. doi:10.1120/jacmp.v16i6.5353
17. Wang J, Yung J, Kadbi M, Hwang K, Ding Y, Ibbott GS. Assessment of Image Quality and Scatter and Leakage Radiation of an Integrated MR-LINAC System. Med Phys (2018) 45(3):1204–9. doi:10.1002/mp.12767
18. Tijssen RHN, Philippens MEP, Paulson ES, Glitzner M, Chugh B, Wetscherek A, et al. MRI Commissioning of 1.5T MR-Linac Systems - a Multi-Institutional Study. Radiother Oncol (2019) 132:114–20. doi:10.1016/j.radonc.2018.12.011
19. Mittauer KE, Dunkerley DAP, Yadav P, Bayouth JE. Characterization and Longitudinal Assessment of Daily Quality Assurance for an MR-Guided Radiotherapy (MRgRT) Linac. J Appl Clin Med Phys (2019) 20(11):27–36. doi:10.1002/acm2.12735
20. Stollberger R, Wach P. Imaging of the activeB1 Fieldin Vivo. Magn Reson Med (1996) 35(2):246–51. doi:10.1002/mrm.1910350217
21. Herráez MA, Burton DR, Lalor MJ, Gdeisat MA. Fast Two-Dimensional Phase-Unwrapping Algorithm Based on Sorting by Reliability Following a Noncontinuous Path. Appl Opt (2002) 41(35):7437–44. doi:10.1364/ao.41.007437
22. Keesman R, van de Lindt TN, Juan-Cruz C, van den Wollenberg W, van der Bijl E, Nowee ME, et al. Correcting Geometric Image Distortions in Slice-Based 4D-MRI on the MR-Linac. Med Phys (2019) 46(7):3044–54. doi:10.1002/mp.13602
23. Baldwin LN, Wachowicz K, Fallone BG. A Two-step Scheme for Distortion Rectification of Magnetic Resonance Images. Med Phys (2009) 36(9Part1):3917–26. doi:10.1118/1.3180107
24. Nejad-Davarani SP, Zakariaei N, Chen Y, Haacke EM, Hurst NJ, Salim Siddiqui M, et al. Rapid Multicontrast Brain Imaging on a 0.35T MR-Linac. Med Phys (2020) 47(9):4064–76. doi:10.1002/mp.14251
25. Bruijnen T, Van Der Heide O, Intven MPW, Mook S, Lagendijk JJW, Van Den Berg CAT, et al. Technical Feasibility of Magnetic Resonance Fingerprinting on a 1.5T MRI-Linac. Phys Med Biol (2020) 65(22):22NT01. doi:10.1088/1361-6560/abbb9d
26. Mickevicius NJ, Kim JP, Zhao J, Morris ZS, Hurst NJ, Glide-Hurst CK. Toward Magnetic Resonance Fingerprinting for Low-Field MR-Guided Radiation Therapy. Med Phys (2021) 48(11):6930–40. doi:10.1002/mp.15202
27. Shukla-Dave A, Obuchowski NA, Chenevert TL, Jambawalikar S, Schwartz LH, Malyarenko D, et al. Quantitative Imaging Biomarkers alliance (QIBA) Recommendations for Improved Precision of DWI and DCE-MRI Derived Biomarkers in Multicenter Oncology Trials. J Magn Reson Imaging (2019) 49(7):e101–e121. doi:10.1002/jmri.26518
28. Raunig DL, McShane LM, Pennello G, Gatsonis C, Carson PL, Voyvodic JT, et al. Quantitative Imaging Biomarkers: A Review of Statistical Methods for Technical Performance Assessment. Stat Methods Med Res (2015) 24(1):27–67. doi:10.1177/0962280214537344
29. Van Lier ALHMW, Meijers LTC, Phillippens MEP, Hes J, Raaymakers BW, Van Der Voort Van Zyp JRN, et al. Geometrical Imaging Accuracy, Image Quality and Plan Quality for Prostate Cancer Treatments on a 1.5 T MRLinac in Patients with a Unilateral Hip Implant. Phys Med Biol (2021) 66(20):205013. doi:10.1088/1361-6560/ac1302
30. Keesman R, van der Bijl E, Janssen TM, Vijlbrief T, Pos FJ, van der Heide UA. Clinical Workflow for Treating Patients with a Metallic Hip Prosthesis Using Magnetic Resonance Imaging-Guided Radiotherapy. Phys Imaging Radiat Oncol (2020) 15:85–90. doi:10.1016/j.phro.2020.07.010
31. Kim T, Gu B, Maraghechi B, Green O, Lewis B, Mutic S, et al. Characterizing MR Imaging Isocenter Variation in MRgRT. Biomed Phys Eng Express (2020) 6(3):035009. doi:10.1088/2057-1976/ab7bc6
32. Lewis B, Guta A, Mackey S, Gach HM, Mutic S, Green O, et al. Evaluation of Diffusion-Weighted MRI and Geometric Distortion on a 0.35T MR-LINAC at Multiple Gantry Angles. J Appl Clin Med Phys (2021) 22(2):118–25. doi:10.1002/acm2.13135
33. Jackson S, Glitzner M, Tijssen RHN, Raaymakers BW. MRI B 0 Homogeneity and Geometric Distortion with Continuous Linac Gantry Rotation on an Elekta Unity MR-Linac. Phys Med Biol (2019) 64(12):12NT01. doi:10.1088/1361-6560/ab231a
34. Torfeh T, Hammoud R, Perkins G, McGarry M, Aouadi S, Celik A, et al. Characterization of 3D Geometric Distortion of Magnetic Resonance Imaging Scanners Commissioned for Radiation Therapy Planning. Magn Reson Imaging (2016) 34(5):645–53. doi:10.1016/j.mri.2016.01.001
35. Hal WA, Straza MW, Chen X, Mickevicius N, Erickson B, Schultz C, et al. Initial Clinical Experience of Stereotactic Body Radiation Therapy (SBRT) for Liver Metastases, Primary Liver Malignancy, and Pancreatic Cancer with 4D-MRI Based Online Adaptation and Real-Time MRI Monitoring Using a 1.5 Tesla MR-Linac. PLoS One (2020) 15(8):e0236570. doi:10.1371/journal.pone.0236570
36. Bammer R, Markl M, Barnett A, Acar B, Alley MT, Pelc NJ, et al. Analysis and Generalized Correction of the Effect of Spatial Gradient Field Distortions in Diffusion-Weighted Imaging. Magn Reson Med (2003) 50(3):560–9. doi:10.1002/mrm.10545
37. Addy NO, Wu HH, Nishimura DG. Simple Method for MR Gradient System Characterization and K-Space Trajectory Estimation. Magn Reson Med (2012) 68(1):120–9. doi:10.1002/mrm.23217
38. Vannesjo SJ, Haeberlin M, Kasper L, Pavan M, Wilm BJ, Barmet C, et al. Gradient System Characterization by Impulse Response Measurements with a Dynamic Field Camera. Magn Reson Med (2013) 69(2):583–93. doi:10.1002/mrm.24263
39. Friedman L, Glover GH. Report on a Multicenter fMRI Quality Assurance Protocol. J Magn Reson Imaging (2006) 23:827–39. doi:10.1002/jmri.20583
Keywords: MR-linac, longitudinal QA, gantry dependence, stability analysis, MR-guided radiotherapy, MRI QA
Citation: Wetscherek A, van der Bijl E, van Lier ALH, Chick J, Jackson S, Gibson S, van Pelt V, Hasler SW and Tijssen RHN (2022) Longitudinal Stability of MRI QA up to Two Years on Eight Clinical 1.5 T MR-Linacs. Front. Phys. 10:891600. doi: 10.3389/fphy.2022.891600
Received: 07 March 2022; Accepted: 17 May 2022;
Published: 13 June 2022.
Edited by:
Christian Karger, German Cancer Research Center (DKFZ), GermanyReviewed by:
Michael Gach, Washington University in St. Louis, United StatesPaul Summers, European Institute of Oncology (IEO), Italy
Copyright © 2022 Wetscherek, van der Bijl, van Lier, Chick, Jackson, Gibson, van Pelt, Hasler and Tijssen. This is an open-access article distributed under the terms of the Creative Commons Attribution License (CC BY). The use, distribution or reproduction in other forums is permitted, provided the original author(s) and the copyright owner(s) are credited and that the original publication in this journal is cited, in accordance with accepted academic practice. No use, distribution or reproduction is permitted which does not comply with these terms.
*Correspondence: Andreas Wetscherek, YS53ZXRzY2hlcmVrQGljci5hYy51aw==
†These authors have contributed equally to this work and share first authorship