 Matthew Armstrong
 Andre Pincot
 Simon Rogers2
 Thomas Knight
- 1Department of Chemistry and Life Science, Chemical Engineering Program, United States Military Academy, West Point, NY, United States
- 2Department of Chemical and Biomolecular Engineering, University of Illinois at Urbana-Champaign, Urbana, IL, United States
For years industrial polymer production has driven the development of rheological models to characterize the flow of materials. With the evolution of these models has come a corresponding advancement in the understanding of the complex mechanical properties. Recent efforts have been focused on modeling the behavior of complex fluids such as blood, whose microstructure leads to has simultaneous characteristics such as: thixotropy; elasticity; plasticity; and an evolving viscosity (part of which originates with the rouleaux’s evolution). The specific complex behavior of human blood can be analyzed via the analysis of Large-Amplitude-Oscillatory-Shear (LAOS) and Small-Amplitude-Oscillatory-Shear (SAOS) response tests. Unique features of human blood cannot be replicated in legacy steady-state models and, thus, have required the development of more comprehensive models capable of accurately fitting both steady state, transient flow and oscillatory shear flow. Expanding upon prior transient models, collaboration between the Chemical Engineering departments of the United States Military Academy and the University of Delaware has produced a new model, tensorial enhanced structural stress thixotropic-viscoelastic model (t-ESSTV). This model can capture the timescales contained within the plasma and individual red blood cells viscoelasticity and the thixotropic timescales associated with rouleaux breakdown and aggregation. The efficacy of t-ESSTV is demonstrated with a single Donor before consolidating the best fit model parameters of twelve Donor sets of rheological data. We then show the parametric correlations between model and physiological parameters and with the models’ prediction of microstructure, we correlate microstructure with the “elastic, solid-like” metrics as computed by Sequence of Physical Processes (SPP).
1 Introduction
As a complex suspension, the aqueous plasma medium of human blood contains three primary structures: platelets, white blood cells, and red blood cells (RBCs). Unique among these structures is the tendency of suspended RBCs to agglomerate into “rouleaux” structures, where the RBCs stack themselves face-to-face. While several factors can affect the formation of these rouleaux, their formation can be dependent upon the concentration of binding fibrinogen proteins and the stress and shear rate applied [1, 2]. The binding of the RBCs to one another is reversible, allowing for the repeated break-down and reformation of rouleaux under evolving flow conditions [3]. The structural change of these agglomerates entails a cascading change in blood’s general fluid properties. For instance, the viscosity of blood increases upon the formation of new rouleaux due to increased resistance to flow from increased surface area.
In addition to changes in viscosity, rouleaux formation and disintegration affect the thixo-elastic-visco-plastic (TEVP) properties of human blood. Being a complex fluid, containing a variety of suspended rouleaux (microstructure), blood displays the following unique properties; thixotropy, viscoelasticity, and viscoplasticity [4–7]. Thixotropy describes the evolution of blood’s microstructure (rouleaux); viscoelasticity refers to the demonstration of simultaneous viscous and elastic characteristics; and viscoplasticity relates to the presence of a non-zero yield stress threshold above which particles begin to experience irreversible deformation with no elastic structure recovery. The thixotropic and viscoplastic tendencies of human blood can both be primarily attributed to the creation and breakage of the rouleaux structures, which is a function of local concentration of RBCs (or hematocrit). In addition to governing the formation of microstructure, the elasticity of individual suspended RBCs independently contributes to the viscoelastic properties of blood. Nonetheless, the actual yield stress of blood is low at around an average value of 4 mPa maximum, due to the weak intermolecular forces present within the rouleaux microstructure [4, 8–10]. This is corroborated by Merrill et al. [4], and Armstrong and Tussing [10].
Of note are the different conditions in which the viscoelastic contributions from either the rouleaux proper or individual RBCs predominate; in higher shear regimes, blood viscoelasticity is primarily contingent upon the elastic deformation of individual RBCs, whereas at lower shear rates the rouleaux play a more prominent role [10, 11]. When juxtaposed with the viscoelastic relaxation time contribution of rouleaux, the individual RBC viscoelasticity possess a shorter relaxation time with shear thinning observable shear rates along a range of 10 s−1 to 1,000 s−1 [8, 11–16]. This complex dynamic behavior necessitates the development of novel model features able to characterize all aspects of blood’s TEVP phenomena to better understand and address blood pathologies [17–21].
While current models can more effectively model the transient thixotropic and viscoelastic behavior of complex flow, first-generation generalized Newtonian frameworks such as the Casson and Herschel-Bulkley models allowed for the representation of a spectrum of steady-state properties, only, including shear thinning and yield stress [22, 23]. While these models are unable to predict transient and viscoelastic phenomena produced by the evolution of blood rouleaux, they provided the groundwork by which more sophisticated models could be developed, able to represent the microstructure hysteresis and accompanying effects on material elasticity and yield stress [8, 9]. The next generation of rheology models, notably exemplified by the Maxwell and the Oldroyd-8 family of models, phenomenologically model viscoelastic fluid behaviors, allowing for the prediction of transient behavior at high shear [24–26]. However, to effectively model the behaviors of dynamic, microstructure-laden fluids at low shear, the integration of a thixotropic component is necessary [24–31]. In representing the time-dependent construction and destruction of microstructure, a kinetic rate equation is introduced with a non-dimensional structure parameter varying between zero, representing no agglomeration, and one, representing full microstructure, or fully structured rouleaux [27–30]. However, representing the microstructure contribution to viscoelasticity requires the simultaneous incorporation dual elastic and plastic stress terms or, alternatively, the combination of the thixotropic component with an established viscoelastic model [31, 32].
Total strain and its derivative by time, total strain rate can be separated into two components, allowing for the definition of elasticity and plasticity terms. This subsequently allows for the representation of isotropic hardening (IH) and kinematic hardening (KH) per the kinematic hardening theories of plasticity [28, 31, 33]. IH describes the relationship between a material’s thixotropic behavior and its structural parameters, whereas KH enumerates the effective yield stress dependency upon deformation. The latter of which can also act to retard the back stress response given shear stress [33–37].
While prior models were developed featuring kinematic hardening [38], it was only with the collection of substantial amounts of substantial transient experimental data, rigorously collected and assessed, that new models could be evaluated [8]. In addition to being probed for steady-state characteristics, the comprehensive dataset included response drawn from Uni-directional Large Amplitude Oscillatory Shear (UD-LAOS) experiments, which subjected the blood to both steady and a linearly superimposed oscillatory shear. For UD-LAOS, the minimum possible shear is zero, in contrast to conventional LAOS which can venture into negative shear regimes. The newfound transient data [39], and model fitting allowed for a far more accurate representation of RBC viscoelasticity via the application of a generalized White-Metzner-Cross model, producing the Horner-Armstrong-Wagner-Beris or, as it is now known, HAWB [8]. Whereas this framework itself evolved from the Apostolidis-Armstrong-Beris (AAB) and the Modified Delaware Thixotropic Model (MDTM) [8]. A subsequent version of the HAWB system, the modified HAWB model (mHAWB), integrated the rouleaux viscoelastic response. Other variants, such as ethixo-mHAWB [10], have been presented with slight modifications to the kinetic equation to represent the structural parameter more accurately in the use of a shear aggregation term. A further modification, relevant to this work, manifested in the enhanced thixotropic viscoelastic (ETV) model [9, 40].
Related work has explored distinct aspects of various types of rheological models. Instead of the White-Metzner-Cross model as applied to the mHAWB model, other efforts attempted to explore potential advantages to applying modified Oldroyd-8 and Giesekus models to describing the transient and steady-state aspects of complex fluids, including human blood [10, 24, 41, 42]. Armstrong et al. [43] addressed the characterization of blood rheology in modifying the viscoplastic Herschel-Bulkley model while ignoring the viscoelasticity contributions of individual RBCs, as proposed by Saramito [31]. Per Saramito’s approached, the entailing ethixo elastoviscoplastic (ethixo EVP) introduced a thixotropic structural parameter bound to a kinetic equation, allowing for a full TEVP representation of blood [43]. Ethixo EVP and other thixotropic EVP variants were found to fit to transient experimental blood data comparatively better than base EVP. Other models included the Multimode-Lambda + Isotropic/Kinematic Hardening or ML-IKH, developed by Wei et al., which combined isotropic kinematic hardening with independent thixotropic time scales to achieve similar modeling capabilities for complex rheology [36]. A similar, modified variant of the Varchanis et al. model, the Saramito-Phan-Thien-Tanner + Isotropic/Kinematic Hardening or SPTT- IKH, combined several elements of prior models to better approximate TEVP behavior [31, 37, 44]. Later efforts tensorialized these models, possessing anywhere from 11 to 15 parameters.
The developments were accompanied by the parallel development of the viscoelastic enhanced Modified Delaware Thixotropic (VE-MDTM) in incorporating a viscoelastic evolution timescale into the total stress term produced by rouleaux module of the original MDTM system. In this, the presence of a unique timescale associated with the viscoelastic stress contribution of suspended rouleaux was successfully demonstrated [45–49]. Per the Armstrong-Frederick kinematic hardening rule, KH and IH approaches can be applied to current-generation TEVP models, allowing for enhanced model step-test performance when used in conjunction with other thixotropic and viscoelastic terms [36, 37, 43, 44]. The adoption of separate timescales for the RBC viscoelastic, rouleaux viscoelastic, and rouleaux thixotropic contributions, featuring additional shear-dependent structure destruction and agglomeration timescales, has been found to improve model performance in predicting both steady-state and transient flow. The ethixo-mHAWB, as well as other contemporary models such as that recently introduced by Pincot et. al. [9, 40, 45], utilize these independent timescales to maximize model performance while still aiming to limit the number of parameters required for operation. These timescales offer the necessary insight into in-vivo rouleaux evolution to permit the future development of means by which to apply advanced CFD modeling to the analysis of blood flow.
The ETV, and ESSTV [46] performance in fitting steady state and transient data to observed blood rheology was substantially improved compared to earlier-generation models; however, the most recent modifications of ETV have applied a novel viscoelastic module to apply recently published approaches to plasticity to better express both the plastic and elastic contributions to stress from the rouleaux microstructure [31, 36, 37, 46–49]. In understanding the rheology, and mechanical properties of blood, it is useful to analyze its response under a few experimental shear conditions due to the dynamic nature of blood viscoelasticity. In this, LAOS is a useful analytical tool in investigating its nonlinear behavior through variation of temporal and spatial frames simultaneously. Oftentimes supplementing oscillatory shear analysis is a set of moduli:
where γ0 represents the strain amplitude, ω the oscillation frequency,
While the Fourier approach has permitted the characterization of the more dynamic aspects of material response, it lacks a complete physical interpretation [41]. However, this can be remedied in the formation of an orthonormal foundation via the use of the first Chebyshev polynomials [42, 43]. Recent developments by Rogers et al. have led to the development of the sequence of physical processes framework (SPP), which couples with LAOS to analyze stress response. SPP’s titular physical processes relates to the analyzed material’s plastic, elastic, viscosity, and yielding properties. Unlike the Fourier and Chebyshev approaches, SPP emplaces unique viscous and elastic moduli along a spectrum of datapoints to calculate transient moduli from LAOS data [50–53]. TEVP models such as ESSTV can then be functionalized in predicting blood structure through LAOS wit subsequent comparison of those drawn from SPP.
Our main (new) goals here are: 1. to strengthen previous rheological model and physiological model parameters; 2. Show the aggregated rheological model parameters over twelve donors; 3. Show how sequence of physical processes and our predictions of rouleaux are correlated for Donor5, while comparing to the aggregated SPP for the 12 Donors. The remainder of the paper is organized as follows: Section 2. is a brief background, then description of the tensorial ESSTV model. Section 3. Materials and experimental methods, broken into three subsections: materials and data acquisition; parameter optimization; Sequence of Physical Processes description and parametric correlations. Section 4. Experimental and model fitting results. Section 5. Discussion and Section 6. Conclusion and future work.
2 t-ESSTV Model Description
The t-ESSTV framework consists of two general components: 1. A White-Metzner approach to account for the viscoelastic component from the plasma and suspended, deformable, individual red blood cells, shown here in component form:
where, Gc is the elastic modulus of the plasma and individual RBCs and
where
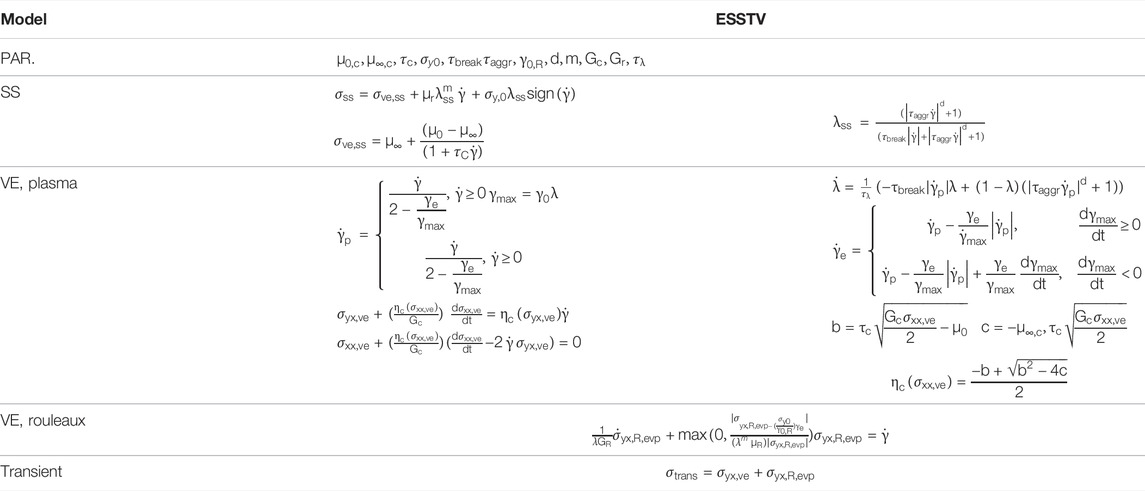
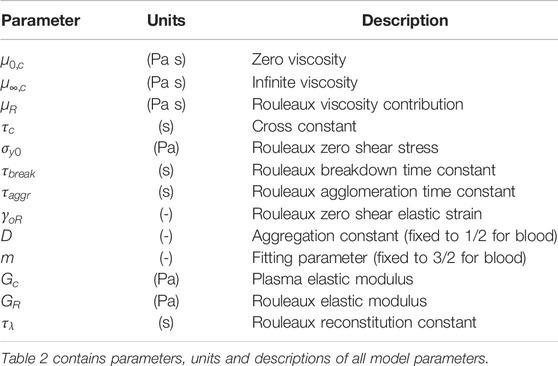
TABLE 2. Explication of ESSTV input parameters [46].
The demonstrated behavior of rouleaux under evolving force conditions, are the descriptions of rouleaux breakdown and agglomeration over time per
The effects of the microstructure will factor into an elasto-visco-plastic (evp.) contribution to total stress as follows
where
The remaining auxiliary equations for the t-ESSTV model are shown in Table 1. Per procedures described in the recent work of Horner et al. and Armstrong et al. [8, 9, 46]. The models can be cast into tensorial form, further enhancing the general predictive performance [46]. The tensorial version of Eq. 6, for the yx, xx, yy, and zz components is shown in Table 3. Please refer to the publications for a detailed description of development procedures [7–10, 40, 41, 43, 46]. In Table 3 below we take the meaning of
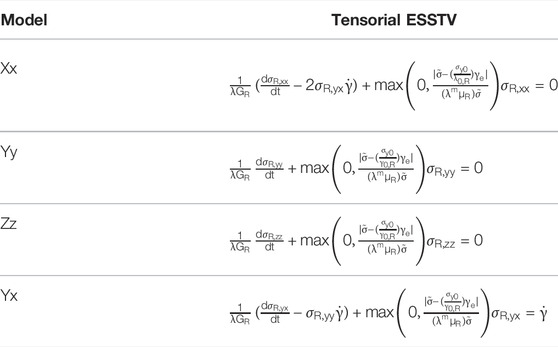
TABLE 3. Summary and comparison of the t-ESSTV rouleaux viscoelastic contributions to total stress [46].
The t-ESSTV model is used here as framework to be applied to the mechanical and rheological interrogation of ten human blood donors. From the best fit parameter values of the t-ESSTV model and physiological parameter values measured in the laboratory, a sequence of parametric correlations is obtained and analyzed. Additionally, we correlate our model predictions for microstructure,
3 Materials and Experimental Methods
3.1 Materials and Data Acquisition
Collection and rheological blood analysis was executed via the procedures and protocols established by Horner et al. [8, 9, 39]. This entailed the drawing of 6 ml of blood into a vacutainer tube with 1.8 mg/ml EDTA. 9 ml of blood was also preserved for subsequent testing via the Complete Blood Count, Lipid Pane and Fibrinogen Activity test, as shown below in Table 4 [8, 9, 39]. All testing was done under the purview of University of Delaware’s IRB.
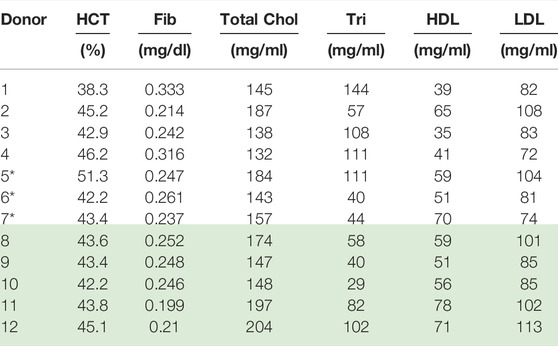
TABLE 4. Physiological parameter values for Donors (1–12); *Donors (8–12) reprinted with permission from Journal of Rheology [46] (Donors with* is new data). Donors 8–12 “Reproduced from [Journal of Rheology 66, 327 (2022); Doi: 10.1122/8.0000346], with the permission of AIP Publishing.”
Data collection was performed with a TA Instruments ARES G2 rheometer, featuring strain control and a double wall couette [8, 9, 39]. Tests were conducted at 37°C and limited to shear rates below 1,000 s−1. A preshear of 700 s−1 was applied to negate the effects of thixotropic hysteresis.
3.2 Parameter Optimization
The models were fit per procedures established by Armstrong et al. and Horner et al., with several modifications [8, 9, 38, 41, 43, 46, 47]. First, the steady state parameters are set with steady state data by minimizing the product of a parallel tempering normalized cost function, Fcost,ss [7–9, 41, 43, 46–48]
where yi represents a steady state stress datapoint and fi is the relevant model prediction. N represents the number of analyzed points. The second step involves the fitting of transient parameters to three iterations of step-up and step-down shear rate testing experiments. This again calls upon the parallel tempering algorithm:
Where M represents the number of step-up or step-down in shear rate tests. Fitting the model to collected rheological data is accomplished via the use of Matlab’s ode23 function to process the component differentials [8, 9, 41, 43]. This is done to pinpoint a good initial guess for the parameters during the tensorial model parameter fitting. During the t-ESSTV parameter fitting, using the initial guesses generated above the total Fcost value is computed by normalizing both the steady state and transient data with individual stress measurements for each steady state point for the steady state data, and maximum stress values for the entire step-up/down for the step-up/down in shear rate data sets as shown below in Eq. 12.
As an alternative to its peer ode45 function, ode23 possesses a degree less accuracy while allowing the more efficient processing of stiff ordinary differential equations while still maintaining sufficient accuracy. Using oscillatory shear flow with
the small amplitude oscillatory shear is predicted, and Fcost, SAOS is again reduced in accordance with the following expression
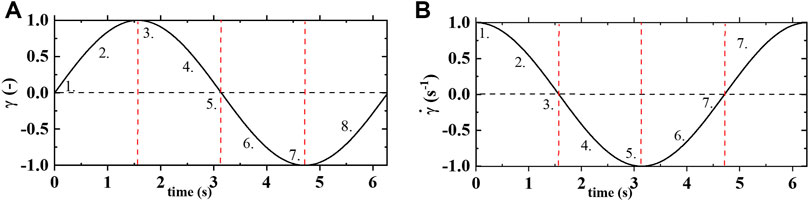
FIGURE 1. (A) strain vs time; and (B) shear rate vs time of one cycle of oscillatory shear flow at
Fcost, SAOS is then calculated for the amplitude sweep, with fit parameters held constant to product a full alternance period. The expression A = bx is then applied, where A represents and array of two columns:
To fit the tensorial model variants, the following is done; first, initial guesses are provided from the best fit values of the non-tensorial model variants. Next, the steady state and transient parameters are simultaneously fit to a non-normalized steady state cost function from a collection of stress measurements.
3.3 Sequence of Physical Processes
We introduce Sequence of Physical Processes (SPP) with a more in depth discussion of oscillatory shear flow, where the strain is give as
We must now create the SPP—A matrix with the data directly from the rheometer: the strain; quotient of shear rate over frequency; and stress (all) over a period of oscillatory shear flow at alternance is used to construct the A matrix as follows:
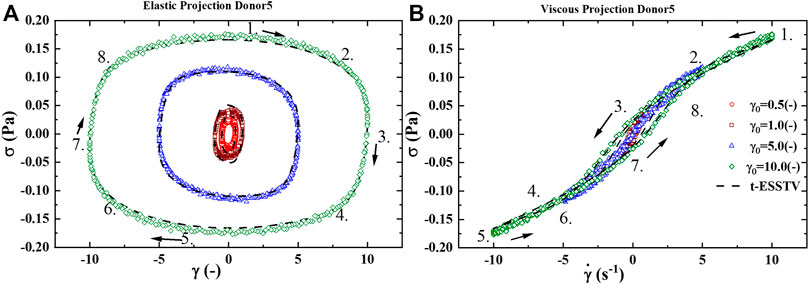
FIGURE 2. (A) Elastic projection, stress vs strain; and (B) Viscous projection, stress vs shear rate of one cycle of oscillatory shear flow at
The tangent:
With the understanding is that the transient elastic modulus, or the instantaneous ‘solid-like’ property of the material is equivalent the partial derivative of stress with respect to strain,
The Frenet-Serret apparatus applied to the TNB (tangent-normal-binormal) frame is consolidated, and shown below in Table 5, 6. We incorporate the elastic moduli,
TABLE 5. Consolidated Sequence of Physical Processes mathematical equations, expressions and relations [47, 50–53].
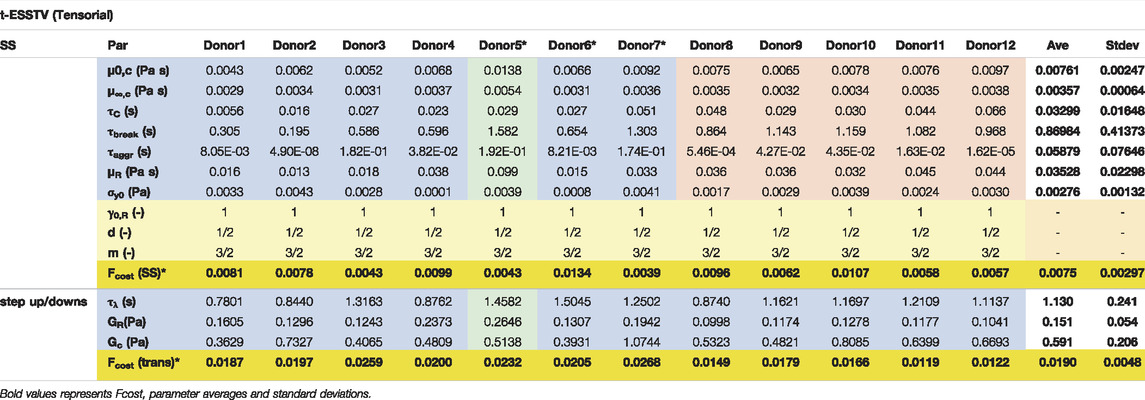
TABLE 6. Best fit t-ESSTV parameter values for Donors 1–10; with average and standard deviations for each (all Fcost values are non-dimensional for comparison and fitting purposes). (*indicate previously unpublished human blood rheology data). Donor 8–12 “Reproduced from [Journal of Rheology 66, 327 (2022); Doi: 10.1122/8.0000346], with the permission of AIP Publishing.”
3.4 Parametric Correlations
Our parametric correlations demonstrated here involve the matrix of all ten donors best t-ESSTV parameter fits, along with the hematocrit (HCT), fibrinogen, (fib.), total cholesterol, triglycerides (tri.), high-density lipoprotein (HDL), and low-density lipoprotein (LDL). The Matlab corrcoef command is invoked, whereby the correlation coefficients, and p-values for the matrix of rheological and physiological parameters are calculated. In addition, we show the average, standard deviation, and 85%, 90%, and 95% confidence intervals are calculated as follows:
4 Results
4.1 Donor 1 Model Fits and Predictions
Figures 3A–E shows the best fit parameter values of Donor1, using the t-ESSTV model. Figure 1A is the steady state and with steady state microstructure prediction, while Figures 3B,C shows the best fit step-ups from an initial shear rate of shear rate of 0.1 s−1 to final shear rates of 1.0, 2.5 and 5.0 s−1 respectively, along with the corresponding microstructure evolution. As expected, with a step-up in shear the microstructure is decreasing. Figures 3D,E shows the best fit step-downs from an initial shear rate of shear rate of 5.0 s−1 to final shear rates of 0.1, 1.0 and 2.5 s−1 respectively, along with the corresponding microstructure evolution. Additionally, we show in Figures 3F,G the evolution of the plastic strain rate and the elastic strain during steps down and up between 5.0 and 0.1 s−1. The plastic strain rate at the shortest and longest times is equal to the applied rates. While the plastic rate changes monotonically during the step down, it displays both increases and decreases during the step up in applied rate. As expected, with a step-down in shear the microstructure is rebuilding. Recall that the parameters are first fit to the non-tensorial version of the model, to obtain a good initial guess. The initial guess is then adjusted by fitting to the tensorial version of the model simultaneously to the steady state and set of three step-up and three step-downs in shear rate experiments. This procedure yielded the fits shown below in Figure 3.
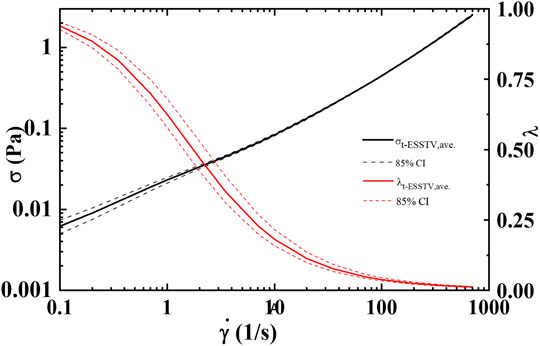
FIGURE 3. Average steady state, rheological fingerprint using ten donors, along with average microstructure (
With the determination of the full set of parameters, shown in Table 6, for Donors 1–12 [46], the model is then used to predict the first normal force, N1 shown in Figure 4A, and the effective times of microstructure aggregation and breakdown comparison in Figure 4B. As is shown in Figure 4B the effective time of shear induced structure breakdown is much shorter than the effective time of shear induced aggregation. The physics of rouleaux evolution are the most interesting result of this research. We can now, using components Eq. 4 explain the dynamics of
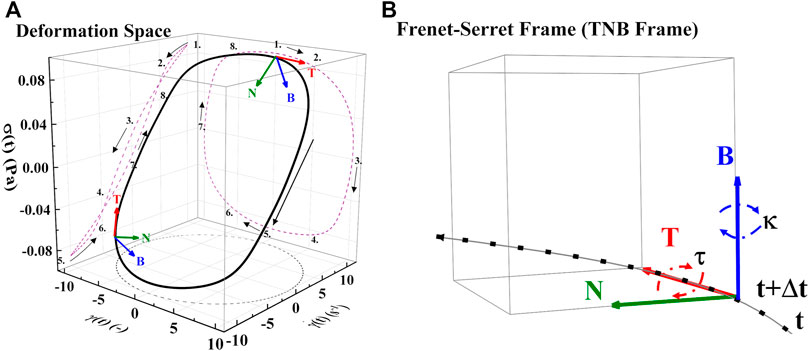
FIGURE 4. (A) Deformation space plotting
Using the t-ESSTV model, a sequence of LAOS and UDLAOS is predicted below, again to demonstrate the efficacy of the t-ESSTV model, shown in Figures 5A,B. With respect to the UDLAOS the strain is now given as
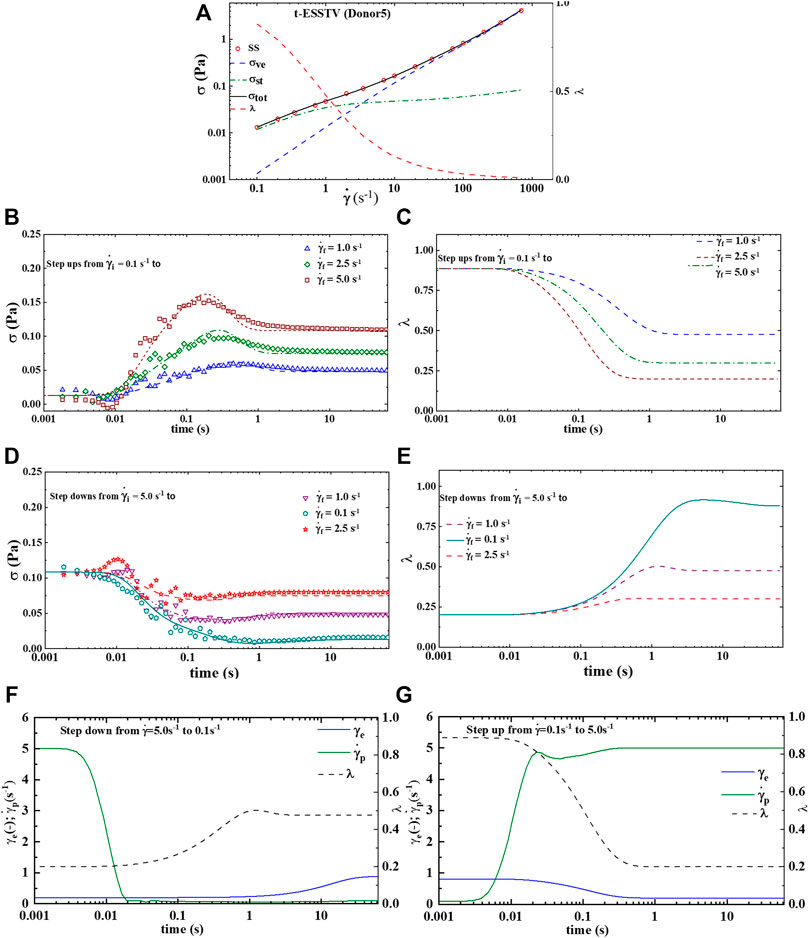
FIGURE 5. t-ESSTV (tensor) model fit for (A) steady state human blood data; (B) set of 3 step up in shear rate from
Figure 5A presents the LAOS predictions as a sequence of elastic (left side) and viscous (right side) projections over
Figure 5B presents the UDLAOS elastic and viscous projections together. Where the same general trends are observed. Keeping in mind that with UDLAOS the flow is only in one direction, therefore there is not as much structural breakdown per cycle, as the oscillatory nature is an addition process contributing to structure breakdown. The UDLAOS merely speeds up and slows down, then speeds up, without changing the direction of flow, more consistent with the dynamics of human blood flow. Figures 6A,B below demonstrates the structural evolution differences, as predicted by the t-ESSTV model, using best fit parameter values of Donor 5, over a single period of LAOS and UDLAOS respectively at
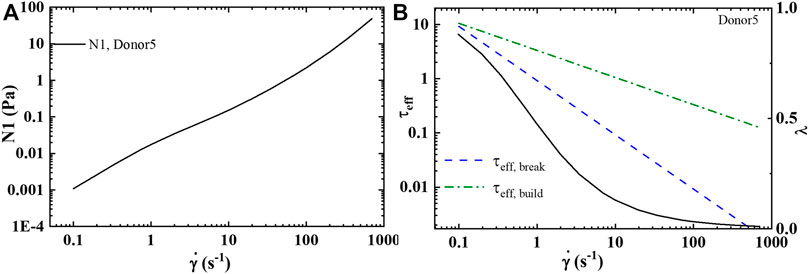
FIGURE 6. t-ESSTV (tensor) prediction of: (A) first normal force difference at steady state; and (B) comparison of the effective rouleaux breakage and effective rouleaux aggregation at steady state (Donor5) [55].
By consolidating all the best fit parameter values from Donor 1–12, shown in Table 5, the parameter averages and standard deviations are computed. Additionally, Table 7 shows the 80%, 85%, and 90% confidence intervals. This allows for a psuedo-determination (albeit with a small number of Donors) of defining left and right limits of mechanically “normal” human blood, over the steady state range of shear rates, shown in Figure 7. Outside of the 90% confidence interval one could medically determine that there is an underlying medical condition requiring additional testing, or analysis.
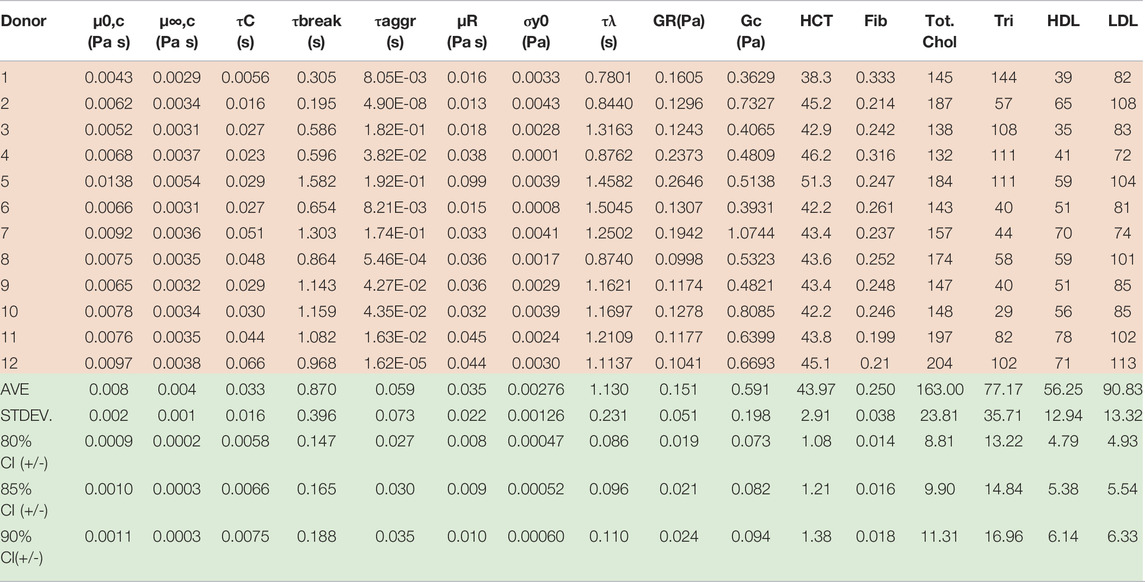
TABLE 7. Donors 1–12 best fit t-ESSTV parameters and physiological parameters.
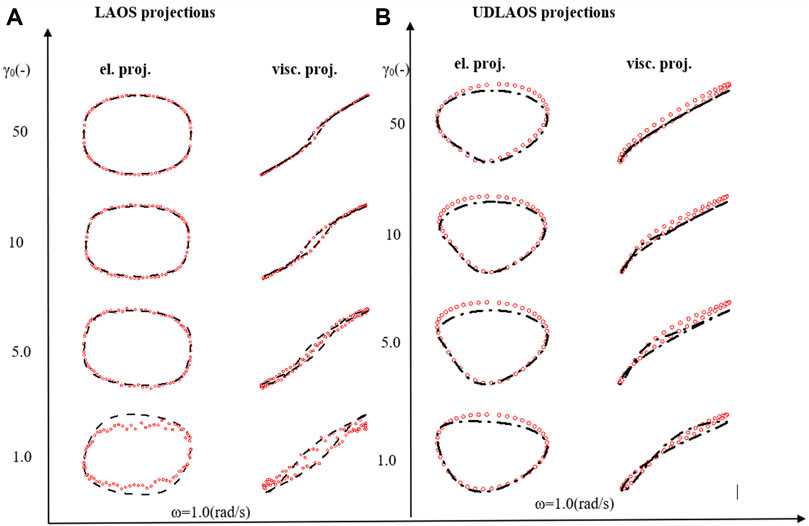
FIGURE 7. (A) Elastic and viscous LAOS; and (B) UDLAOS projections of t-ESSTV (black lines), with data (red circles); from
4.2 Model and Physiological Parameter Correlation
Table 7 below now combines the rheological and physiological parameters of all twelve Donors, along with average, standard deviation, and 80%, 85% and 90% confidence intervals.
Using the first twelve rows of Table 7 above, the correlation matrix is computed with corrcoef command in Matlab. The results are shown below with the correlation matrix and p-values in Table 8. Correlations and p-values highlighted in bold, red numbers are statistically significant (or close) whereby significance is defined as a p-value less than 0.05. This calculation is also a function of the size of the data set. Italicized numbers in Table 8 indicate within 5% of significance. From Matlab, version 2021b: “The p-value is calculated via transformation of the correlation to create a statistic having N-2 degrees of freedom. The confidence bounds are based on an asymptotic normal distribution of
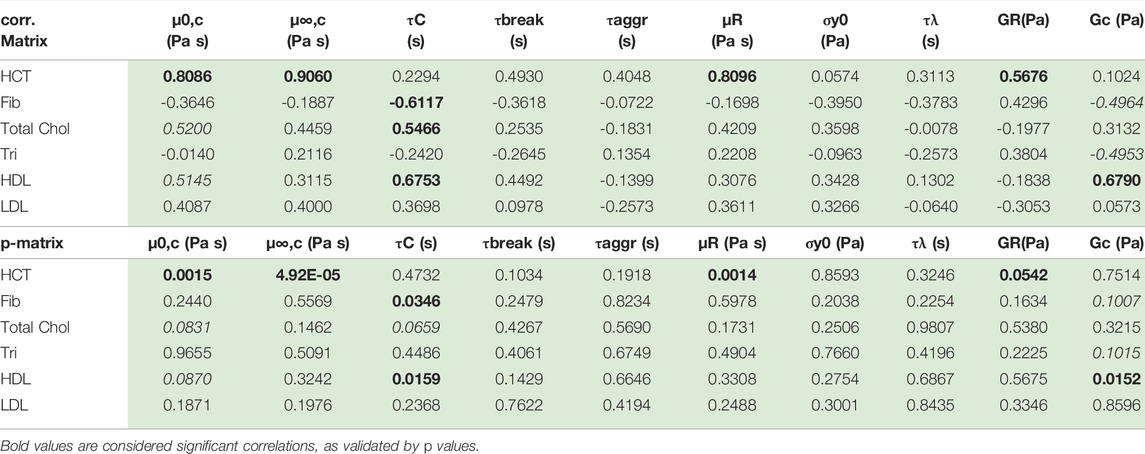
TABLE 8. Correlation and p-value matrix for rheological model and physiological parameters. The red bold font indicates statistically significant correlation; the red italics are weakly correlated.
Table 8 shows that hematocrit possesses a strong correlation with zero shear viscosity, infinite shear viscosity and rouleaux viscosity. Hematocrit is significantly correlated with all three viscosity parameters. This makes sense as the hematocrit is proportional to the volume of blood that is taken up by red blood cells. As the volume of red blood cells increases, all three of the viscosity parameters increase. Total cholesterol and high-density lipoproteins are also correlated with Cross time constant, and elastic modulus of the plasma and individual red blood cells. This is further reflected in a less pronounced, though present correlation between hematocrit and rouleaux elastic modulus. Fibrinogen is negatively correlated (to a small extent) with the Cross time constant and the elastic modulus of the plasma and individual red blood cells. We note that with more Donors, we could strengthen these correlations, and elucidate the ties between rheological and physiological parameters.
4.3 Comparison of Model and SPP Metrics of Microstructure
4.3.1 Donor 5 Mechanical Properties During LAOS
Below, Supplementary Figure S1 shows the transient moduli, and transient phase angle,
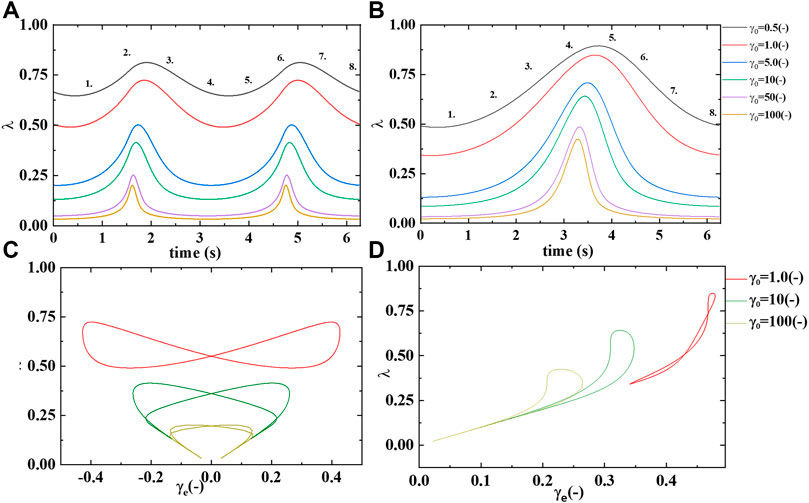
FIGURE 8. Microstructure/rouleaux
Supplementary Figure S2A demonstrates a slow evolution of the transient elastic modulus to softer and softer values as the strain amplitude increases from left to right on the x-axis. While the elastic modulus starts at a relative “soft” value but increases in hardness from point 1 to 2, and again from point 5 to 6 Recall that the transient phase angle,
Supplementary Figure S1B shows the transient viscous, or loss modulus over the same range of strain amplitudes. The figure shows a general trend to thinner blood at the higher strain amplitudes, due to the decreasing presence of microstructure or rouleaux. While at the smaller strain amplitudes the rouleaux are still present, at some level, and contributing to an increase in viscosity. This trend is clearly displayed in Supplementary Figure S1B. More microstructure,
Supplementary Figure S2 below shows a sequence of elastic, viscous and elastic and viscous structural projections. There are three sets of LAOS at alternance shown,
From this we postulate that at the smallest value of strain amplitude we expect there to be relatively more structure, and in turn this structure will overall contribute to larger values of
In Supplementary Figure S3 we show how the stress depends on the elastic strain and the plastic strain rate, as well as the connections between the rouleaux/microstructure
We note here that we can now compare the effect of high hematocrit on the solid-like and liquid-like properties of Donor5 by comparing to the identical figures with the aggregated solid and liquid-like properties of human blood shown in Supplementary Figure S4, below.
4.3.2 Average Human Mechanical Properties During LAOS
The human blood average contour maps shown below were constructed in a similar fashion to Supplementary Figure S1. Supplementary Figure S4 is constructed with the average values of human blood’s transient moduli using 12 Donors, borrowing from previously submitted work for comparison [47]. Supplementary Figure S4C was created using the average parameter values of the ten Donors from Table 6. With the average contour maps available one can compare Donor5’s mechanical properties in terms of hardness/softness and thickness/thinness with that of the “average”. Immediately obvious is the fact that as compared to the average contours below Donor5 has harder, and thicker blood because of the higher-than-average value of hematocrit value of Donor5. We can prognosticate that this could be because that Donor5 has higher hematocrit, and total cholesterol than average here. From previous work it has been shown that the physiological parameters most impacting mechanical properties are hematocrit and total cholesterol [47]. Supplementary Figure S4C,D show a correlation with the SPP prediction of solid-like behavior and the t-ESSTV model prediction of λ, or rouleaux. The t-ESSTV model has allowed for predictions of microstructure that correlate with predictions of increased “solid-like” behavior as computed by SPP.
From this we postulate that at the smallest value of strain amplitude we expect there to be relatively more structure, and in turn this structure will overall contribute to larger values of
Lastly, using the aggregated small amplitude oscillatory shear flow data in terms of
5 Discussion
The full tensor version of the model demonstrated here, t-ESSTV is comprised of thirteen parameters fit simultaneously to steady state with six steps up and down in shear rate. Per previously established methods, three model parameters are fixed with d set to1/2, m set to 3/2, and
In conjunction with the viscoelastic LAOS projections seen in Figure 5, the analysis reveals the relative efficacy of the model at predicting the steady state and transient response of blood under evolving force conditions up to
The better the model’s predictive capability the more accurate the rheological and physiological parameter correlations will be, as well as the more insight that will be provided. It is this comparison that is enabled by our efforts here. Without a robust model, with strong predictive capability of not only the stress, but also the microstructure (rouleaux), the contour maps of mechanical properties could not be compared to a reliable, objective predictor of areas of more structure. It appears from the contour map analysis that the most correlated regions of microstructure,
Lastly, we have compared elastic and plastic metric against the measured stresses in steps up and down in shear rate as well as in LAOS. We have shown that the evolution of the elastic strain and plastic strain rate is non-trivial during steps up and down and can even be non-monotonic. During the largest amplitude LAOS tests, we see in Supplementary Figure S3 that the plastic strain rate and the SPP viscosity are well-suited to a complete description of the stress and microstructural responses. These results provide testable predictions of our model and other models too and lend support for future studies to use recovery rheology protocols that distinguish between recoverable and unrecoverable strains. The recovery measures provide more detailed information than the total strain and total strain rate dependences in isolation, and clearly allow for links to be made between the rheology and the microstructure.
6 Conclusion
In highlighting the development of the t-ESSTV model and its application to the analysis of blood rheology, this effort has demonstrated the model’s predictive capability and efficiency, along with further confirming previously established expectations regarding blood thixotropy. Specifically, regarding rouleaux microstructure, the experimental methods have revealed a few rheological and physiological correlations that inform the current understanding of blood mechanics. Specifically, the model results, when processed with Sequence of Physical Processes, it was observed that a notable positive correlation existed between
Data Availability Statement
The datasets presented in this study can be found in online repositories. The names of the repository/repositories and accession number(s) can be found below: data.Mendeley.com
Ethics Statement
The studies involving human participants were reviewed and approved by University of Delaware IRB. The patients/participants provided their written informed consent to participate in this study.
Author Contributions
All authors listed have made a substantial, direct, and intellectual contribution to the work and approved it for publication. AP, DB, and TK wrote the introduction; and provided motivation for project. SR advised, assisted, and facilitated SPP analysis.
Funding
The authors acknowledge funding assistance from NSF CBET 1510837 which the blood was collected through.
Conflict of Interest
The authors declare that the research was conducted in the absence of any commercial or financial relationships that could be construed as a potential conflict of interest.
Publisher’s Note
All claims expressed in this article are solely those of the authors and do not necessarily represent those of their affiliated organizations, or those of the publisher, the editors and the reviewers. Any product that may be evaluated in this article, or claim that may be made by its manufacturer, is not guaranteed or endorsed by the publisher.
Acknowledgments
The authors acknowledge the support and funding assistance from the U.S. Army, and the Department of Chemistry and Life Science, United States Military Academy. SAR acknowledges support from the NSF through Grant 1847389. Dr. Jeff Horner facilitated the collection of the blood rheological data. Dr. Varchanis facilitated our exploration of models by providing mfiles to solve his model. We acknowledge and thank Dr. Antony Beris of University of Delaware for extremely insightful conversations regarding mechanics of human blood. The views expressed herein are those of the authors and do not reflect the position of the United States Military Academy, the Department of the Army, or the Department of Defense. The authors acknowledge funding assistance from NSF CBET 1510837 which the blood was collected through.
Supplementary Material
The Supplementary Material for this article can be found online at: https://www.frontiersin.org/articles/10.3389/fphy.2022.889065/full#supplementary-material
References
1. Fåhraeus R. The Suspension Stability of the Blood. Physiol Rev (1929) 9:241–74. doi:10.1152/physrev.1929.9.2.241
3. Schmid-Schönbein H, Gaehtgens P, Hirsch H. On the Shear Rate Dependence of Red Cell Aggregation In Vitro. J Clin Invest (1968) 47:1447–54. doi:10.1172/jci105836
4. Merrill EW, Gilliland ER, Cokelet G, Shin H, Britten A, Wells RE. Rheology of Human Blood, Near and at Zero Flow. Biophysical J (1963) 3:199–213. doi:10.1016/s0006-3495(63)86816-2
5. Thurston GB. Viscoelasticity of Human Blood. Biophysical J (1972) 12:1205–17. doi:10.1016/s0006-3495(72)86156-3
6. Dintenfass L. Thixotropy of Blood and Proneness to Thrombus Formation. Circ Res (1962) 11:233–9. doi:10.1161/01.res.11.2.233
7. Beris AN. Hemorheology. In: Wagner NJ, Mewis J, editors. Theory and Applications of Colloidal Suspension Rheology. Cambridge: Cambridge U. Press (2021). p. 316–51. doi:10.1017/9781108394826.009
8. Horner JS, Armstrong MJ, Wagner NJ, Beris AN. Investigation of Blood Rheology under Steady and Unidirectional Large Amplitude Oscillatory Shear. J Rheology (2018) 62:577–91. doi:10.1122/1.5017623
9. Horner JS, Armstrong MJ, Wagner NJ, Beris AN. Measurements of Human Blood Viscoelasticity and Thixotropy under Steady and Transient Shear and Constitutive Modeling Thereof. J Rheology (2019) 63:799–813. doi:10.1122/1.5108737
10. Armstrong M, Tussing J. A Methodology for Adding Thixotropy to Oldroyd-8 Family of Viscoelastic Models for Characterization of Human Blood. Phys Fluids (2020) 32:094111. doi:10.1063/5.0022501
11. Mauer J, Mendez S, Lanotte L, Nicoud F, Abkarian M, Gompper G, et al. Flow-Induced Transitions of Red Blood Cell Shapes under Shear. Phys Rev Lett (2018) 121:118103. doi:10.1103/physrevlett.121.118103
12. Schmid-Schönbein H, Wells R. Fluid Drop-like Transition of Erythrocytes under Shear. Science (1969) 165:288–91. doi:10.1126/science.165.3890.288
13. Schmid-Schönbein H, Wells R, Goldstone J. Influence of Deformability of Human Red Cells upon Blood Viscosity. Circ Res (1969) 25:131–43. doi:10.1161/01.res.25.2.131
14. Chien S. Biophysical Behavior of Red Cells in Suspensions. In: Douglas S, editor. The Red Blood Cell, 2. New York: Academic (1975). p. 1032–133. Chap. 26. doi:10.1016/b978-0-12-677202-9.50019-8
15. Lanotte L, Mauer J, Mendez S, Fedosov DA, Fromental J-M, Claveria V, et al. Red Cells' Dynamic Morphologies Govern Blood Shear Thinning under Microcirculatory Flow Conditions. Proc Natl Acad Sci U.S.A (2016) 113:13289–94. doi:10.1073/pnas.1608074113
16. Minetti C, Audemar V, Podgorski T, Coupier G. Dynamics of a Large Population of Red Blood Cells under Shear Flow. J Fluid Mech (2019) 864:408–48. doi:10.1017/jfm.2019.42
17. Chien S, Usami S, Bertles JF. Abnormal Rheology of Oxygenated Blood in Sickle Cell Anemia. J Clin Invest (1970) 49:623–34. doi:10.1172/jci106273
18. Letcher RL, Chien S, Pickering TG, Sealey JE, Laragh JH. Direct Relationship between Blood Pressure and Blood Viscosity in normal and Hypertensive Subjects. Am J Med (1981) 70:1195–202. doi:10.1016/0002-9343(81)90827-5
19. Yarnell JW, Baker IA, Sweetnam PM, Bainton D, O'Brien JR, Whitehead PJ, et al. Fibrinogen, Viscosity, and white Blood Cell Count Are Major Risk Factors for Ischemic Heart Disease. The Caerphilly and Speedwell Collaborative Heart Disease Studies. Circulation (1991) 83:836–44. doi:10.1161/01.cir.83.3.836
20. Le Dévéhat C, Vimeux M, Khodabandehlou T. Blood Rheology in Patients with Diabetes Mellitus. Clin Hemorheol Microcirc (2004) 30:297–300.
21. Lee B-K. Computational Fluid Dynamics in Cardiovascular Disease. Korean Circ J (2011) 41:423–30. doi:10.4070/kcj.2011.41.8.423
22. Yilmaz F, Gundogdu MY. A Critical Review on Blood Flow in Large Arteries; Relevance to Blood Rheology, Viscosity Models, and Physiologic Conditions. Korea-aust Rheol J (2008) 20:197–211.
23. Sequeira A, Janela J. An Overview of Some Mathematical Models of Blood Rheology. In: Pereira MS, editor. A Portrait of State-Of-The-Art Research at the Technical University of Lisbon. Dordrecht: Springer (2007).
24. Oldroyd JG. On the Formulation of Rheological Equations of State, 200. Royal Society of London (1950). p. 523–41. doi:10.1098/rspa.1950.0035
25. Bird RB, Armstrong RC, Hassager O. Dynamics of Polymeric Liquids: Fluid Mechanics. 2nd ed., Vol. 1. United States: John Wiley & Sons (1987).
26. Beris AN, Edwards BJ. Thermodynamics of Flowing Systems with Internal Microstructure. New York: Oxford Univ. Press (1994).
27. Barnes HA. Thixotropy-A Review. J Non-Newtonian Fluid Mech (1997) 70:1–33. doi:10.1016/s0377-0257(97)00004-9
28. Mujumdar A, Beris AN, Metzner AB. Transient Phenomena in Thixotropic Systems. J Non-Newtonian Fluid Mech (2002) 102:157–78. doi:10.1016/s0377-0257(01)00176-8
29. Dullaert K, Mewis J. A Structural Kinetics Model for Thixotropy. J Non-Newtonian Fluid Mech (2006) 139:21–30. doi:10.1016/j.jnnfm.2006.06.002
30. Mewis J, Wagner NJ. Thixotropy. Adv Colloid Interf Sci (2009) 147-148:214–27. doi:10.1016/j.cis.2008.09.005
31. Saramito P. A New Elastoviscoplastic Model Based on the Herschel-Bulkley Viscoplastic Model. J Non-Newtonian Fluid Mech (2009) 158:154–61. doi:10.1016/j.jnnfm.2008.12.001
32. de Souza Mendes PR. Modeling the Thixotropic Behavior of Structured Fluids. J Non-Newtonian Fluid Mech (2009) 164:66–75. doi:10.1016/j.jnnfm.2009.08.005
33. Dimitriou CJ, Ewoldt RH, McKinley GH. Describing and Prescribing the Constitutive Response of Yield Stress Fluids Using Large Amplitude Oscillatory Shear Stress (LAOStress). J Rheology (2013) 57:27–70. doi:10.1122/1.4754023
34. Dimitriou CJ, McKinley GH. A Comprehensive Constitutive Law for Waxy Crude Oil: a Thixotropic Yield Stress Fluid. Soft Matter (2014) 10:6619–44. doi:10.1039/c4sm00578c
35. Dimitriou CJ, McKinley GH. A Canonical Framework for Modeling Elasto-Viscoplasticity in Complex Fluids. J Non-Newtonian Fluid Mech (2019) 265:116–32. doi:10.1016/j.jnnfm.2018.10.004
36. Wei Y, Solomon MJ, Larson RG. A Multimode Structural Kinetics Constitutive Equation for the Transient Rheology of Thixotropic Elasto-Viscoplastic Fluids. J Rheology (2018) 62:321–42. doi:10.1122/1.4996752
37. Varchanis S, Makrigiorgos G, Moschopoulos P, Dimakopoulos Y, Tsamopoulos J. Modeling the Rheology of Thixotropic Elasto-Visco-Plastic Materials. J Rheology (2019) 63:609–39. doi:10.1122/1.5049136
38. Apostolidis AJ, Armstrong MJ, Beris AN. Modeling of Human Blood Rheology in Transient Shear Flows. J Rheology (2015) 59:275–98. doi:10.1122/1.4904423
39. Horner JS, Beris AN, Woulfe DS, Wagner NJ. Effects of Ex Vivo Aging and Storage Temperature on Blood Viscosity. Ch (2018) 70:155–72. doi:10.3233/ch-170330
40. Armstrong M, Rook K, Pulles W, Deegan M, Corrigan T. Importance of Viscoelasticity in the Thixotropic Behavior of Human Blood. Rheol Acta (2021) 60:119–40. doi:10.1007/s00397-020-01256-y
41. Armstrong M, Pincot A. Integration of Thixotropy into Giesekus Model for Characterization of Human Blood. AIP Adv (2021) 11:035029. doi:10.1063/5.0045578
42. Giesekus H. A Simple Constitutive Equation for Polymer Fluids Based on the Concept of Deformation-dependent Tensorial Mobility. J Non-Newtonian Fluid Mech (1982) 11:69–109. doi:10.1016/0377-0257(82)85016-7
43. Armstrong M, Scully M, Clark M, Corrigan T, James C. A Simple Approach for Adding Thixotropy to an Elasto-Visco-Plastic Rheological Model to Facilitate Structural Interrogation of Human Blood. J Non-Newtonian Fluid Mech (2021) 290:104503. doi:10.1016/j.jnnfm.2021.104503
44. Giannokostas K, Moschopoulos P, Varchanis S, Dimakopoulos Y, Tsamopoulos J. Advanced Constitutive Modeling of the Thixotropic Elasto-Visco-Plastic Behavior of Blood: Description of the Model and Rheological Predictions. Materials (2020) 13:4184. doi:10.3390/ma13184184
45. Armstrong MJ, Milner E, Nguyen C, Corrigan T. Lee YF Visualizing and Exploring Nonlinear Behavior, Timescales, and Mechanical Signatures of Human Blood. Biorheology (2021) 58:1–26.
46. Armstrong M, Pincot A, Jariwala S, Horner J, Wagner N, Beris A. Tensorial Formulations for Improved Thixotropic Viscoelastic Modeling of Human Blood. J Rheology (2022) 66:327–47. doi:10.1122/8.0000346
47. Armstrong MJ, Amaru A, Zlotnick A, Pincot A, Brown T, Milner E. Using Rheological Modeling and Mechanical Property Analysis to Characterize, Interrogate, Compare and Develop Metrics of Normal Human Blood. In: European Journal of Mechanics B/Fluids (2022). submitted: (4FEB2022), manuscript no.: EJMFLU-D-22-00050.
48. Beris AN, Horner JS, Jariwala S, Armstrong MJ, Wagner NJ. Recent Advances in Blood Rheology: a Review. Soft Matter (2021) 17:10591–613. doi:10.1039/d1sm01212f
49. Armstrong MJ. Investigating and Modeling the Thixotropic Behavior, Rheology of Complex Material. Newark: University of Delaware (2015). Ph.D. Thesis.
50. Rogers SA. A Sequence of Physical Processes Determined and Quantified in LAOS: An Instantaneous Local 2D/3D Approach. J Rheology (2012) 56:1129–51. doi:10.1122/1.4726083
51. Rogers SA. In Search of Physical Meaning: Defining Transient Parameters for Nonlinear Viscoelasticity, Rheo Acta (2017) 56:501–25. doi:10.1007/s00397-017-1008-1
52. Donley GJ, de Bruyn JR, McKinley GH, Rogers SA. Time-resolved Dynamics of the Yielding Transition in Soft Materials. J Non-Newtonian Fluid Mech (2019) 264:117–34. doi:10.1016/j.jnnfm.2018.10.003
53. Donley GJ, Hyde WW, Rogers SA, Nettesheim F. Yielding and Recovery of Conductive Pastes for Screen Printing. Rheol Acta (2019) 58:361–82. doi:10.1007/s00397-019-01148-w
55.dataset1 Armstrong MJ, Horner J. Rheology Data of Human Blood JUN18 (2020). SAOS, Step up/down, LAOS, UDLAOS, Cessation of flow with ARESG2 Mendeley. doi:10.17632/948ffnypjs.1
56.dataset2 Armstrong MJ, Horner J. JUL18 SS, SAOS, LAOS, Triangle Ramp, UDLAOS 0 and 24 Hours (2020). doi:10.17632/fspcyx4t5p.1
57.dataset3 Armstrong MJ. DEC17 ARESG2 Human Blood Rheology: SS, SAOS, LAOS, STEPS, Etc. (2020). Mendeley. doi:10.17632/d43r5ydpx8.1
58.dataset4 Armstrong MJ, Horner J. FEB18 Blood Rheology ARESG2 SS, SAOS, LAOS, Steps (2020). Mendeley Data, v1. doi:10.17632/jdzpx6hy6r.1
59.dataset5 Armstrong MJ, Horner J. APR18 SS SAOS LAOS & UDLAOS of Human Blood (2022). Mendeley Data, v1. doi:10.17632/6jjryg2f8v.1
60.dataset6 Armstrong MJ, Horner J. MAR19 SS, Steps, SAOS, LAOS, UDLAOS Human Blood (2022). Mendeley Data, v1. doi:10.17632/6dx72mxmy9.1
Keywords: thixotropic, viscoelastic, rheology, model, plastic
Citation: Armstrong M, Pincot A, Rogers S, Knight T and Bailey D (2022) Recent Advances in Biofluid Mechanics and Bio- and Hemorheology Collating Recent Advances in Predicting Complex Behavior of Human Blood With Thixo-Elasto-Visco-Plastic Models and Sequence of Physical Process. Front. Phys. 10:889065. doi: 10.3389/fphy.2022.889065
Received: 03 March 2022; Accepted: 19 April 2022;
Published: 27 June 2022.
Edited by:
Yannis Dimakopoulos, University of Patras, GreeceReviewed by:
Georgios C. Georgiou, University of Cyprus, CyprusGeorgios A. Kelesidis, ETH Zürich, Switzerland
Copyright © 2022 Armstrong, Pincot, Rogers, Knight and Bailey. This is an open-access article distributed under the terms of the Creative Commons Attribution License (CC BY). The use, distribution or reproduction in other forums is permitted, provided the original author(s) and the copyright owner(s) are credited and that the original publication in this journal is cited, in accordance with accepted academic practice. No use, distribution or reproduction is permitted which does not comply with these terms.
*Correspondence: Matthew Armstrong, bWF0dGhldy5hcm1zdHJvbmdAd2VzdHBvaW50LmVkdQ==