- 1Department of Mechanical Engineering, University of Cape Town Rondebosch, Cape Town, South Africa
- 2Centre for Research in Computational and Applied Mechanics (CERECAM), University of Cape Town Rondebosch, Cape Town, South Africa
Computational models of deep vein thrombosis (DVT) typically account for either the mechanical or biochemical factors involved in thrombus formation. Developing a model that accounts for both factors will improve our understanding of the coagulation process in this particular disease. The work presented in this study details the development of a CFD model that considers the biochemical reactions between thrombin and fibrinogen, pulsatile blood flow, and clot growth within a three-dimensional patient-specific common femoral vein. Thrombin is released into the bloodstream from an injury zone on the wall of the vein. The Michaelis–Menten equation is used to represent the conversion of thrombin and fibrinogen to fibrin, the final product of the coagulation process. The model development starts with a two-dimensional idealized geometry. At this stage, the model is used to conduct a parametric study to determine the effects of varying parameters such as inlet velocity, vein diameter, and peak thrombin concentration on the size and shape of the clot formed. Peak thrombin concentration is the key factor driving the initiation and propagation of clots in the vein. To demonstrate the potential use of the model, the two-dimensional model is then extended to an image-derived three-dimensional patient-specific geometry. Realistic clot growth was achieved using this model, and the clot was compared to a clot formed in vivo. The volume of the clot that formed in the patient was about 4% smaller than that formed in the simulation. This demonstrates that with further development and refinement, this model could be used for patient-specific interventional planning. The model provides a means for predicting clot formation under different physiological conditions in a non-invasive manner.
1 Introduction
Deep vein thrombosis (DVT) is the formation of a blood clot within the deep veins, usually in the leg and sometimes in the arms or cerebral network [1]. In severe cases, the clot can break loose from the vessel walls and become trapped in smaller vessels, leading to thromboembolic diseases such as pulmonary embolism (PE) [2]. Over 200,000 people suffer from DVT (annually) in South Africa and about 60% of these cases lead to embolisms, while 10% are fatal [3–5]. Little research quantifying the impact of DVT on South Africa’s economy has been conducted. Studies from high-income countries have shown its impact to be significant [3]. The most common risk factors are HIV, tuberculosis, smoking, and recent hospitalization [6].
Detecting DVT before embolism is essential. Wells et al. developed a widely used DVT detection model that predicts pre-test probability for DVT [7]. The model calculates a score which takes pre-existing conditions such as cancer and pregnancy, as well as physically noticeable features such as a swollen leg, into account. Due to the risk of potential PE, above-knee cases are treated with anticoagulants such as unfractionated heparin (UFH) and low–molecular-weight heparins (LMWH) [8, 9]. Kesieme et al. explained that the efficacy of heparin is dependent on the ability to administer the right dosage within the first 24 h [9].
Existing detection and treatment procedures are invasive and expensive. The drugs are administered at dosages that are not necessarily patient-specific. It would be beneficial to develop more accurate and cost-effective methods for detecting and treating DVT. Predicting embolism events in cases of early-diagnosed DVT is equally important. With the development of CFD, the flow and biochemical aspects of blood flow in the vein can be simulated to create models with the potential to improve the information available to clinicians for specific patients. Drug testing is another application of CFD model development, where the dosage of anticoagulants can be estimated on a patient-specific level [10]. The model should have the ability to vary biochemical concentrations to simulate the specific patients’ conditions.
Successful attempts to model thrombosis using computational methods (mainly CFD) have been made. Platelet models focus on the platelet adhesion, activation, accumulation, and aggregation to model clot formation [11–13]. Coagulation network models account for the reactions involved in clot formation using mathematical equations [14]. The reaction-mass model couples the blood flow with the biochemical reactions and studies their effects on each other [15–18]. Integrated models are more developed, accounting for the hemodynamic, platelet, and coagulation reactions. Most of these models are developed in idealized geometries and do not account for the complex geometries of the vessels or mechanical agents such as valves.
To reduce the computational cost, many of the models are simplified by making significant assumptions regarding the clotting outcomes. Most in silico DVT models are flow-based, predicting clot formation from stagnation or vortices resulting from the veins’ complex geometry or obstructions [19]. Most models assume the pulsatile blood flow to be steady [14]. Although this assumption has been proven to be acceptable to a degree regarding the clotting outcomes, there is a need to further investigate how this assumption affects the initiation and propagation of clot growth under flow [14, 20–23].
Thrombosis models that capture complex biochemistry have also been presented. Xu et al. developed a multiscale model of thrombosis used to show the relationship between the blood flow rate and the clot size [24]. The model breaks down the coagulation process into sub-models. The Navier–Stokes equations account for the macroscale dynamics of blood flow. The microscale interactions between platelets, fibrinogen, and the vessel wall are described using the cellular Potts model. The Mann model accounted for the biochemical processes which are described using partial differential equations. The interaction between the blood haemodynamic and biochemical reactions and the effects on the thrombus growth in an idealized three-dimensional cylindrical geometry was studied by Bodnar and Sequeira [18]. They applied a network of 23 advection–diffusion–reaction equations to describe the changes in biochemical concentration and transport of enzymes. At higher fluid shear rates, platelet adhesion is facilitated by the von Willebrand factors (vWF) [25]. This led to the development and validation of a predictive model of thrombus growth under the high shear rate by Mehrabadi et al. The model allowed flow under constant pressure or a volumetric flow rate in a cylindrical channel [26]. Xu et al. studied the deformation and embolization of a growing clot under shear flow conditions using a multi-phase model. The Navier–Stokes equations and the Cahn–Hilliard equations were used to describe blood flow and deformation of the clot. It was assumed that the blood clot has two components, namely, the core and the shell. The volume fraction of platelets to plasma was 0.7:0.3 in the core and 0.3:0.7 in the shell. This model provided a quantifiable relationship between clot permeability and likelihood of embolization [27].
While there are numerous computational models of thrombosis, those focusing solely on DVT are limited. One of the earliest models was developed by Ramunigari et al. Their model captures unidirectional blood flow in a vessel with venous thrombosis present, thereby accounting for the haemodynamic effect of the obstructing thrombus [28]. Fortuny et al. developed a patient-specific DVT model. The model simulates blood flow in a realistic popliteal vein geometry generated from in vivo CT images. The effects of anticoagulants on blood flow around the thrombotic area were studied by varying the blood viscosity as a result of the anticoagulants [27, 29].
Venous valves, an important feature of the vessels where DVT develops, enable flow toward the heart but restrict backflow. Malfunction of the valves can cause significant problems to the blood dynamics. Introducing CFD to medical imaging makes non-invasive studies of the operations of valves possible. A model was developed by Ibrahim et al. to study valve openings in the popliteal vein and their effects on blood flow [30]. The valve opening was varied, and the size of the static zone and vorticity were investigated. Their model showed the possibility of clot formation around the valves in an idealized geometry. Nomehrda et al. and Ohashi et al. developed numerical models to study the flow pattern around the valve’s leaflets [31, 32]. The sinus was predicted to regulate flow. The model was validated with a flow experiment. Naracott et al. and Buescher et al. adopted this experiment and studied the effect of varying the sinus depth on the flow [33, 34]. The effect of DVT on venous valves and the implication of valve failure on blood circulation were studied by Simao et al. Their model applied a finite element method (FEM) with particular boundary and element characterizations to solve the fluid–solid interactions’ (FSI) governing equations. Blood is considered a non-Newtonian fluid under laminar flow, and the wall is considered a flexible material. Their model indicates that a clot forms during abnormal valve functioning [35]. A recent model of valve activities was developed by Hajati et al. [36]. The model applied knowledge from previous studies and was used to investigate the blood flow through the venous valve, taking the vein wall and valve leaflet’s flexibility into account. FSI was applied by solving the governing equations using a Galerkin approach for the FEM.
Experimental clot growth is another important method for visualizing and studying thrombosis under different conditions. Lurie et al. carried out an experiment to understand the mechanism of venous valves on blood flow. Duplex ultrasound was used to probe venous valves of patients with no history of venous disease. The time relationship between the valve movement and blood flow was investigated [37]. An in vitro thrombosis model was developed by Narracott et al. using hypercoagulable milk to represent blood to study clot growth in an idealized cerebral aneurysm geometry [38]. Ovanesov et al. achieved clot growth in vitro by introducing human tissue factor expressing cells into non-flowing human plasma [39]. Onasoga-Jarvis et al. improved on this experiment by growing clots under flow in a hydrodynamic focusing microfluidic device. Varying the shear rate, the experiment was used to investigate the haemodynamic conditions under which fibrin formation occurs [40]. Neeves et al. studied the nature of fibrin mesh formed during thrombosis under flow. Thrombin was introduced into a flow of fibrinogen through a microfluidic membrane [41]. Another in vitro model was developed by Prashad et al. to study clot lysis due to thrombolytic drugs. Whole blood from a healthy human was used to grow clots in a pre-weighed sterile tube, and the clot is weighed before and after drug administration. The intended purpose of this method is to provide a quick and efficient way of observing the effects of newly developed drugs on patient-specific thrombosis [42]. All these models and methods contribute to an improved understanding of the clotting process in DVT. However, few models have managed to capture clot formation and the changing biochemical conditions in complex flow, and none of the models have taken the effect of venous valves into account.
This study presents the developmental process of a three-dimensional DVT computational model in idealized and realistic common femoral vein (CFV) geometries. The model accounts for the reaction between thrombin and fibrinogen under pulsatile blood flow, leading to clot formation within the vessel. The difference in mechanical properties between the flow region and the clot region is accounted for by changes in porosity and permeability. The model is verified using a clot growth experiment. The model is developed in three stages. The first stage presents a two-dimensional physiological model of DVT. This model is used to investigate clot growth under different thrombin inlet boundary conditions. The two-dimensional model is also used to carry out a parametric study to determine the effects of varying the inlet velocity, vein diameter, and thrombin concentration on the shape and size of the clot formed. The two-dimensional model is extended to an idealized three-dimensional geometry. This work depicts the development process with increasing model complexity. The computational model is verified using results from an experimental clot growth study. The experiment comprises a steady flow of fibrinogen in a cylindrical pipe and thrombin injected into the flow at the injury site. A qualitative comparison is made between the experimental clot and the in silico clot. The validated three-dimensional model is used to compare clot formation under steady and pulsatile conditions, taking valve activity into account. The model is then applied to a realistic patient-specific geometry, and the clot formed is compared to the clot formed under physiological conditions.
2 Materials and Methods
2.1 Model Development Methods
The two-dimensional and three-dimensional models were developed and simulated in ANSYS Fluent (ANSYS, NH, United States). To simulate clot growth in DVT, three major systems are designed to work side by side. ANSYS Fluent v19.2 solved the flow of blood in the vein using the Navier–Stokes equations. The biochemical reactions that account for clot initiation and propagation were solved using transport equations that keep track of the concentration of each biochemical protein species. The mechanical effect of the clot on the flow field was accounted for by varying the porosity and permeability values. Similar methods are applied to both the two-dimensional and three-dimensional models. This section depicts these methods and how they are implemented in the models. The geometries used, the boundary conditions, and studies carried out with each model are also described.
2.1.1 Fluid Flow
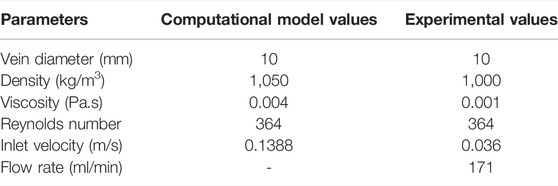
Blood in the vein was modeled as an incompressible Newtonian fluid. It is understood that physiological blood exhibits non-Newtonian properties; however, the size of the vein considered in this study is considered large enough to assume that the non-Newtonian properties are negligible [43]. Blood flow in the vein was solved in ANSYS Fluent using the Navier–Stokes equations. The equations used are detailed in the supplementary material. Blood is assigned a constant density of 1,050 kg/m3 and a constant dynamic viscosity of 4 × 10⁻³ kg/ms. Blood flow in the two-dimensional model was non-pulsatile for simplification. With increasing model complexity, pulsatile flow incorporated with valve activity was included in the three-dimensional models.
2.1.2 Biochemical Reactions
Modeling clot initiation and propagation is an important part of this study. The concentration of the protein species (thrombin, fibrinogen, and fibrin) are represented as scalars flowing through the vein geometry as done by Bodnar and Sequeira [18]. This work focuses on the reaction between thrombin and fibrinogen, which results in the formation of fibrin. A convection-diffusion transport equation is used where the thrombin and fibrinogen are delivered at the specified boundaries; they diffuse and react with one another and fibrin concentration in those cells increases. The reaction between the proteins is described using the Michaelis–Menten kinetic equation (Eq. 1).
where kcat is the catalytic rate constant and Km is the Michaelis constant. A positive source term was used to describe the formation of fibrin and a negative source term describes the corresponding consumption of fibrinogen. Table 1 describes the values of the biochemical species and reaction constants used in this study. The equations are implemented in Fluent using a user-defined function (UDF).
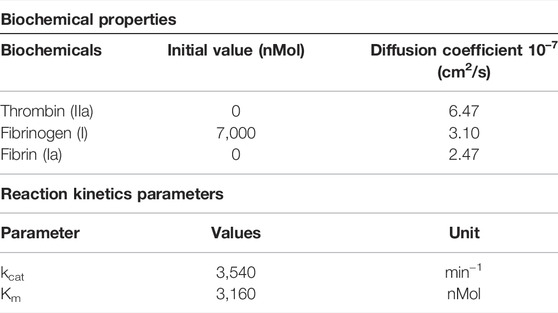
TABLE 1. Biochemical properties and values used for the reaction kinetics [18].
For all the models, clot formation does not occur under normal flow until an activation threshold in the flow domain is exceeded. In this work, clot formation is linked to thrombin concentration which is introduced into the flow as a flux through the injury site on the vein wall. For clot formation to occur in a cell, thrombin concentration in that cell must be more than the threshold value. Another condition set for clot formation is that the computational cell must be at the injury site or the neighbor to an already clotted cell. This avoids the formation of islands where clots randomly form inside flow. The thrombin concentration used was derived from a calibrated automated thrombogram (CAT) by Hemker et al. [44]. Kremers et al. defined the thrombin generation curve, as shown in Eq. (2) [45]. The equation describes the increase in thrombin generation until a peak value P is reached, followed by a gradual decrease in thrombin generation due to anticoagulant mechanisms. Under conditions of flow, thrombin will also gradually reduce as a result of mechanical removal.
where P is the peak thrombin concentration, ETP is the endogenous thrombin potential, TTP is the time to peak, h is a constant = 2.7272, and t is the time in seconds.
2.1.3 Porosity and Permeability
Clot growth inside the vein can be simulated in various ways. Bodnar and Sequeira modeled clot formation by assigning the clotted region a different porosity and/or permeability value from the rest of the flow [18]. This is a fairly accurate representation of fibrin clots, which are naturally porous [46]. The porosity and permeability values used in this work were derived from the study by Diamond and Anand [47]. The fibrin concentration increases as fibrinogen is consumed. A UDF is used to gradually change the porosity of the computational cell from 1 to 0.5 after the fibrin concentration exceeds a threshold value, and the permeability also changes from
2.1.4 Valve Activity
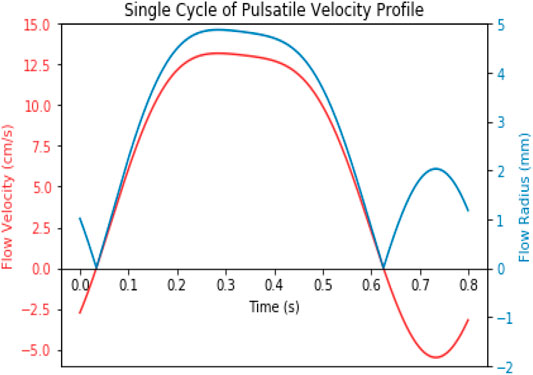
To orient the model toward patient specificity, physiological pulsatile flow is implemented at the inlet boundary. Data based on venous sonography of the right CFV, performed by Selis and Kadakia, is used for this study [48]. The velocity data are digitized using an open-sourced plot digitizer package [49]. An equation describing the digitized waveform was generated in Microsoft Excel using a Fourier transform curve fitting method. The processes are described in depth in the Supplementary material. The valve activity in the vein plays an important role in thrombosis. This model applies a variation of the model presented by Hajati et al. The inlet velocity is a sine function simulating the opening and closing of the valves in the vein by changing the inlet flow diameter with time [36]. Figure 1 shows the comparison between the flow velocity and the valve opening during one heartbeat cycle. The valve opening allows blood flow until a maximum velocity is reached and then velocity reduces steadily. The first cusp movement occurs after this, and the sinus increases as the valve closes. In the recording of the data, the patient’s valve malfunctioned, causing some backflow of blood at the end of each cycle.
2.2 Model Development and Implementation
The methods described above are applied in developing the experimental, two-dimensional, and three-dimensional models. This section describes each model including the setup and studies carried out with them. For this study, the PISO solver scheme was used to solve the pressure–velocity coupling with skewness and neighbor correction factors of 1, enabling an efficient solution of the porous media problem. For this work, the model was initially applied to the two-dimensional geometry in order to conduct initial parameter tests at reduced computational cost.
2.2.1 Two-Dimensional Model
The two-dimensional model accounts for blood flow, transport of thrombin, clot growth, and its impact on flow. The model is simplified and will serve as a framework to develop more complex models. Simplifying the model made it possible to study the effects of changing important parameters on clot formation. A rectangular geometry with an injury zone covering 50% of its length and a width within the diameter range (9.7–12 mm) for a healthy CFV was designed on ANSYS Spaceclaim. An element size of 0.49 mm was applied as the simulation was found to be grid independent at this size. The outlet was set to have a constant zero gauge pressure which creates a gradient that drives flow through the vein. An approximate Reynolds number of 380 was achieved at the inlet. Thrombin is introduced at the injury site according to the thrombogram. Clot growth/fibrin formation takes place in computational cells that satisfy a thrombin threshold concentration of 10 nM and a strain rate below 132 s-1. A steady parabolic velocity was applied at the inlet, and the model simulated a time interval of 300 s.
The first study carried out with this model investigated the difference in thrombin concentration when thrombin is introduced into the flow as a flux or constant value. This was achieved by running two similar tests with concentration point probes at increasing distances from the injury zone. The peak thrombin concentration through the geometry was also monitored. The test was carried out on Geometry 1. The parametric study carried out with this model is described by varying the values of the inlet velocity, vein diameter, and peak thrombin concentration within a physiological range from the literature. The effects of changing these parameters on the size and shape of the clot formed are investigated. Table 2 indicates all the simulations conducted and their corresponding input parameters. The notation G(1, 2, 3)_T(L, M, H)_V(L, M, H) indicates geometry (G) (1, 2, or 3); thrombin concentration (T) (low, middle, or high); and velocity (V) (low, middle, or high).
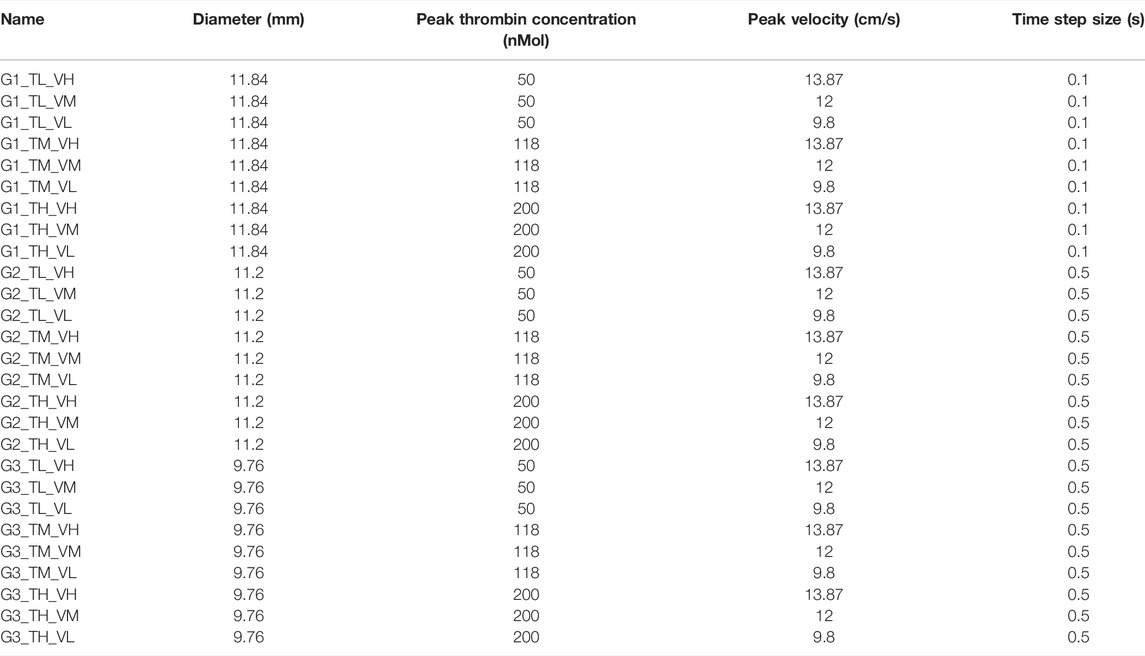
TABLE 2. Simulation names and the parameters used for each simulation carried out in this study (2d simulation). With the notation G(1, 2, 3)_T(L, M, H)_V(L, M, H) indicating the geometry(G) being 1, 2, or 3, thrombin concentration (T) and velocity (V) being low, middle, or high.
2.2.2 Three-Dimensional Model
The two-dimensional model is extended into a three-dimensional domain in an idealized cylindrical vein with the same diameter as the two-dimensional model. The model complexity was then gradually increased by adding one or more features to the preceding model. The simulation was designed to operate until the clots in each model are fully developed. Table 3 shows the models applied on the three-dimensional geometry and the corresponding features. Model_1 has the same feature as the two-dimensional model. A time step size of 0.0025 s and element size of 0.4 mm was used as the simulation was found to be grid independent under these conditions (refer to supplementary material for grid independence study). For models that have pulsatile flow without valve activity, the inlet flow diameter was kept constant. The thrombin threshold value used in the two-dimensional model was used in these models. Clot formation in Models_4, 5, and 6 is initiated when fibrin concentration reaches a threshold value of 1000 nMol. To ensure compliance with physiological values, the concentration was limited to a maximum of 1000 nMol, and fibrinogen concentration was limited to a minimum of 0.1 nMol.

TABLE 3. Simulations carried out to study the clot initiation and propagation as the complexity of the model increases (3D simulation).
2.2.3 Experimental Verification
After developing the three-dimensional model, the results were verified using an experimental clot growth study where clot growth is achieved in an experimental environment replicating the computational model parameters. This approach is similar to that used by Ngoepe et al. [22].
To begin the experiment, physical parameters were determined. The experimental Reynolds number was matched with the computational model as seen in Table 4. A different computational simulation was performed to account for these changes. The simulation had the same biochemical and mechanical properties as the experiment and keeps the clot formation process from the model. Fibrinogen from human plasma 50–70% protein with ≥80% of clottable protein (Sigma Aldrich, Saint Louis, MO, United States) in powder form with a solubility of 10 mg/ml was diluted in Dulbecco’s Phosphate Buffered Saline (Sigma Aldrich, Saint Louis MO United States) to a concentration of 100 mg/L. The magnesium and calcium in the saline improve cell binding and clumping needed in clot formation. At the specified flow rate, thrombin with a constant concentration of 120 nMol is injected into flow of fibrinogen with a concentration of 200 nMol.
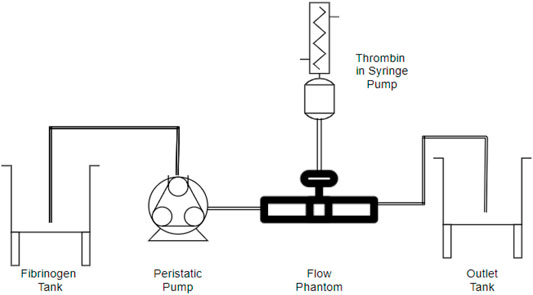
The experimental setup shown in Figure 2 includes the following parts and devices: a flow phantom, a 10-mm ID clear PVC pipe with a length of 80 mm with a 1-mm hole 40 mm from the inlet, a Masterflex® L/S variable speed analogue console peristaltic pump, a NE-300 Just Infusion™ Syringe Pump, and a Leica V-Lux 5 digital camera. Fibrinogen flows through the inlet for about 10 s, and then thrombin is injected into flow as a fluid from a 1-mm hole drilled at the top of the flow phantom as opposed to as a flux. The reaction between these biochemical species enables fibrin formation, which leads to clot formation in the phantom.
2.2.4 Patient-Specific Model
Geometry segmentation and reconstruction were important stages of developing a patient-specific DVT model. For this study, the vein geometry was extracted from a CT scan of a 40-year-old male patient. The CT scan images were downloaded from Radiopedia.org, an open-edit educational radiology repository [50]. To develop the 3D geometry from the CT image, the images underwent segmentation using SYNOPSYS Simpleware Software (SYNOPSYS, California, United States). To make segmentation easier and less complex for Simpleware, the images were converted from the 3D image with pixel value (R, B, G) into a grayscale image. As a result of image noise in some slices, the applied threshold value of 200 did not accurately account for the CFV. On vein and clot surfaces, a Fourier smoothing function of order 10 was applied to eliminate the ragged finish generated as a result of the high segmentation spacing. Detailed images of the segmentation process are presented in the Supplementary material. From the data given, the clot on the left CFV was identified and the right CFV was developed and served as the control. The result generated by the model was compared to the clot formed under physiological conditions. The three-dimensional model at its most complex stage was applied on the right CFV. First, a steady-state simulation was performed to determine areas with recirculation, stagnation (<0.001 m/s), and/or low strain rate (<100 s−1). A UDF was included in the model to ensure that the clot initiates only in cells that have met this threshold requirement.
A transient simulation was then performed on the geometry with thrombin introduced at these cells. Fibrinogen with a concentration of 7000nMol was introduced at the inlet. A time step size of 0.0015 s and an element size of 0.4 mm were used as the simulation was found to be grid independent under these conditions. Although it is understood that the vein is flexible and movement of the patient changes the vein geometry, a rigid wall assumption was used to predict the size and shape of the clot for a fixed patient position. To further reduce computational cost, clot formation was examined after 100 s.
3 Results
The results for the two-dimensional, three-dimensional, experimental, and patient-specific models are described below.
3.1 Two-Dimensional Model Results
The study investigating the differences between introducing thrombin into flow as flux or value yielded results shown in Figure 3. Figure 3 shows the thrombin concentration reduces as the distance from the injury site increases. The model showed that the thrombin generation method does not influence the isotropic diffusion of thrombin. Thrombin diffusion was the same for both cases. The major difference between the methods is the concentration of thrombin generated. When the value method is applied, thrombin at the injury site was the exact amount defined by the generation profile equation. Figure 3 shows the maximum thrombin concentration in both cases on a logarithmic scale. Thrombin concentration when the flux method is applied followed the profile over time, but the amount is higher than the set value. Neeves et al. proposed that thrombin generation under physiological conditions should be introduced as a flux [41]. In developing the model with thrombin flux generation, alterations shown in Eq. 3 were made to the generation profile equation to adjust the amount of thrombin generated and keep it within the physiological range.
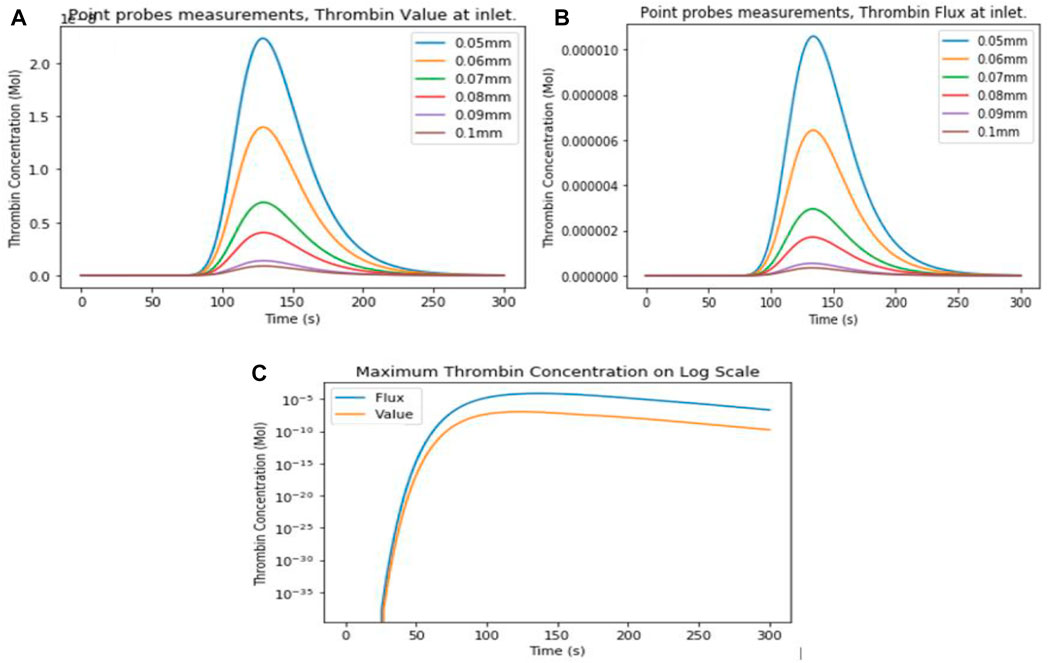
FIGURE 3. Two-dimensional model point probes measuring thrombin concentration at different distances from the injury site for (A) value and (B) flux boundary conditions at the thrombin inlet. (C) Comparison of maximum thrombin concentration in the vein between both boundary conditions on a logarithmic scale.
The parametric study showed that an increase in vessel diameter resulted in a smaller clot as illustrated in Figure 4. The vessel diameter does not affect the shape or manner in which the clot propagates. In this study, the effect of an increase in diameter on clot initiation in an idealized geometry is barely noticeable when compared to geometries with complex flow patterns (which are known to provide favorable conditions for thrombosis) [51]. The clot size decreased with an increase in velocity. The effect of velocity on clot size is determined by the rate at which thrombin is being transported away from the injury site. Blood velocity also determines the extent to which the clot grows downstream. Thrombin peak concentration proved to be the most important factor affecting thrombosis in the model as it affects both the initiation time and the size of the clot formed. Clot initiation occurs earlier in the case with lower thrombin peak concentration. The size of the clot increases as the peak thrombin concentration increases. This result is validated by work done by Wolberg et al. The group proved that high peak thrombin concentration produces larger, dense networks of fibrin fibers that are susceptible to lysis [52, 53]. Although the model developed does not account for the fibrin network, it successfully predicts the clot sizes. In all cases, the clot is fully formed and completely covers the injury site after 300 s.
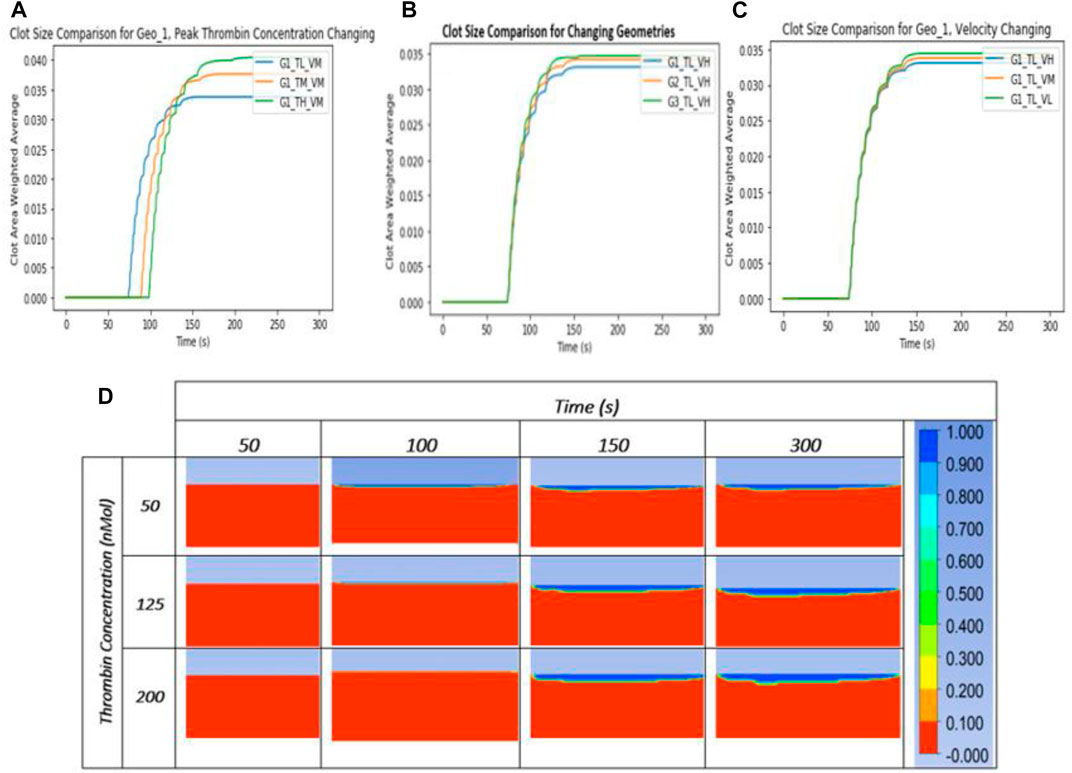
FIGURE 4. Graphs comparing the size of clot in the two-dimensional model formed for variations of (A) peak thrombin concentration, (B) vein geometry, and (C) blood velocity over 300s. (D) Clot contour plot comparing cases with different thrombin concentrations. A scalar tracking the clotted area changes from zero to one when the area has fully clotted.
3.2 Three-Dimensional Model Results
For all the cases, clot initiation disrupts the velocity field by reducing the velocity in the clotted region toward zero, causing a corresponding decrease in the strain rate inside the clot and an increase on the surface of the clot. The clot begins to form at the downstream end of the injury zone where thrombin concentration is at its maximum and propagates toward the inlet over time. Figure 5 shows the change in biochemical concentration over time. The strain rate was almost three times higher in Model_3 than in Model_2, as shown in Figure 6, due to the change in flow diameter as the valve opens and closes. This causes recirculation around the inlet. An increase in the maximum strain rate was noticed in models 1 and 2 after clot formation; however, no significant increase was noticed in Model_3. Clot initiation in Model_1, Model_2, and Model_3 occurred at 89.1 s, 88.7 s, and 88.8s, respectively, and propagation ended at 180.32 s, 231.2 s, and 235.2 s, respectively, as shown in Figure 7. Before clot initiation, the maximum strain rate in the vein was constant for the steady case and variable in the pulsatile cases as shown in Figure 8.
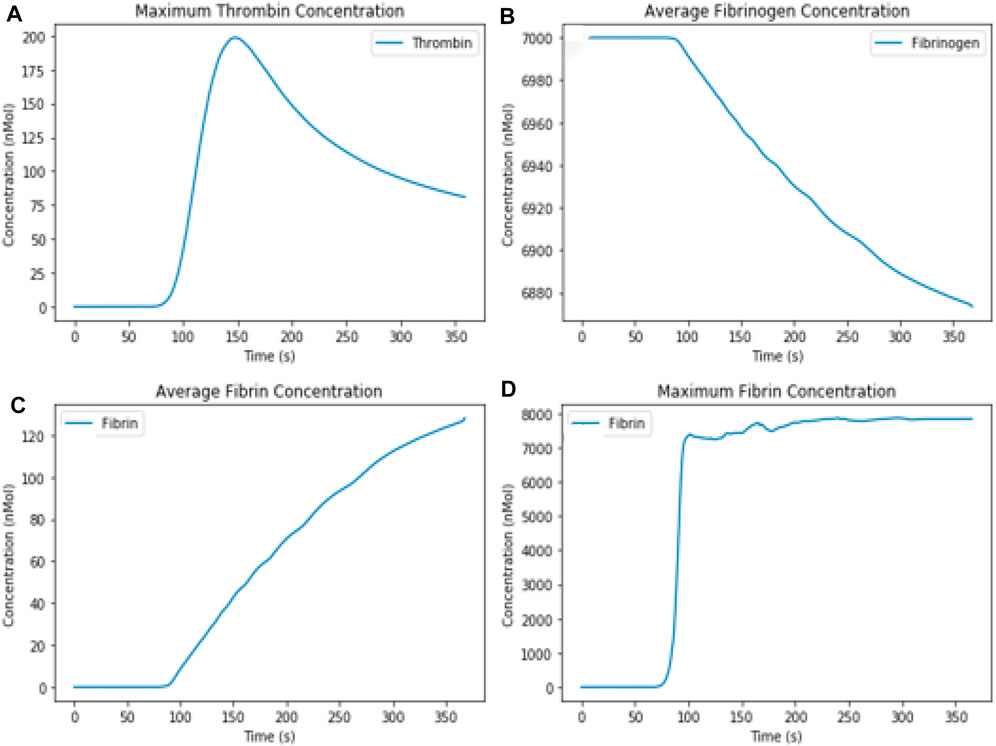
FIGURE 5. (A) Maximum thrombin concentration, (B) average fibrinogen concentration, (C) average fibrin concentration, and (D) maximum fibrin concentration in the three-dimensional model.
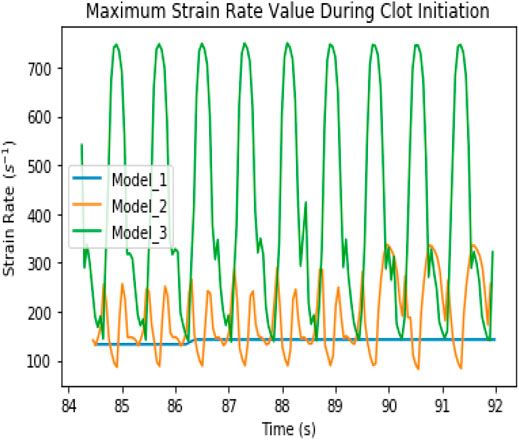
FIGURE 6. Maximum strain rate value before and after clot initiation in the three-dimensional model.
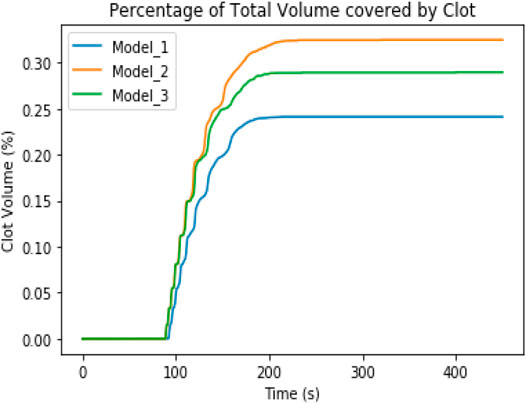
FIGURE 7. Comparison of the percentage of total volume covered by the clots in Models_1, 2, and 3 (three-dimensional model).
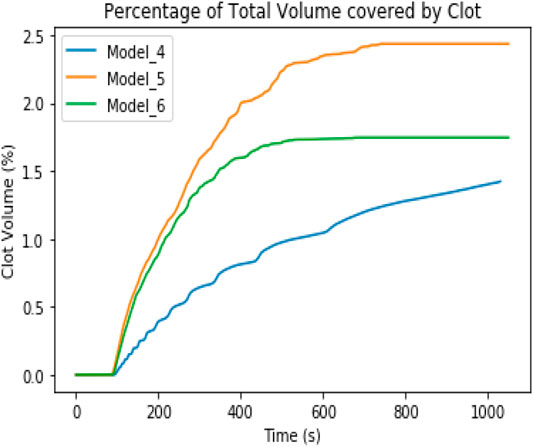
FIGURE 8. Comparison of the percentage of total volume covered by the clots in Models_4, 5, and 6 (three-dimensional model).
Models 4, 5, and 6 accounted for fibrinogen consumption and fibrin formation. Clots formed in these models are much larger than in Models 1, 2, and 3. This is due to the continuation of fibrin formation after thrombin concentration had dropped below the threshold value. Clots in the pulsatile cases are fully formed before 1000 s; however, the steady case (Model_4) continues to grow at a rate that is determined to be computationally expensive for this study. The model predicted the shape of the clot formed under these conditions.
3.3 Experimental Verification Results
The experimental clot growth study does not provide quantitative results, but the size and shape of the clot formed can be compared to the computational model for verification purposes. Studying the clot initiation was not possible with the setup as the reacting components were transparent and the fibrin fibers were not visible at this stage. Hence the fully developed clot, which was seen after 30 s as shown in Figures 9, 10, was examined. Figure 10 shows the clot formed in the simulated model and demonstrates the similarities in the shape and size of the clots formed between the computational and experimental clots. The major difference in the clots is that the computational clot head has a larger protrusion toward the outlet, when compared to the experimental clot. The experimental clot is higher than the computational clot. There was a difference of approximately 24% (1.8 mm) in the height of the formed clots. Ideally, the volume of the clots formed in both cases are the same; however, observation of clot migration in vitro suggests that the haemodynamic forces exceeded the tethering force on the phantom surface.

FIGURE 10. Clot formed in simulation after 30 s, based on a computational setup mimicking experimental conditions.
3.4 Patient-Specific Model Results
The steady state simulation was performed to determine the clot initiation areas. The evaluation performed using the developed model is purely qualitative and assumptions are made to achieve physiological results. Figure 11 shows the planes used to investigate the steady state results. The peak velocity values on each plane, as shown in Figure 11, were inversely proportional to the cross-sectional area. Relative to other planes, planes 4 and 6 showed low velocity in a large area close to the wall. These areas indicate stagnation and possibly recirculation. Attention was paid to these areas to determine the initiation zone for the transient simulation. The other factor used to finalize this decision was the strain rate. Figure 12 shows the strain rate contours on the planes of interest with the color legend set at a maximum of 100 s−1 such that areas with strain rates higher than this threshold appear in red. The strain rate contours indicate that the clot will initiate around planes 4 and 6 where the strain rate is below 100 s−1. These areas are used as the injury site in the transient simulation shown in Figure 12.
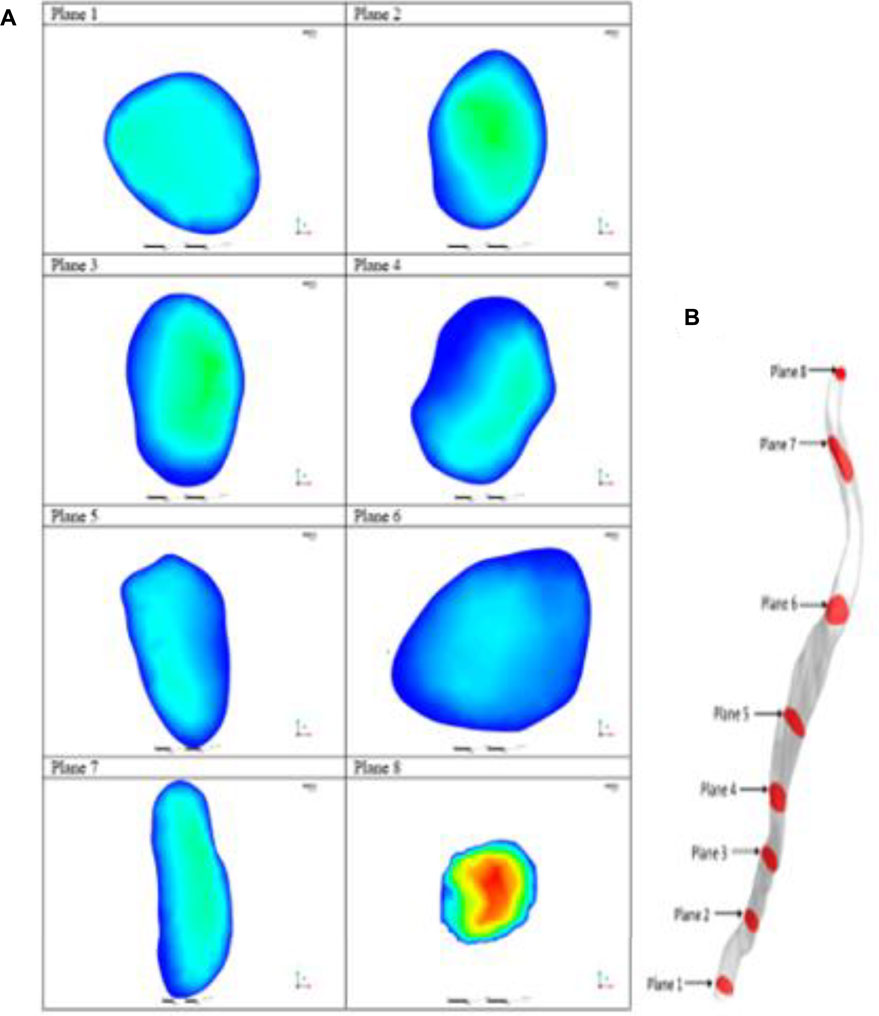
FIGURE 11. (A) Velocity contours at planes of interest. (B) Planes positioned at the “areas of interest” in the patient-specific model.
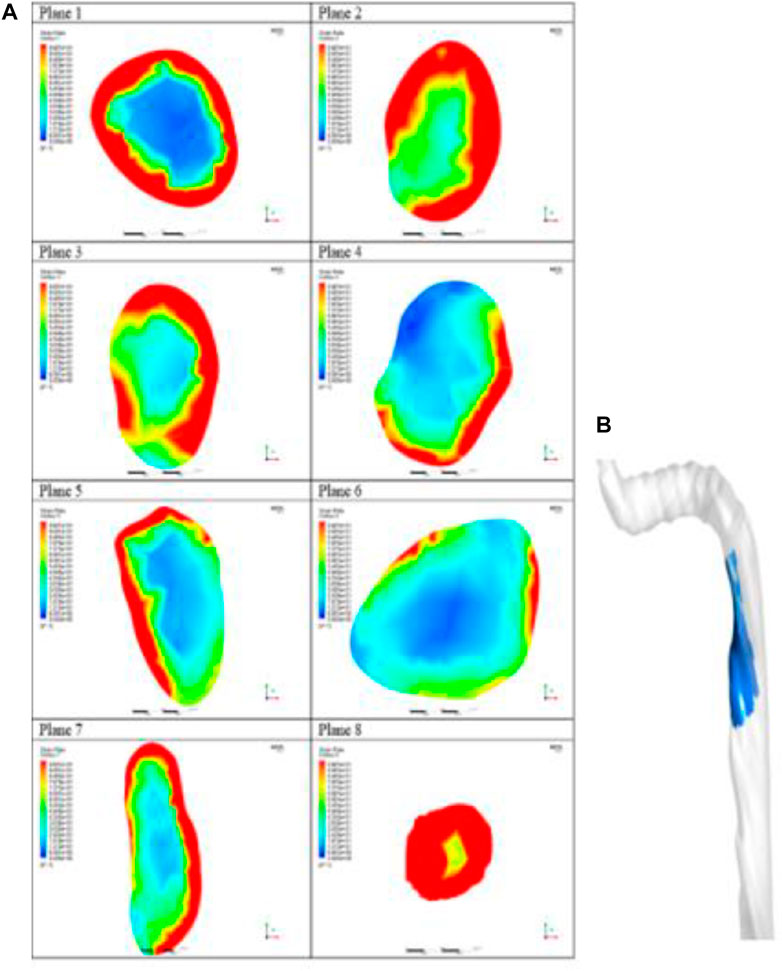
FIGURE 12. (A) Strain rate contours on the planes of interest and (B) position of injury zone used for simulations in the patient-specific model.
Figure 13 illustrates the planes used to investigate the transient simulation of the model. Figure 14 compares the velocity contours before and after clot formation on the planes of interest at the injury zone. The clots obstruct flow and increase the peak velocity on the plane. The strain rate on these planes is also illustrated in Figure 14. The strain rate in the clotted region drops to zero after clot formation. The strain rate on the clot surface increased but remained below 100 s−1, thereby indicating the possibility of clot propagation. Increased strain rate was noticed on plane H, which is closest to the clot tail due to recirculation at the clot head, thus trapping thrombin and encouraging clot propagation.
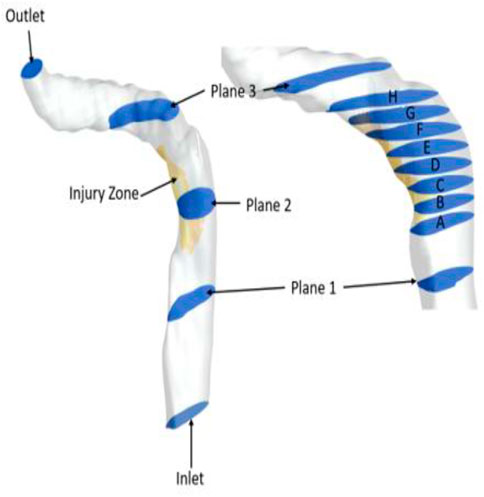
FIGURE 13. Planes of interest used for result analysis. Planes 1, 2, and 3 are used to study the mechanical properties and planes A–H are focused on studying clot formation (patient-specific model).
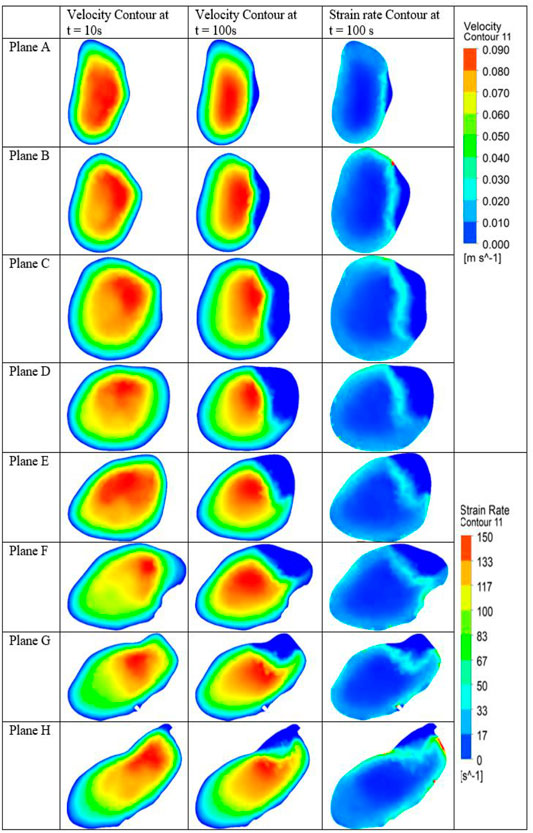
FIGURE 14. Contours comparing velocities on planes before (t = 10 s) and after (t = 100 s) clot formation. Strain rate contours show an increased strain rate on the clot surface (patient-specific model).
Figures 15A,B depicts the maximum thrombin and fibrin concentration in the patient-specific vein model over 100 s. Thrombin concentration followed the generation profile and increased steadily. Clot growth trapped most of the thrombin and prevented diffusion downstream and further downward into flow. Maximum fibrinogen concentration remained constant at 7000 nMol. Fibrin concentration also increased steadily until a peak value of 13600 nMol, where it becomes constant. The clot volume was the only quantitative property evaluated shown in Figure 15C. Figure 15D compared the in silico after 100 s to the in vivo clot. The clot volume derived during segmentation of the medical images was 2277.3 mm3, and the in silico clot had a volume of 2373.05 mm3 (4.2% difference) after 100s.
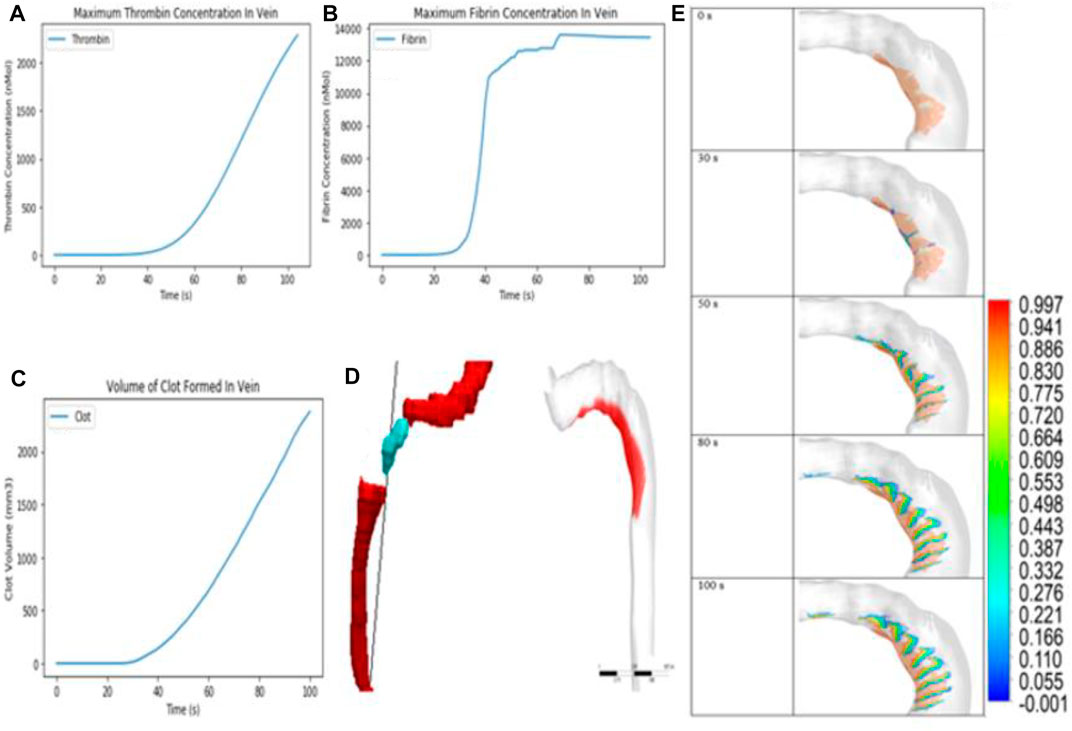
FIGURE 15. (A,B) Maximum thrombin and fibrin concentration in the vein over 100s. (C) Volume of clot formed in the vein over 100s. (D) Comparison between in vivo and in silico clot. (E) Contour showing clot growth over t = 100 s. Scalar = 1 for clot core and >0.5 for clot shell (patient-specific model).
4 Discussion
Our model corroborates the observations of Young et al., where stenotic flow resulted in improved clot propagation and also in regions close to the clot surface experiencing low shear [54]. An increase in velocity increased the rate of thrombin being carried away from the injury zone, thus reducing the size of the clot. This agrees with the findings of Kattula et al. [53]. The results from the model also concur with work done by Wolberg et al. as the clot size increased with an increase in peak thrombin concentration [52]. Results from this model show that changing the velocity profile with a fixed peak velocity does not significantly affect clot initiation. Clotting under steady flow initiated about a second later than under pulsatile flow [11, 55, 56]. The clot shape under steady flow shown in Figure 15E is similar to the clot observed by Kadri et al. [57]. Owing to a higher maximum strain rate in models with the valve activity, the clots formed are smaller than in purely pulsatile cases [31, 32].
The inclusion of fibrin in the model makes fibrin concentration the most important factor since fibrinogen concentration is constant, as explained by Weisel et al. [58]. Biochemical species’ concentrations in the vein changed over time, in a similar manner to the findings of Bodnar and Sequeira [18]. A slower thrombin dissipation rate was noticed when compared to the set profile. This is due to trapped thrombin inside the clot needing more time to be transported away from the injury site, as noted in Bodnar and Sequeira’s model [18]. The limitation of our model is the simplifications made involving clot formation. The complex biochemical reaction is reduced to two reactions, although the spontaneous and accelerated thrombosis in the presence of an “injury” on the vessel is captured. The flexible vein geometry was reduced to a rigid wall with a no-slip condition. This does not correlate with the experimental study. The no-slip condition in the simulation ensured that the velocity at the wall is always zero, allowing the clot to stick to the wall. To prevent the clot from being carried away in the experimental study, the injection needle was inserted into flow to act as a tether for the clot. The three-dimensional models proved that the two-dimensional models can be extended to patient-specific image-derived models. Improvement on the model could enable better understanding of the clot growth process for specific patients.
5 Conclusion
In this study, the development of a framework that predicts clot formation in a patient-specific three-dimensional femoral vein geometry using CFD techniques and biochemical reactions is outlined. This study aims to understand the effect of changing these factors on the clot size and determining which factor had the most impact on clot initiation and propagation. Increasing the velocity and vein diameter caused a reduction in clot size, and increasing the thrombin peak concentration increased the clot size. Thrombin concentration was found to be the sole factor determining when clot initiation occurs and the driving factor when determining the size of the clot. The work shows that higher thrombin concentration produces denser, larger clots. The model developed in this work was verified using an experimental clot growth study. The clot formed experimentally is compared to the computationally grown clot. After carrying out a visual comparison between both clots, there is a 24% difference between the heights of these clots with the experimental clot being thicker. Previously, most DVT models were mainly flow-based, studying areas of stagnation and recirculation. Most of them included solid valve walls and sinuses. This model avoids this complexity by simulating blood flow coming out of the valve and includes biochemical reactions on the desired injury zone, which allows for further investigation of the clot formation process. This process also helps us study the initiation and propagation of clots, in addition to identifying regions of clot formation. It is evident that the model can predict clot formation under different flow conditions.
Data Availability Statement
The datasets presented in this study can be found in online repositories. The names of the repository/repositories and accession number(s) can be found in the article/Supplementary Material.
Ethics Statement
Written informed consent was obtained from the individual(s) for the publication of any potentially identifiable images or data included in this article.
Author Contributions
All authors listed have made a substantial, direct, and intellectual contribution to the work and approved it for publication.
Funding
The National Research Foundation and University of Cape Town (UCT) Research Committee funded this research.
Conflict of Interest
The authors declare that the research was conducted in the absence of any commercial or financial relationships that could be construed as a potential conflict of interest.
Publisher’s Note
All claims expressed in this article are solely those of the authors and do not necessarily represent those of their affiliated organizations, or those of the publisher, the editors, and the reviewers. Any product that may be evaluated in this article, or claim that may be made by its manufacturer, is not guaranteed or endorsed by the publisher.
Acknowledgments
The authors would like to thank the University of Cape Town’s ICT High-Performance Computing Team for access to the cluster. Special thanks go to Andrew Lewis for his guidance through the process.
Supplementary Material
The Supplementary Material for this article can be found online at: https://www.frontiersin.org/articles/10.3389/fphy.2022.886193/full#supplementary-material
References
2. Kyrle PA, Eichinger S. Deep Vein Thrombosis. The Lancet (2005) 365:1163–74. doi:10.1016/s0140-6736(05)71880-8
3. di Nisio M, van Es N, Büller HR. Deep Vein Thrombosis and Pulmonary Embolism. The Lancet (2016) 388:3060–73. doi:10.1016/s0140-6736(16)30514-1
4. White RH, Keenan CR. Effects of Race and Ethnicity on the Incidence of Venous Thromboembolism. Thromb Res (2009) 123:S11–S17. doi:10.1016/s0049-3848(09)70136-7
5. Africa SS. Mortality and Causes of Death in South Africa: Findings from Death Notification. Johannesburg: Statistics South Africa (2017).
6. Awolesi D, Naidoo M, Cassimjee MH. The Profile and Frequency of Known Risk Factors or Comorbidities for Deep Vein Thrombosis in an Urban District Hospital in KwaZulu-Natal. South Afr J HIV Med (2016) 17:425. doi:10.4102/sajhivmed.v17i1.425
7. Wells PS, Anderson DR, Bormanis J, Guy F, Mitchell M, Gray L, et al. Value of Assessment of Pretest Probability of Deep-Vein Thrombosis in Clinical Management. The Lancet (1997) 350:1795–8. doi:10.1016/s0140-6736(97)08140-3
8. Blecher GE. Diagnosing DVT in the Emergency Department: Combining Clinical Predictors, D-Dimer and Bedside Ultrasound (2013). The Ottawa Hospital and University of Ottawa.
9. Kesieme E, Kesieme C, Jebbin N, Irekpita E, Dongo A. Deep Vein Thrombosis: a Clinical Review. Jbm (2011) 2:59. doi:10.2147/jbm.s19009
10. Marsden AL, Feinstein JA. Computational Modeling and Engineering in Pediatric and Congenital Heart Disease. Curr Opin Pediatr (2015) 27:587–96. doi:10.1097/mop.0000000000000269
11. Filipovic N, Kojic M, Tsuda A. Modelling Thrombosis Using Dissipative Particle Dynamics Method. Phil Trans R Soc A (2008) 366:3265–79. doi:10.1098/rsta.2008.0097
12. Purvis JE, Chatterjee MS, Brass LF, Diamond SL. A Molecular Signaling Model of Platelet Phosphoinositide and Calcium Regulation during Homeostasis and P2Y1 Activation. Blood J Am Soc Hematol (2008) 112:4069–79. doi:10.1182/blood-2008-05-157883
13. Chatterjee MS, Purvis JE, Brass LF, Diamond SL. Pairwise Agonist Scanning Predicts Cellular Signaling Responses to Combinatorial Stimuli. Nat Biotechnol (2010) 28:727–32. doi:10.1038/nbt.1642
14. Ngoepe MN, Ventikos Y. Computational Modelling of Clot Development in Patient-specific Cerebral Aneurysm Cases. J Thromb Haemost (2016) 14:262–72. doi:10.1111/jth.13220
15. Basmadjian D. The Effect of Flow and Mass Transport in Thrombogenesis. Ann Biomed Eng (1990) 18:685–709. doi:10.1007/bf02368455
16. Anand M, Rajagopal K, Rajagopal KR. A Model for the Formation, Growth, and Lysis of Clots in Quiescent Plasma. A Comparison between the Effects of Antithrombin III Deficiency and Protein C Deficiency. J Theor Biol (2008) 253:725–38. doi:10.1016/j.jtbi.2008.04.015
17. Panteleev MA, Ovanesov MV, Kireev DA, Shibeko AM, Sinauridze EI, Ananyeva NM, et al. Spatial Propagation and Localization of Blood Coagulation Are Regulated by Intrinsic and Protein C Pathways, Respectively. Biophysical J (2006) 90:1489–500. doi:10.1529/biophysj.105.069062
18. Bodnár T, Sequeira A. Numerical Simulation of the Coagulation Dynamics of Blood. Comput Math Methods Med (2008) 9:83–104. doi:10.1080/17486700701852784
19. Ouared R, Chopard B, Stahl B, Rüfenacht DA, Yilmaz H, Courbebaisse G. Thrombosis Modeling in Intracranial Aneurysms: a Lattice Boltzmann Numerical Algorithm. Comput Phys Commun (2008) 179:128–31. doi:10.1016/j.cpc.2008.01.021
20. Marsden AL. Optimization in Cardiovascular Modeling. Annu Rev Fluid Mech (2014) 46:519–46. doi:10.1146/annurev-fluid-010313-141341
21. Naccarato M, Grandi FC, Dennis M, Sandercock PAG. Physical Methods for Preventing Deep Vein Thrombosis in Stroke. Cochrane Database Syst Rev (2010). doi:10.1002/14651858.cd001922.pub3
22. Ngoepe MN, Pretorius E, Tshimanga IJ, Shaikh Z, Ventikos Y, Ho HH. Thrombin-fibrinogen In Vitro Flow Model of Thrombus Growth in Cerebral Aneurysms. Thromb HaemostasisOpen (2021) 05:e155–e162. doi:10.1055/s-0041-1728790
23. Hume S, Tshimanga J-MI, Geoghegan P, Malan AG, Ho WH, Ngoepe MN. Effect of Pulsatility on the Transport of Thrombin in an Idealized Cerebral Aneurysm Geometry. Symmetry (2022) 14:133. doi:10.3390/sym14010133
24. Xu Z, Chen N, Kamocka MM, Rosen ED, Alber M. A Multiscale Model of Thrombus Development. J R Soc Interf (2008) 5:705–22. doi:10.1098/rsif.2007.1202
25. Savage B, Saldívar E, Ruggeri ZM. Initiation of platelet adhesion by arrest onto fibrinogen or translocation on von Willebrand factor. Cell (1996) 84:289–97. doi:10.1016/s0092-8674(00)80983-6
26. Mehrabadi M, Ku DN, Aidun CK. Effects of Shear Rate, Confinement, and Particle Parameters on Margination in Blood Flow. Phys Rev E (2016) 93:23109. doi:10.1103/PhysRevE.93.023109
27. Xu S, Xu Z, Kim OV, Litvinov RI, Weisel JW, Alber M. Model Predictions of Deformation, Embolization and Permeability of Partially Obstructive Blood Clots under Variable Shear Flow. J R Soc Interf (2017) 14:20170441. doi:10.1098/rsif.2017.0441
28. Ramunigari NK, Roy D. Numerical Simulations of Thrombosis. Chron Young Sci (2013) 4:130. doi:10.4103/2229-5186.115552
29. Fortuny G, Herrero J, Puigjaner D, Olivé C, Marimon F, Garcia-Bennett J, et al. Effect of Anticoagulant Treatment in Deep Vein Thrombosis: A Patient-specific Computational Fluid Dynamics Study. J Biomech (2015) 48:2047–53. doi:10.1016/j.jbiomech.2015.03.026
30. Ibrahim N, Aziz NSA, Manap ANA. Vein Mechanism Simulation Study for Deep Vein Thrombosis Early Diagnosis Using Cfd. J Phys Conf Ser (2017) 822:012040. doi:10.1088/1742-6596/822/1/012040
31. Noda N, Nakano M, Matsuura H, Nemoto T, Koide K. Numerical Analysis of Blood Flow in Vessels. In: First International Conference on Innovative Computing, Information and Control-Volume I (ICICIC’06) (2006). p. 545–6. doi:10.1109/icicic.2006.483
32. Ohashi T, Liu H, Yamaguchi T. Computational Fluid Dynamic Simulation of the Flow through Venous Valve. In: Clinical Application of Computational Mechanics to the Cardiovascular System. Springer (2000). p. 186–9. doi:10.1007/978-4-431-67921-9_18
33. Narracott AJ, Keijsers JMT, Leguy CAD, Huberts W, van de Vosse FN. Fluid-structure Interaction Analysis of Venous Valve Hemodynamics. In: 4th International Conference on Computational & Mathematical Biomedical Engineering (CMBE15). Cachan, France (2015). p. 31–4. June 29-July 1, 2015.
34. Buescher CD, Nachiappan B, Brumbaugh JM, Hoo KA, Janssen HF. Experimental Studies of the Effects of Abnormal Venous Valves on Fluid Flow. Biotechnol Prog (2005) 21:938–45. doi:10.1021/bp049835u
35. Simão M, Ferreira JM, Mora-Rodriguez J, Ramos HM. Identification of DVT Diseases Using Numerical Simulations. Med Biol Eng Comput (2016) 54:1591–609. doi:10.1007/s11517-015-1446-9
36. Hajati Z, Moghanlou FS, Vajdi M, Razavi SE, Matin S. Fluid-structure Interaction of Blood Flow Around a Vein Valve. Bioimpacts (2020) 10:169–75. doi:10.34172/bi.2020.21
37. Lurie F, Kistner RL, Eklof B. The Mechanism of Venous Valve Closure in normal Physiologic Conditions. J Vasc Surg (2002) 35:713–7. doi:10.1067/mva.2002.121123
38. Narracott A, Smith S, Lawford P, Liu H, Himeno R, Wilkinson I, et al. Development and Validation of Models for the Investigation of Blood Clotting in Idealized Stenoses and Cerebral Aneurysms. J Artif Organs (2005) 8:56–62. doi:10.1007/s10047-004-0274-8
39. Ovanesov MV, Ananyeva NM, Panteleev MA, Ataullakhanov FI, Saenko EL. Initiation and Propagation of Coagulation from Tissue Factor-Bearing Cell Monolayers to Plasma: Initiator Cells Do Not Regulate Spatial Growth Rate*. J Thromb Haemost (2005) 3:321–31. doi:10.1111/j.1538-7836.2005.01128.x
40. Onasoga-Jarvis AA, Puls TJ, O'Brien SK, Kuang L, Liang HJ, Neeves KB. Thrombin Generation and Fibrin Formation under Flow on Biomimetic Tissue Factor-Rich Surfaces. J Thromb Haemost (2014) 12:373–82. doi:10.1111/jth.12491
41. Neeves KB, Illing DAR, Diamond SL. Thrombin Flux and wall Shear Rate Regulate Fibrin Fiber Deposition State during Polymerization under Flow. Biophysical J (2010) 98:1344–52. doi:10.1016/j.bpj.2009.12.4275
42. Prasad S, Kashyap RS, Deopujari JY, Purohit HJ, Taori GM, Daginawala HF. Development of an In Vitro Model to Study Clot Lysis Activity of Thrombolytic Drugs. Thromb J (2006) 4:14–4. doi:10.1186/1477-9560-4-14
43. Goldsmith HL, Karino T. Interactions of Human Blood Cells with the Vascular Endothelium. Ann NY Acad Sci (1987) 516:468–83. doi:10.1111/j.1749-6632.1987.tb33067.x
44. Hemker HC, Giesen P, AlDieri R, Regnault V, de Smed E, Wagenvoord R, et al. The Calibrated Automated Thrombogram (CAT): a Universal Routine Test for Hyper- and Hypocoagulability. Pathophysiol Haemos Thromb (2002) 32:249–53. doi:10.1159/000073575
45. Kremers RMW, Laat B, Wagenvoord RJ, Hemker HC. Computational Modelling of Clot Development in Patient‐specific Cerebral Aneurysm Cases: Comment. J Thromb Haemost (2017) 15:395–6. doi:10.1111/jth.13591
46. Diamond SL. Engineering Design of Optimal Strategies for Blood Clot Dissolution. Annu Rev Biomed Eng (1999) 1:427–61. doi:10.1146/annurev.bioeng.1.1.427
47. Diamond SL, Anand S. Inner Clot Diffusion and Permeation during Fibrinolysis. Biophysical J (1993) 65:2622–43. doi:10.1016/s0006-3495(93)81314-6
48. Selis JE, Kadakia S. Venous Doppler Sonography of the Extremities: a Window to Pathology of the Thorax, Abdomen, and Pelvis. Am J Roentgenology (2009) 193:1446–51. doi:10.2214/ajr.09.2640
49. Rohatgi A. WebPlotDigitizer (2010). Available at: https://automeris.io/WebPlotDigitizer/. Accessed: May 08, 2020.
50.Radiopedia (2022). Radiopedia Available at: https://radiopaedia.org/. Accessed: May 08, 2020.
51. Hathcock JJ. Flow Effects on Coagulation and Thrombosis. Atvb (2006) 26:1729–37. doi:10.1161/01.atv.0000229658.76797.30
52. Wolberg AS, Monroe DM, Roberts HR, Hoffman M. Elevated Prothrombin Results in Clots with an Altered Fiber Structure: a Possible Mechanism of the Increased Thrombotic Risk. Blood J Am Soc Hematol (2003) 101:3008–13. doi:10.1182/blood-2002-08-2527
53. Kattula S, Byrnes JR, Wolberg AS. Fibrinogen and Fibrin in Hemostasis and Thrombosis. Arterioscler Thromb Vasc Biol (2017) 37:e13–e21. doi:10.1161/ATVBAHA.117.308564
55. Xu Z, Kamocka M, Alber M, Rosen ED. Computational Approaches to Studying Thrombus Development. Atvb (2011) 31:500–5. doi:10.1161/atvbaha.110.213397
56. Pivkin IV, Richardson PD, Karniadakis G. Blood Flow Velocity Effects and Role of Activation Delay Time on Growth and Form of Platelet Thrombi. Proc Natl Acad Sci U.S.A (2006) 103:17164–9. doi:10.1073/pnas.0608546103
57. Kadri OE, Chandran VD, Surblyte M, Voronov RS. In Vivo measurement of Blood Clot Mechanics from Computational Fluid Dynamics Based on Intravital Microscopy Images. Comput Biol Med (2019) 106:1–11. doi:10.1016/j.compbiomed.2019.01.001
Keywords: CFD, DVT, thrombosis, fibrin, blood coagulation, patient-specific modeling, experimental clot growth
Citation: Jimoh-Taiwo Q, Haffejee R and Ngoepe M (2022) A Mechano-Chemical Computational Model of Deep Vein Thrombosis. Front. Phys. 10:886193. doi: 10.3389/fphy.2022.886193
Received: 28 February 2022; Accepted: 06 May 2022;
Published: 27 June 2022.
Edited by:
Efstathios Kaliviotis, Cyprus University of Technology, CyprusCopyright © 2022 Jimoh-Taiwo, Haffejee and Ngoepe. This is an open-access article distributed under the terms of the Creative Commons Attribution License (CC BY). The use, distribution or reproduction in other forums is permitted, provided the original author(s) and the copyright owner(s) are credited and that the original publication in this journal is cited, in accordance with accepted academic practice. No use, distribution or reproduction is permitted which does not comply with these terms.
*Correspondence: Malebogo Ngoepe, bWFsZWJvZ28ubmdvZXBlQHVjdC5hYy56YQ==
†These authors have contributed equally to this work and share first authorship
 Qudus Jimoh-Taiwo
 Rashid Haffejee
 Malebogo Ngoepe