 Alyssa C. Melvin
 Melissa M. Reynolds
- 1Department of Chemistry, Colorado State University, Fort Collins, CO, United States
- 2School of Biomedical Engineering, Colorado State University, Fort Collins, CO, United States
- 3Department of Chemical and Biological Engineering, Colorado State University, Fort Collins, CO, United States
The metal–organic framework (MOF) CuBTTri, H3[(Cu4Cl)3(BTTri)8] (where H3BTTri = 1,3,5-tris(1H-1,2,3-triazol-5-yl)benzene), is a promising catalyst for the development of antithrombotic medical device materials via localized nitric oxide (NO) generation from endogenous S-nitrosothiols. This work evaluates the effects of three key parameters of CuBTTri-embedded polyurethane composite materials—MOF preparation/particle size, MOF loading, and polymer concentration—on the rate of NO generation. We discovered that CuBTTri preparation and particle size have a significant impact on NO generation. Specifically, hand-ground MOF particles (0.3 ± 0.1 µm diameter) generate NO at greater rates compared to larger as-prepared, raw MOF particles (0.4 ± 0.2 µm diameter) and smaller, filtered MOF particles (0.2 ± 0.1 µm diameter) for composite materials. This finding contradicts previous research for CuBTTri powder which found that the smaller the particles, the greater the catalytic rate. In examining the effects of MOF loading and polymer concentration, our data show that increasing these parameters generally results in increased rates of NO generation; though thresholds appear to exist in which increasing these parameters results in diminishing returns and impedes NO generation capacity for certain composite formulations. We found that polymer concentration is the key determinant of water absorptivity and statistically significant decreases in water uptake accompany statistically significant increases in NO generation. It was also found that formulations with relatively high MOF loadings and low polymer concentrations or low MOF loadings and high polymer concentrations inhibit the rate of NO generation. In summary, this research provides a framework for more strategic selections of key parameters when fabricating composite materials for medical device applications.
1 Introduction
Metal–organic frameworks (MOFs) are crystalline coordination polymers consisting of metal centers connected by organic linkers [1]. The tunable, highly ordered, and porous nature of these materials makes them favorable for a variety of applications from gas storage to catalysis [1–7]. MOFs have been employed as heterogeneous catalysts extensively in recent years due to their distinctive physical properties including rational design/tunability, structural diversity, and coordinatively unsaturated metal sites [5].
As MOF applications continue to expand, hybrid MOF/polymer composite materials (also referred to as mixed-matrix membranes, MMMs) have attracted attention as an effective way to incorporate the solid-state material on devices for commercial or industrial applications by merging the functionalities of MOFs with the flexibility and processability of polymers [8–11]. Various synthetic methods such as polymer grafting to or from MOFs, polymerizing within MOFs, and polymer templating MOFs have been employed to fabricate these hybrid materials; though the most widely-used conventional method involves dispersing solid MOF particles in a polymer solution [11–16]. This method is attractive for its relative ease, accessibility, and tunability, and has been demonstrated for a range of MOF and polymer combinations [12, 17–19]. But poor interactions between the two phases can result in agglomerations of MOF particles during the fabrication or evaporation process [12]. Reducing MOF particle size, altering MOF particle morphology, priming the MOF particles with the polymer solution, and slowing the evaporation rate of the solvent are a few strategies to improve the uniformity of these films. For catalytic MOFs, composites provide the benefit of increased catalyst stability and recoverability, but must retain its desired catalytic properties [8, 17, 20]. Compared to the powder MOF system, the catalytic performance of the polymer-embedded systems has been shown to range from moderately reduced [21] to sustained [17] to moderately enhanced [22].
A water stable copper-azolate MOF CuBTTri, H3[(Cu4Cl)3(BTTri)8] (H3BTTri = 1,3,5-tris(1H-1,2,3-triazol-5-yl)benzene), maintains its crystallinity and catalytic activity for a desirable biomedical reaction after incorporation in polymers such as chitosan, poly (vinyl alcohol), and CarboSil-2080A [23–25]. CuBTTri catalyzes the oxidation of bioavailable S-nitrosoglutathione (GSNO) to generate nitric oxide (NO), a critical biomolecule involved in range of physiological processes in the cardiovascular, immune, and nervous systems [26–28]. Designing CuBTTri/polymer composite materials for blood-contacting medical devices such as catheters, extracorporeal circuits, and sensors has been an active area of research because surface-localized generation of NO in the range of natural endothelial NO flux has been shown to prevent thrombus formation on artificial surfaces [28–33]. Herein, we incorporate CuBTTri into a hydrophilic polyurethane and evaluate the impacts of MOF particle size, MOF loading, and polymer concentration on NO generation to gain insights into the tunability of these composite materials for the design of biocompatible coatings. Ultimately, this work aims to advance the rational design of catalytic MOF composite materials for medical device applications.
2 Materials and Methods
2.1 Materials
Glutathione, reduced (GSH; 98%) was purchased form AMRESCO (Solon, OH). Sodium nitrite (99.999%), trimethylsilyl azide (94%), 1,3,5-triethynylbenzene (98%), copper(I) iodide (98%), and copper (II) chloride dihydrate (99+%) were purchased from Alfa Aesar (Ward Hill, MA, United States). Tecophilic polyurethane (PU; SP-80A-150) was purchased from Lubrizol (Wickliffe, OH, United States). All chemicals were used without further purification. Cell strainers (1 µm) were purchased from pluriSelect (Leipzig, Germany). Ultra-high purity (UHP) nitrogen (N2), oxygen (O2), and nitric oxide (NO, 43.6 ppm NO, balance N2) gases were purchased from Airgas (Denver, CO, United States). Ultrapure water (18.2 MΩ cm) was supplied by a Millipore Milli-Q IQ water purification system (EMD Millipore, Billerica, MA, United States).
2.2 Synthetic Methods
2.2.1 CuBTTri Particle Preparation
CuBTTri powder (Supplementary Section S1.1 for synthesis) was processed using three different methods prior to inclusion within a polymer to compare the effect of various preparation methods and MOF particle sizes (Supplementary Figure S1 SEM images). A) Raw particles: CuBTTri solid used as prepared by the synthesis with no further treatment. B) Ground particles: CuBTTri samples were hand-ground for 5 min. C) Filtered particles: CuBTTri samples were first hand-ground as described above. Small amounts (1–5 mg) of the ground CuBTTri powder were suspended in ultrapure water (approx. 1 L) through a combination of rapid stirring and sonication. The solution was filtered through a 1 μm cell strainer and the water evaporated from the filtrate. The resulting CuBTTri powder was used to prepare the composites. Statistical evaluation determined that the three particle size ranges were significantly different (raw vs. ground, p = 1.4 × 10⁻⁵; raw vs. filtered, p = 1.3 × 10⁻¹⁰; ground vs. filtered, p = 2.7 × 10⁻⁶).
2.2.2 Composite Material Fabrication
All CuBTTri samples were stirred rapidly (1,200 rpm) in 3 ml THF in a 20 ml vial for at least 1 h, or until no CuBTTri clumps were visible (Table 1 for composite preparation.) The polymer PU was dissolved in 7 ml THF overnight in a separate 20 ml vial. CuBTTri solution was added to PU solution and stirred for 15 min, or until visually homogenous. CuBTTri/PU solution was poured into a 4.8 cm diameter polytetrafluoroethylene (PTFE) mold. The PTFE mold was covered with glass cover and left to dry overnight. Films were dried for 15 min under vacuum then punched into 1.2 cm diameter films details for analysis (Supplementary Figure S2 for images of the composites.)
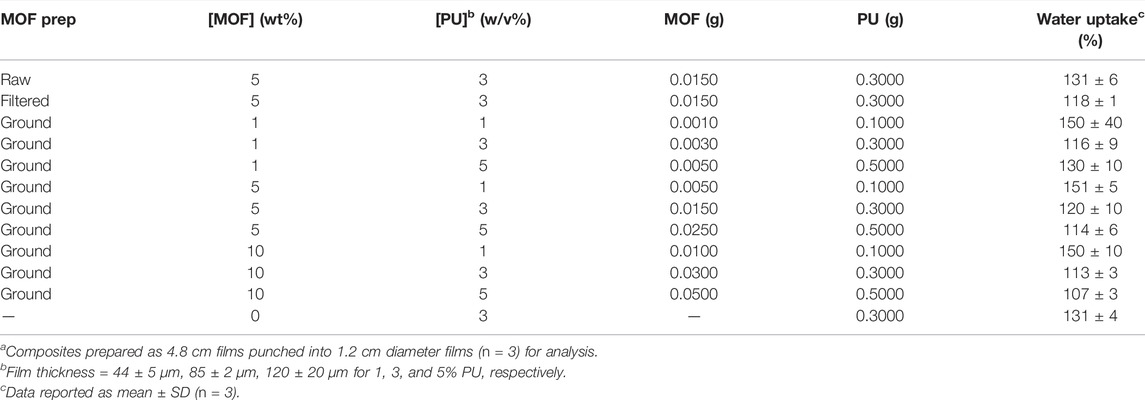
TABLE 1. MOF compositesa.
2.3 Analytical Methods
2.3.1 Water Uptake Measurements
The initial (Wi) and final (Wf) weight of the 1.2 cm diameter composite films used in each NOA experiment were collected using an Ohaus DV215CD analytical balance (Pine Brook, NJ, United States). Excess water was blotted before weighing. Percent water uptake was calculated using the equation:
2.3.2 Nitric Oxide Generation Measurements
Chemiluminescence-based Nitric Oxide Analyzers (NOA 280i, GE Analytical and Zysense, CO, United States) were used to measure NO generation from the MOF composites. A two-point calibration was performed using zero air (<1 ppb NO) and nitric oxide calibrant gas (43.6 ppm NO). The 1.2 cm composite films were fully swelled prior to NO release experiments by soaking in water for exactly 5 min. NO concentration (ppb) was recorded as a function of time after injecting S-nitrosoglutathione (GSNO) (Supplementary Section S1.2 for synthesis) into a glass reaction cell containing the submersed film to make the desired final concentration of GSNO (1.0 × 10⁻⁵ M). The measurements were made at 25°C with constant N2 bubbling and shielded from light at an interval of 1 s. All the samples generated similar NO release profiles with four distinct phases (Supplementary Figure S1 for visual depiction): a short induction period after GSNO injection, increasing linear rate of NO generation, steady-state NO flux, and a sharp return to baseline when GSNO has been consumed.
2.3.3 Data Reporting and Analysis
Four metrics were used to compare NO generation by the composite films collected by the NOA. A) Reaction time: Measured from GSNO injection until NO release returns to instrument baseline. B) NO yield: Using an instrument-specific calibration constant (mol s−1 ppb−1) and the measurement interval (s), NO concentration (ppb) was converted to moles NO. Moles GSNO was calculated from the known concentration and volume of GSNO added to the reaction cell then converted to moles NO. NO yield was calculated using the equation:
C) NO flux: Moles NO was converted to NO flux (nmol min−1 cm−2) using the surface area of the film. The average flux was calculated for each replicate measurement over the time period in which NO generation was at a steady-state. Refer to Supplementary Figure S1 for visual representation of each statistic. Data is reported as the mean ± standard deviation (SD) of n = 3 replicate experiments. Statistical significance was determined using one-way ANOVA with post hoc Tukey HSD at a 95% confidence interval.
3 Results and Discussion
The goal of this study was to examine how varying the parameters MOF particle preparation/size, MOF loading, and polymer concentration impact the performance of the catalytic MOF CuBTTri embedded in a hydrophilic thermoplastic polyurethane, Tecophilic SP-80A-150 (herein abbreviated PU). Aside from the identity of the MOF and polymer, these are three of the key ways MOF composite fabrication can be tuned to alter performance, yet a systematic study of the effects of these parameters on any catalytic MOF composite system has yet to be conducted. Of note, in all cases the composite films were able to absorb more than 100% of their weight in water despite incorporation of the MOF, indicating that the polymer retained its desired mechanical properties (Table 1), and all the films except one generated NO yields over 90% (Tables 2, 3) indicating that the formulations are effective NO generating materials.
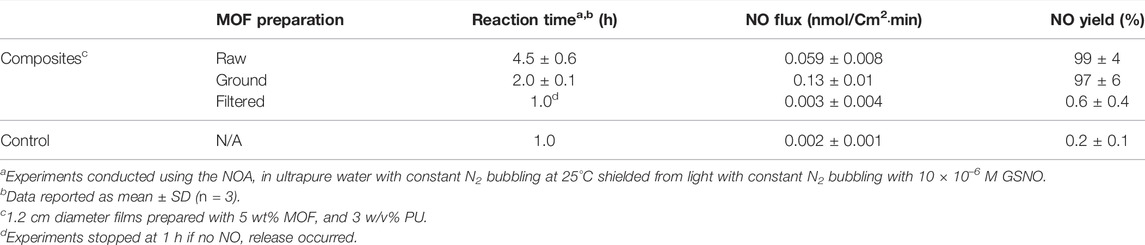
TABLE 2. Composites comparing three MOF preparation techniques.
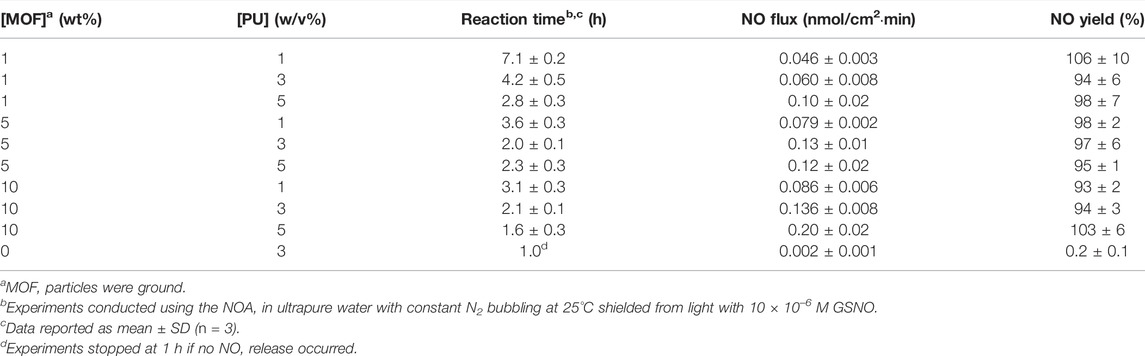
TABLE 3. Composite films comparing MOF loading and polymer concentration.
3.1 The Effects of Metal–Organic Frameworks Preparation Methods and Particle Size on Nitric Oxide Generation
Prior to incorporation into composite materials, MOFs are often ground, ball-milled, or sonicated to alter the particle morphology and/or reduce the particle size of the MOF crystals for specific applications [12, 34]. In 2020, our group discovered that CuBTTri-catalyzed generation of NO from GSNO occurs at unsaturated exterior surface copper sites on CuBTTri particles rather than within the pores [35]. In support of that observation, they also reported that large MOF particles (∼1 mm diameter) exhibited markedly slower rates of catalysis compared with particles less than 2 µm in diameter, and the initial rate of GSNO oxidation increased two-fold when the particle size is reduced from approximately 1.5 µm to less than 1 µm in diameter. It was unknown prior to the current work if this direct correlation between particle size and catalytic rate will remain for CuBTTri embedded within a polymer matrix. To explore this question, three sets of CuBTTri particles were prepared with different levels of processing, raw, as-synthesized particles (abbr. “raw,” 0.4 ± 0.2 µm diameter), hand-ground particles (abbr. “ground,” 0.3 ± 0.1 µm diameter), and particles that were ground, sonicated, and collected via filtration through a 1 µm filter (abbr. “filtered,” 0.2 ± 0.1 µm diameter) (Supplementary Figure S1 for SEM images of the MOF particles). These particles were incorporated into composite materials comprised of 5 wt.% CuBTTri/3 w/v% PU (Supplementary Figure S2A for magnified images of the prepared films). PXRD analysis confirmed that MOF crystallinity was retained after using these processing methods (Supplementary Figure S4 for PXRD patterns) and NOA analyses confirmed that that the smaller CuBTTri powder particles simply suspended in water catalyzed the reaction faster than the larger particles (filtered > ground > raw, Supplementary Table S1). It is important to note that these simple controls differed from the standard conditions herein in that they contained an equivalent of reduced glutathione (GSH), but nevertheless serve as a useful control to reproduce the previous particle size versus NO generation rate observed by our group.
The results of the NO generation analysis (see Table 2; Figure 1) showed that the simple process of hand grinding the raw CuBTTri particles increased the average NO flux by 120% (p = 0.000086) and decreased the total reaction time by more than half (p = 0.0015). This result was unsurprising, as grinding shears the MOF particles and breaks up aggregates, increasing the number of exterior surface copper sites available for GSNO to NO oxidation catalysis as predicted by the preceding study from our group [35]. Curiously, we found that further processing the particles by sonication and filtration inhibited the ability of CuBTTri to catalyze the generation of NO within a polymer matrix. In fact, the average flux is not statistically different (p = 0.71) than that of the PU control film with no MOF. Further experiments will be needed to parse the complexities of this observation; regardless, reducing the MOF particle size does not always elicit an increased rate of NO generation when fabricated into a composite material.
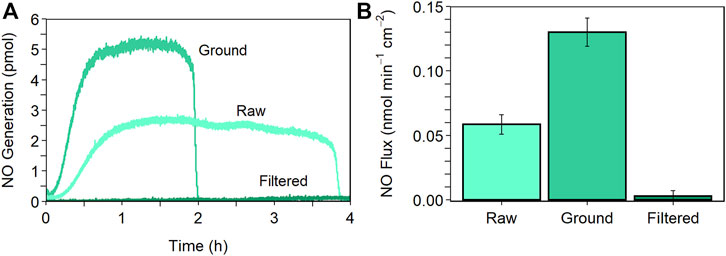
FIGURE 1. NO generation as a function of MOF particle preparation. (A) Representative NO release profiles and (B) average NO flux comparing the raw, ground, and filtered MOF particles. Experiments conducted using the NOA in ultrapure water with constant N2 bubbling at 25°C shielded from light with 10 × 10–6 M GSNO. Composites (1.2 cm diameter) comprised of 5 wt.% MOF and 3 w/v% PU. Data reported as mean ± SD (n = 3).
3.2 The Effects of Metal–Organic Framework Loading and Polymer Concentration on Nitric Oxide Generation
Based on the previous results, ground CuBTTri particles were selected for the remainder of the experiments because they exhibited the greatest activity for NO generation in composite materials. CuBTTri concentrations of 1, 5, and 10 wt.% in the composite were tested to evaluate the relative impact of MOF loading on NO generation. This low MOF concentration range was selected to preserve the mechanical properties of the polymer in which the MOF is being incorporated [36, 37]. The polymer used in this study, Tecophilic SP-80A-150, is a medical grade hydrophilic polyether-based aliphatic thermoplastic polyurethane. Polyurethanes are frequently used in implantable medical devices such as catheters and glucose biosensors due to their demonstrated biocompatibility (i.e., inertness within biological systems), biostability, inherent resistance to cell adhesion, and their excellent mechanical properties such as tensile and tear strength and abrasion resistance [38–42]. This particular polyurethane was selected for its ability to absorb water up to 150% of its dry weight. Water absorption has two major benefits for blood-contacting applications. First, hydrophilic polymers tend to foul less than their hydrophobic counterparts due to the presence of a hydration layer formed through hydrogen bonding at the polymer-fluid interface [43]. Second, based on previous research we hypothesize that the ability of the polymer to absorb water will enhance the interaction between GSNO and embedded CuBTTri particles by facilitating GSNO diffusion into the composite material [20, 24]. PU concentrations of 1, 3, 5% (w/v) were selected as a practical range for applying to medical device surfaces by commonly used deposition methods such as dip-coating and spin-coating based on the observed viscosity of the PU solutions [44–46]. MOF composites formulated in each possible combination of MOF loading and PU concentration were analyzed to evaluate their on the NO generation potential of MOF composites. The results are presented in Table 3 and Figures 2, 3.
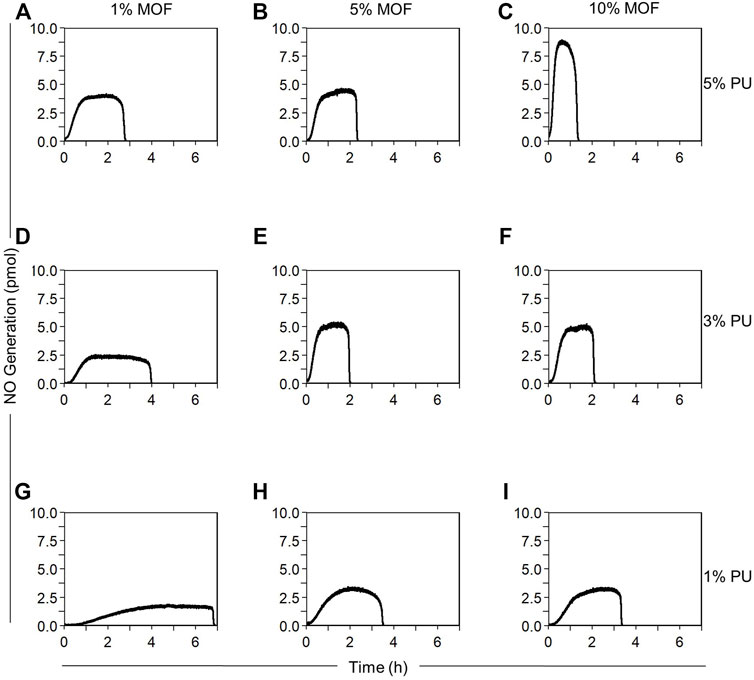
FIGURE 2. Representative NO release profiles as a function of MOF loading and PU concentration. Composite fabricated with: (A) 1 wt.% MOF, 5 w/v% PU, (B) 5 wt.% MOF, 5 w/v% PU, (C) 10 wt.% MOF, 5 w/v% PU, (D) 1 wt.% MOF, 3 w/v% PU, (E) 5 wt.% MOF, 3 w/v% MOF, (F) 10 wt.% MOF, 3 w/v% MOF, (G) 1 wt.% MOF, 1 w/v% PU, (H) 5 wt.% MOF, 1 w/v% PU, (I) 10 wt.% MOF, 1 w/v% PU. Experiments conducted using the NOA in ultrapure water with constant N2 bubbling at 25°C shielded from light with 10 × 10–6 M GSNO. Composites (1.2 cm diameter) fabricated with ground MOF. Data reported as mean ± SD (n = 3).
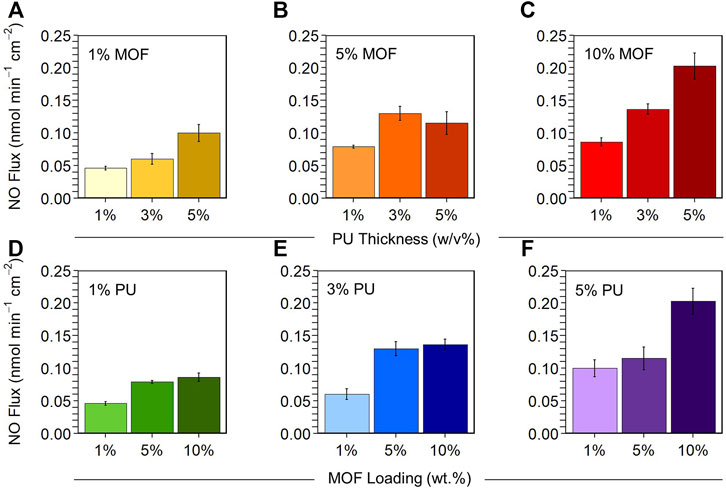
FIGURE 3. Top: Varying PU concentration at different MOF loadings. (A) 1 wt.% MOF, (B) 5 wt.% MOF, (C) 10 wt.% MOF at 1, 3, and 5 w/v% PU. Bottom: Varying MOF loading at different PU concentrations. (D) 1 w/v% PU, (E) 3 w/v% PU, (F) 5 w/v% PU at 1, 5, and 10 wt.% MOF. Experiments conducted using the NOA in ultrapure water with constant N2 bubbling at 25°C shielded from light with 10 × 10–6 M GSNO. Composites (1.2 cm diameter) fabricated with ground MOF. Data reported as mean ± SD (n = 3).
3.2.1 Varying Polymer Concentration at a Constant Metal–Organic Framework Loading
At 1% MOF loading, we observed a trend in which each increase in PU concentration at constant MOF loading resulted in statistically significant effects on NO flux and reaction time. Increasing the PU concentration from 1% to 3% increased NO flux by 130% (p = 0.045) and decreased the reaction time by 41% (p = 0.00063) (Figures 2D,G, 3A). Further increasing PU concentration from 3% to 5% increased NO flux by 130% (p = 0.012) and decreased the reaction time by 34% (p = 0.011) (Figures 2A,D, 3A).
At 5% MOF loading, we observed that increasing from 1% to 3% PU had significant effects on NO flux (61% increase, p = 0.0045) and reaction time (43% decrease, p = 0.0010) (Figures 2E,H, 3B), but increasing from 3% to 5% PU had no impact on performance (Figures 2B,E, 3B).
At 10% MOF loading, we observed that each increase in PU concentration resulted in significant increases in NO flux at constant MOF loading. From 1% to 3% PU NO flux increased 60% (p = 0.0071), and from 3% to 5% PU increased 50% (p = 0.0018) (Figures 2C,F,I, 3C). We also observed significant reductions in reaction time (33% decrease, p = 0.0041) increasing PU concentration from 1% to 3%, which was not observed increasing from 3% to 5% PU.
In light of these results, we were curious if decreases in PU concentration for composites fabricated with the smaller filtered MOF particles from Section 3.1 would increase NO generation the same way increases in PU concentration tended to increase NO generation for composites with the relatively larger ground MOF particles. We explored this question by reducing the PU concentration from the original 3% PU composite that did not generate NO to 1% PU with the filtered MOF particles at equivalent 5% MOF loadings. The 1% PU composite generated an NO flux of 0.014 ± 0.008 nmol cm−2 min−1 over 17 ± 5 h reaction time, an approximately 4-fold increase in NO flux compared to the original 3% PU composite (albeit not statistically significantly, p = 0.11). These results seem to indicate that the effectiveness of a MOF composite material is dependent on selecting an appropriate polymer concentration for a particular MOF particle size (i.e., smaller MOF particles require lower polymer concentrations to exhibit greater NO generation), though further exploration is required to make a definitive statement.
To summarize, at low MOF loadings each increase in PU concentration resulted in substantial, statistically significant increases in NO flux and decreases in total reaction time. At high MOF loadings, increasing PU concentration produced moderate, statistically significant increases in NO flux with less impact on total reaction time.
3.2.2 Varying Metal–Organic Framework Loading at a Constant Polymer Concentration
At 1% PU concentration, we observed that increasing MOF loading from 1% to 5% significantly increased NO flux by 58% (p = 0.00016) and cut the total reaction time in half (p = 0.000015) (Figures 2G,H, 3D), but NO generation was not affected increasing MOF loading from 5% to 10%.
At 3% PU concentration, we saw a similar results to those at 1% PU. Increasing MOF loading from 1% to 5% increased NO flux by 150% (p = 0.00019) and decreased the total reaction time by 50% (p = 0.00020), while increasing MOF loading from 5% to 10% did not result in any significant effects on NO generation (Figures 2D–F, 3E).
At 5% PU concentration, we observed the opposite trend as the previous two PU concentrations. Increasing MOF loading from 1% to 5% did not impact NO generation, while increasing from 5% to 10% increased NO flux by 170% (p = 0.0018) and decreased the reaction time by 32% (p = 0.039) (Figures 2A–C, 3F).
Overall, increasing MOF loading at a constant PU concentration did not predictably increase NO generation, but generally NO flux was lower at low PU concentrations and greater at high PU concentrations.
3.2.3 Analysis of Relationship Between Metal–Organic Framework Loading and PU Concentration on Nitric Oxide Generation
Taken together, we saw that composite films with high MOF loadings and high polymer concentrations had greater rates of NO generation than those with low MOF loadings and low polymer concentrations. Increases in PU concentration more consistently increased NO generation compared to MOF loading; but notably, increases in either PU concentration or MOF loading never decreased rates of NO generation. There were only four instances in which there was no increase in NO generation observed after increasing either MOF loading or PU concentration that are worth exploring.
The first instance in which no metrics were affected by increasing PU concentration was from 3% to 5% at 5% MOF loading. This result is in contrast to increasing the PU concentration from 1% to 3% at the same MOF loading in which a significant increase in NO flux occurred. Interestingly, we noted that a significant decrease (p = 0.014) in water uptake occurred increasing 1%–3% PU, but no change from 3% to 5% PU. In examining water uptake for all experiments, a general pattern emerged where the greater the water uptake, the lower the NO flux; and we observed that the film with the greatest NO flux (10% CuBTTri/5% PU) had the lowest water uptake of all the composite films. We also found that changes in MOF loading at a constant PU concentration did not statistically impact water uptake, revealing that the concentration of the polymer is the major determinant for water uptake with CuBTTri/PU composites. The finding that water uptake is inversely proportional to NO generation is contrary to our initial thinking that greater rates of NO generation would be observed with greater swelling. This hypothesis was based on previous work by Neufeld et al. which found that the hydrophilic composite 10 wt.% CuBTTri/poly (vinyl alcohol) (203 ± 3% water uptake) generated NO while its hydrophobic counterpart 10 wt.% CuBTTri/Tecoflex SG-80A (2.0 ± 0.3% water uptake), did not [24]. Based on the results from our experiments, we concluded that there is an undetermined optimal level of water absorptivity unique to the composite polymer that enhances rates of NO generation.
The second two instances were observed under related sets of circumstances: when increasing MOF loading from 5% to 10% at both 1% and 3% PU concentrations. In contrast, the analogous increase at 5% PU resulted in the greatest NO flux among all experiments. As we noted previously, composite materials with the same PU concentration have similar measured water absorptivity, so there must be an alternative factor contributing to the observed phenomenon. Based on the available data, we hypothesize that at 10% MOF loading crowding within the composite at lower PU concentrations reduces the number of MOF catalyst sites accessible to GSNO resulting in no appreciable increase in rate of NO generation (see Figure 4A). Rather than evenly dispersed small, high exterior surface area MOF particles, crowding results in agglomerations or layers of MOF that more closely resemble larger, lower exterior surface area particles. The optical microscope images of these composites (Supplementary Figure S1) provide some evidence for this hypothesis. The images of 10% MOF composites at 1% and 3% PU have more MOF clustering and less free polymer space compared to the 10% MOF/5% PU film. This data shows that there is a limit to the effectiveness of increasing MOF loading to increase rate of NO generation without also increasing polymer concentration.
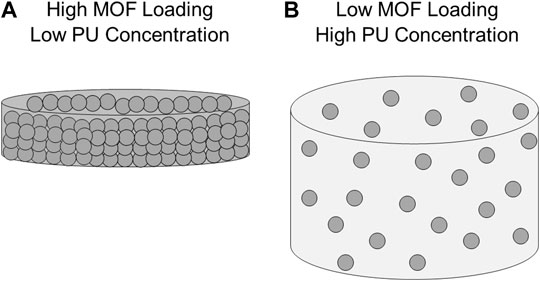
FIGURE 4. Hypothesized models of MOF composite NO generation. (A) High MOF loading, low PU concentration composites experience crowding in which MOF agglomerations or layers reduce total MOF surface area available for catalysis. (B) Low MOF loading, high PU concentration composites reduce analyte diffusion deep into center of film limiting number of accessible MOF particles for catalysis.
The fourth instance, increasing MOF loading from 1% to 5% at 5% PU, is an exception to the previous three instances. It is the only circumstance in which neither NO flux nor reaction time was enhanced by increasing the MOF loading from 1% to 5% but is affected by further increases from 5% to 10%. We propose that, in the same way MOF composites with high MOF loadings and low PU concentrations experience MOF crowding, MOF composites with low MOF loadings and high PU concentrations have inaccessible MOF particles deep in the core of the film (Figure 4B). In this view of the composite material, the MOF is evenly dispersed throughout the width and depth of the film and GSNO diffusion past exterior MOF particles to the center is minimal. This reasoning also extends to the filtered MOF composite films and provides an explanation for their limited NO generation capacity.
4 Conclusion
We found that MOF particle preparation, MOF loading, and PU concentration have major impacts on NO generation from MOF composite materials. In general, hand grinding the MOF prior to fabrication, higher MOF loading, and greater PU concentration increase rates of NO generation. Other important considerations include the water absorptivity of the composite material and MOF loading relative to PU concentration. This work provides insights for the rational design of catalytic MOF composites for medical device applications, highlighting the tunability of MOFs and MOF composites toward application-specific implementations. It also illustrates that while fundamental studies on a MOF catalyst in solution are important, the findings from those studies may not apply to the system in which the catalyst will be implemented.
Data Availability Statement
The raw data supporting the conclusion of this article will be made available by the authors, without undue reservation.
Author Contributions
AM conceived of the idea for this manuscript, collected and analyzed data, and wrote the manuscript. MR obtained funding for this project, provided guidance on study objectives and findings, and edited manuscript drafts. All authors listed have made a substantial, direct, and intellectual contribution to the work and approved it for publication.
Funding
This research was supported by the National Institutes of Health grant 1R01HL140301-01.
Conflict of Interest
The authors declare the following competing financial interest(s): Prof. MR is an equity holder in Diazamed, Inc. which has exclusively licensed the MOF platform from CSU Ventures. The other authors have no competing interests.
Publisher’s Note
All claims expressed in this article are solely those of the authors and do not necessarily represent those of their affiliated organizations, or those of the publisher, the editors and the reviewers. Any product that may be evaluated in this article, or claim that may be made by its manufacturer, is not guaranteed or endorsed by the publisher.
Acknowledgments
SEM and pXRD analyses conducted at Colorado State University Analytical Resources Core Facility, RRID:SCR_021758.
Supplementary Material
The Supplementary Material for this article can be found online at: https://www.frontiersin.org/articles/10.3389/fphy.2022.880841/full#supplementary-material
References
1. Kang Y-S, Lu Y, Chen K, Zhao Y, Wang P, Sun W-Y. Metal-organic Frameworks with Catalytic Centers: From Synthesis to Catalytic Application. Coord Chem Rev (2019) 378:262–80. doi:10.1016/j.ccr.2018.02.009
2. Altintas C, Altundal OF, Keskin S, Yildirim R. Machine Learning Meets with Metal Organic Frameworks for Gas Storage and Separation. J Chem Inf Model (2021) 61(5):2131–46. doi:10.1021/acs.jcim.1c00191
3. Abuzalat O, Tantawy H, Abdlaty R, Elfiky M, Baraka A. Advances of the Highly Efficient and Stable Visible Light Active Photocatalyst Zr(iv)-Phthalate Coordination Polymer for the Degradation of Organic Contaminants in Water. Dalt Trans (2021) 50(24):8600–11. doi:10.1039/d1dt01143j
4.H Garcia, and S Navalon, editors. Metal-Organic Frameworks: Applications in Separations and Catalysis. The Chemistry of Nanostructured Materials. Wiley VCH (2018).
5. Bavykina A, Kolobov N, Khan IS, Bau JA, Ramirez A, Gascon J. Metal-Organic Frameworks in Heterogeneous Catalysis: Recent Progress, New Trends, and Future Perspectives. Chem Rev (2020) 120(16):8468–535. doi:10.1021/acs.chemrev.9b00685
6. Xu C, Fang R, Luque R, Chen L, Li Y. Functional Metal-Organic Frameworks for Catalytic Applications. Coord Chem Rev (2019) 388:268–92. doi:10.1016/j.ccr.2019.03.005
7. Kirlikovali KO, Chen Z, Wang X, Mian MR, Alayoglu S, Islamoglu T, et al. Investigating the Influence of Hexanuclear Clusters in Isostructural Metal-Organic Frameworks on Toxic Gas Adsorption. ACS Appl Mater Inter (2022) 14(2):3048–56. doi:10.1021/acsami.1c20518
8. Stock N, Biswas S. Synthesis of Metal-Organic Frameworks (MOFs): Routes to Various MOF Topologies, Morphologies, and Composites. Chem Rev (2012) 112(2):933–69. doi:10.1021/cr200304e
9. Wang Z, Liu L, Li Z, Goyal N, Du T, He J, et al. Shaping of Metal-Organic Frameworks: A Review. Energy Fuels (2022) 36:2927–44. doi:10.1021/acs.energyfuels.1c03426
10. Ma Q, Zhang T, Wang B. Shaping of Metal-Organic Frameworks, a Critical Step toward Industrial Applications. Matter (2022) 5(4):1070–91. doi:10.1016/j.matt.2022.02.014
11. Kalaj M, Bentz KC, Ayala S, Palomba JM, Barcus KS, Katayama Y, et al. MOF-polymer Hybrid Materials: From Simple Composites to Tailored Architectures. Chem Rev (2020) 120(16):8267–302. doi:10.1021/acs.chemrev.9b00575
12. Kitao T, Zhang Y, Kitagawa S, Wang B, Uemura T. Hybridization of MOFs and Polymers. Chem Soc Rev (2017) 46(11):3108–33. doi:10.1039/c7cs00041c
13. Husna A, Hossain I, Jeong I, Kim T-H. Mixed Matrix Membranes for Efficient CO2 Separation Using an Engineered UiO-66 MOF in a Pebax Polymer. Polymers (2022) 14(4):655. doi:10.3390/polym14040655
14. Zhang W, Li B, Duan W, Yao X, Lu X, Li S, et al. Confined In Situ Polymerization in a Nanoscale Porphyrinic Metal-Organic Framework for Fluorescence Imaging-Guided Synergistic Phototherapy. Inorg Chem Front (2022) 9(4):670–7. doi:10.1039/d1qi01384j
15. Kobayashi Y, Honjo K, Kitagawa S, Uemura T. Preparation of Porous Polysaccharides Templated by Coordination Polymer with Three-Dimensional Nanochannels. ACS Appl Mater Inter (2017) 9(13):11373–9. doi:10.1021/acsami.6b15936
16. Zahir MH, Helal A, Hakeem AS. Hybrid polyMOF Materials Prepared by Combining an Organic Polymer with a MOF and Their Application for Solar Thermal Energy Storage. Energy Fuels (2021) 35(12):10199–209. doi:10.1021/acs.energyfuels.1c00390
17. Jiang Y, Sun J, Yang X, Shen J, Fu Y, Fan Y, et al. Cd-MOF@PVDF Mixed-Matrix Membrane with Good Catalytic Activity and Recyclability for the Production of Benzimidazole and Amino Acid Derivatives. Inorg Chem (2021) 60(3):2087–96. doi:10.1021/acs.inorgchem.1c00084
18. Gao K, Guo X, Zheng B, Wang J, Wang L. Investigation of Interface Compatibility in Stiff Polymer/metal-Organic Frameworks. Mater Today Chem (2021) 20:100458. doi:10.1016/j.mtchem.2021.100458
19. Palomba JM, Wirth DM, Kim JY, Kalaj M, Clarke EM, Peterson GW, et al. Strong, Ductile MOF-Poly(urethane Urea) Composites. Chem Mater (2021) 33(9):3164–71. doi:10.1021/acs.chemmater.0c04874
20. Denny MS, Kalaj M, Bentz KC, Cohen SM. Multicomponent Metal-Organic Framework Membranes for Advanced Functional Composites. Chem Sci (2018) 9(47):8842–9. doi:10.1039/c8sc02356e
21. Sorribas S, Kudasheva A, Almendro E, Zornoza B, de la Iglesia Ó, Téllez C, et al. Pervaporation and Membrane Reactor Performance of Polyimide Based Mixed Matrix Membranes Containing MOF HKUST-1. Chem Eng Sci (2015) 124:37–44. doi:10.1016/j.ces.2014.07.046
22. McCarthy DL, Liu J, Dwyer DB, Troiano JL, Boyer SM, Decoste JB, et al. Electrospun Metal-Organic Framework Polymer Composites for the Catalytic Degradation of Methyl Paraoxon. New J Chem (2017) 41(17):8748–53. doi:10.1039/c7nj00525c
23. Neufeld MJ, Lutzke A, Tapia JB, Reynolds MM. Metal-Organic Framework/Chitosan Hybrid Materials Promote Nitric Oxide Release from S-Nitrosoglutathione in Aqueous Solution. ACS Appl Mater Inter (2017) 9(6):5139–48. doi:10.1021/acsami.6b14937
24. Neufeld MJ, Lutzke A, Jones WM, Reynolds MM. Nitric Oxide Generation from Endogenous Substrates Using Metal-Organic Frameworks: Inclusion within Poly(vinyl Alcohol) Membranes to Investigate Reactivity and Therapeutic Potential. ACS Appl Mater Inter (2017) 9(41):35628–41. doi:10.1021/acsami.7b11846
25. Garren M, Maffe P, Melvin A, Griffin L, Wilson S, Douglass M, et al. Surface-Catalyzed Nitric Oxide Release via a Metal Organic Framework Enhances Antibacterial Surface Effects. ACS Appl Mater Inter (2021) 13:56931–43. doi:10.1021/acsami.1c17248
26. Harding JL, Metz JM, Reynolds MM. A Tunable, Stable, and Bioactive MOF Catalyst for Generating a Localized Therapeutic from Endogenous Sources. Adv Funct Mater (2014) 24(47):7503–9. doi:10.1002/adfm.201402529
27. Tuttle RR, Rubin HN, Rithner CD, Finke RG, Reynolds MM. Copper ion vs copper metal-organic framework catalyzed NO release from bioavailable S-Nitrosoglutathione en route to biomedical applications: Direct 1H NMR monitoring in water allowing identification of the distinct, true reaction stoichiometries and thiol dependencies. J Inorg Biochem (2019) 199(July):110760. doi:10.1016/j.jinorgbio.2019.110760
28. Moncada S, Higgs EA. The Discovery of Nitric Oxide and its Role in Vascular Biology. Br J Pharmacol (2006) 147:S193–S201. doi:10.1038/sj.bjp.0706458
29. Carpenter AW, Schoenfisch MH. Nitric Oxide Release: Part II. Therapeutic Applications. Chem Soc Rev (2012) 41(10):3742–52. doi:10.1039/c2cs15273h
30. Wo Y, Brisbois EJ, Bartlett RH, Meyerhoff ME. Recent Advances in Thromboresistant and Antimicrobial Polymers for Biomedical Applications: Just Say Yes to Nitric Oxide (NO). Biomater Sci (2016) 4(8):1161–83. doi:10.1039/c6bm00271d
31. Vaughn MW, Kuo L, Liao JC. Estimation of Nitric Oxide Production and Reactionrates in Tissue by Use of a Mathematical Model. Am J Physiology-Heart Circulatory Physiol (1998) 274(6):H2163–H2176. doi:10.1152/ajpheart.1998.274.6.h2163
32. Radomski MW, Palmer RMJ, Moncada S. The Role of Nitric Oxide and cGMP in Platelet Adhesion to Vascular Endothelium. Biochem Biophysical Res Commun (1987) 148(3):1482–9. doi:10.1016/s0006-291x(87)80299-1
33. Cha KH, Wang X, Meyerhoff ME. Nitric Oxide Release for Improving Performance of Implantable Chemical Sensors - A Review. Appl Mater Today (2017) 9(November):589–97. doi:10.1016/j.apmt.2017.10.002
34. Usman KAS, Maina JW, Seyedin S, Conato MT, Payawan LM, Dumée LF, et al. Downsizing Metal–Organic Frameworks by Bottom-Up and Top-Down Methods. NPG Asia Mater (2020) 12(1):1–18. doi:10.1038/s41427-020-00240-5
35. Tuttle RR, Folkman SJ, Rubin HN, Finke RG, Reynolds MM. Copper Metal-Organic Framework Surface Catalysis: Catalyst Poisoning, IR Spectroscopic, and Kinetic Evidence Addressing the Nature and Number of the Catalytically Active Sites en Route to Improved Applications. ACS Appl Mater Inter (2020) 12(35):39043–55. doi:10.1021/acsami.0c08961
36. Defelice J, Lipson JEG. The Influence of Additives on Polymer Matrix Mobility and the Glass Transition. Soft Matter (2021) 17(2):376–87. doi:10.1039/d0sm01634a
37. Bansal A, Yang H, Li C, Cho K, Benicewicz BC, Kumar SK, et al. Quantitative Equivalence between Polymer Nanocomposites and Thin Polymer Films. Nat Mater (2005) 4(9):693–8. doi:10.1038/nmat1447
38. Sastri VR. Engineering Thermoplastics. In: Plastics in Medical Devices (2014). p. 121–72. doi:10.1016/b978-1-4557-3201-2.00007-0
39. Ahmadi Y, Kim K-H. Functionalization and Customization of Polyurethanes for Biosensing Applications: A State-Of-The-Art Review. Trac Trends Anal Chem (2020) 126:115881. doi:10.1016/j.trac.2020.115881
40. Rusu LC, Ardelean LC, Jitariu AA, Miu CA, Streian CG. An Insight into the Structural Diversity and Clinical Applicability of Polyurethanes in Biomedicine. Polymers (Basel) (2020) 12(1197):1–22. doi:10.3390/polym12051197
41. Tan J, Chang YC, Tang Q, Yang YL, Tseng TF. Radio Frequency-Based Implantable Glucose Biosensor. Int J Electrochem Sci (2022) 17:1–15. doi:10.20964/2022.01.27
42. Barde M, Davis M, Rangari S, Mendis HC, De La Fuente L, Auad ML. Development of Antimicrobial-Loaded Polyurethane Films for Drug-Eluting Catheters. J Appl Polym Sci (2018) 135(27):46467. doi:10.1002/app.46467
43. Harding JL, Reynolds MM. Combating Medical Device Fouling. Trends Biotechnol (2014) 32(3):140–6. doi:10.1016/j.tibtech.2013.12.004
44. Moreira J, Vale AC, Alves NM. Spin-coated Freestanding Films for Biomedical Applications. J Mater Chem B (2021) 9(18):3778–99. doi:10.1039/d1tb00233c
45. Norrman K, Ghanbari-Siahkali A, Larsen NB. 6 Studies of Spin-Coated Polymer Films. Annu Rep Prog Chem Sect C (2005) 101:174–201. doi:10.1039/b408857n
Keywords: metal-organic frameworks, nitric oxide, composite materials, biocompatible polymers, biomaterials, biomedical coating
Citation: Melvin AC and Reynolds MM (2022) Systematic Exploration of a Catalytic Metal–Organic Framework/Polyurethane Composite for Medical Device Applications: Effects of MOF Particle Size, MOF Loading, and Polymer Concentration on Composite Material Activity. Front. Phys. 10:880841. doi: 10.3389/fphy.2022.880841
Received: 21 February 2022; Accepted: 11 May 2022;
Published: 09 June 2022.
Edited by:
Ruwan Sumanasinghe, Cook Medical Inc., United StatesReviewed by:
Ramy Abdlaty, McMaster University, CanadaNiravkumar J. Joshi, Federal University of ABC, Brazil
Copyright © 2022 Melvin and Reynolds. This is an open-access article distributed under the terms of the Creative Commons Attribution License (CC BY). The use, distribution or reproduction in other forums is permitted, provided the original author(s) and the copyright owner(s) are credited and that the original publication in this journal is cited, in accordance with accepted academic practice. No use, distribution or reproduction is permitted which does not comply with these terms.
*Correspondence: Melissa M. Reynolds, TWVsaXNzYS5SZXlub2xkc0Bjb2xvc3RhdGUuZWR1