
ORIGINAL RESEARCH article

Front. Phys., 11 May 2022
Sec. Optics and Photonics
This article is part of the Research Topic High-precision EUV and X-ray Optics for Advanced Photon Source Facilities View all 10 articles

Measurement Uncertainty of Highly Asymmetrically Curved Elliptical Mirrors Using Multi-Pitch Slope Stitching Technique

Lei Huang
Lei Huang1*Tianyi WangTianyi Wang1Franois PolackFrançois Polack2Josep NicolasJosep Nicolas3Kashmira NakhodaKashmira Nakhoda1Mourad IdirMourad Idir1
  • 1National Synchrotron Light Source II, Brookhaven National Laboratory, Upton, NY, United States
  • 2Synchrotron SOLEIL, L’Orme des Merisiers, Gif-Sur-Yvette, France
  • 3ALBA Synchrotron Light Source, Cerdanyola del Vallès, Spain

Soft X-ray off-axis elliptical mirrors bring new challenges for X-ray mirror metrology. These highly asymmetrically curved elliptical cylindrical mirrors with a total slope range >10 mrad are extremely challenging to measure. Their total slope range exceeds the measuring range of most angular sensors used for X-ray mirror inspection. To overcome this problem, it is possible to stitch partial slope data by measuring the mirror at different pitch angles (multi-pitch angles). By revisiting the theory of the multi-pitch Nano-accuracy Surface Profiler (NSP), we derive the sampling position error on the mirror surface as a function of the mirror height profile and the measurement error of the pitch rotation center. When measuring “extreme”, highly asymmetrically curved, elliptical mirrors, the calculation of the mirror height profile with iterative reconstruction outperforms the classical “flat assumption” (i.e., assuming that the mirror sag is negligible). As demonstrated by our simulations, a proper tolerance evaluation on the measurement of pitch rotation center is needed to assess the measurement accuracy (systematic error) for these strongly aspherical mirrors using the multi-pitch NSP technique. Taking a real design of an “extreme” elliptical mirror as a case study, we conduct a Monte Carlo simulation to mimic the measurement and characterization process to analyze the impact of several error sources. With the measurement uncertainty of the pitch rotation center, the multi-pitch NSP measurement can estimate the grazing angle θ and the chief ray location xo with their uncertainties, as well as the slope residuals.

Introduction

To match the evolution of the light source facilities (synchrotron radiation and free-electron lasers), X-ray optical elements must be at the diffraction limit to deliver the high-quality X-ray beam to the end station for scientific research. As a type of widely used X-ray optics, X-ray mirrors are required to be fabricated at the sub-100 nrad Root Mean Square (RMS) level for residual slope errors or the sub-nm RMS for residual height errors to preserve the wavefront of the incoming X-ray beam and produce a diffraction limited focal spot. Special dedicated optical metrology systems were developed to characterize such high-precision long rectangular X-ray mirrors. The Long Trace Profiler (LTP) [1] and the Nanometer Optical component measuring Machine (NOM) [2] are two classical optical slope profilers widely used in the light source facilities all over the world [38]. With slightly different configuration, the Nano-accuracy Surface Profiler (NSP) [9] was developed with two separate beam arms. The sample beam arm (with the sample beam autocollimator) scans the test mirror surface (x-scan) with a fixed working distance, while the reference beam arm (with reference beam autocollimator) monitors the carriage wobble.

To meet the increasing need of the scientific research, more strongly curved focusing mirrors have been proposed for soft X-ray beamline. A soft X-ray nanoprobe will offer nano-imaging and spectroscopy tools non-destructive capabilities to study advanced materials using Nano ARPES and Nano RIXS experimental techniques [10]. To produce a diffraction-limited spot size for low energy (high λ), X-ray mirrors with high numerical aperture are required. These mirrors can have a total slope range larger than the current measuring range of the LTP/NOM/NSP (10 mrad). To overcome this problem, it is possible to stitch partial slope data recorded by measuring the mirror at different pitch angles. Based on this idea, Polack et al. proposed the Linearity Error Elimination Procedure (LEEP) algorithm [11]. This algorithm can reconstruct not only the mirror slope profile, but also the instrument error of the optical head at the same time. A modified LEEP algorithm was proposed for the NSP setup to reconstruct the instrument error of the sample-beam autocollimator [12]. The ambiguity in the algorithm was addressed by proposing several regularizations in the data acquisition and the algorithm constraints.

On the experimental side, when the LEEP algorithm or any other stitching algorithm is used where the pitch angle must be adjusted between different x-scans, the rotation center of the pitch needs to be known to a certain extent. The error on the position of the rotation center leads to pitch-dependent discrepancies of the sampling positions on the test mirror. For circular cylinders and shallow elliptical mirrors (few mrad total slope), the pitch rotation center does not need to be known with high accuracy, because the sampling position errors introduce little systematic slope errors in the final results (<10 nrad RMS). However, when highly curved and asymmetric elliptical mirrors must be measured, it becomes critical to know the pitch rotation center location with enough accuracy as this error leads to nonnegligible total systematic slope error contribution. In addition, the commonly applied “flat assumption” in the LEEP algorithm or the multi-pitch NSP technique as shown in Figure 1, assuming that the mirror sag is negligible, may no longer be valid when measuring such “extreme” ellipses.

FIGURE 1
www.frontiersin.org

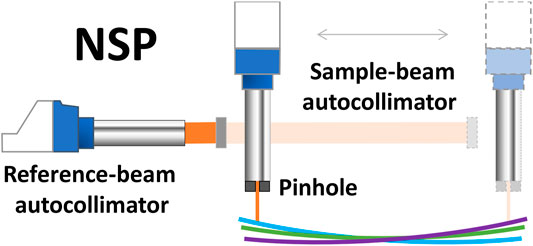
FIGURE 1. The schematic diagram of the multi-pitch NSP setup.

In this work, the theory of the multi-pitch NSP technique is briefly reviewed, followed by the analysis of the influence of the pitch rotation center location with respect to the surface of the mirror under test. We propose a method to overcome the invalid “flat assumption” issue in the reconstruction of “extreme” ellipses. Then we focus on the measurement tolerance of the pitch rotation center location in the horizontal and the vertical directions. Series of simulations with different ellipse geometries are carried out to study the trend between the measurement tolerance of the pitch rotation center location and the curvature variation of the aspherical mirrors. We implement a Monte Carlo simulation with a real mirror design. Taking the uncertainty of the pitch rotation center measurement and the uncertainty of the angle measurement as two inputs, the multi-pitch NSP technique with the Monte Carlo simulation can give the slope residuals and an estimation of the grazing angle θ and the chief ray location xo with their respective uncertainties.

Theory of the Multi-Pitch NSP Technique

Based on the redundant dataset acquired from all the x-scans for different pitch angles, the multi-pitch NSP technique can simultaneously calculate the mirror surface slope, the instrument error of the sample-beam autocollimator, and the introduced pitch angles [12]. For simplicity, we define the origin of the world coordinate system (xw, zw)=(0, 0) at the rotation center of the pitch angle α as shown in Figure 2. The direction of the x-translation in the NSP is defined as the direction of Xw axis in the world coordinate system, while the Zw axis in the world coordinate system points upwards.

FIGURE 2
www.frontiersin.org

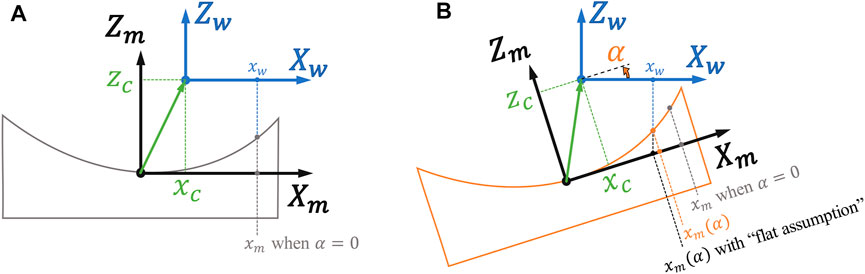
FIGURE 2. The world coordinate system (Xw, Zw) and the mirror coordinate system (Xm, Zm) defined in the multi-pitch NSP technique when the pitch angle α=0 (A) and α0 (B).

The center point of the x-scan range on the mirror surface is defined as the origin of the mirror coordinate system (xm, zm)=(0, 0). The x-axis of the mirror coordinate system Xm is along its tangential direction and shares the same direction of Xw when the pitch angle α=0 as shown in Figure 2A, but they are different for other pitch angles as illustrated in Figure 2B. The Zm axis of the mirror coordinate system is defined along the surface normal and pointing outwards the mirror surface. When the pitch angle α=0, the Zm axis shares the same direction of Zw. The coordinates of the pitch rotation center, expressed in the local frame of the mirror coordinate system, are given by (xm, zm)=(xc, zc). It is illustrated in Figure 2 that, for the same world abscissa xw, the mirror abscissa xm can be different at different pitch angles α. Moreover, as shown in Figure 2B, there is a clear difference in the xm calculation with and without “flat assumption” which will be addressed in Iterative Reconstruction.

After a rotation in pitch with an angle α, one point (xm, zm) in mirror coordinate system can be transferred to the world coordinate system as

[xwzw]=[cosαsinαsinαcosα][xmxczmzc].(1)

The x position in world coordinate system can be calculated as

xw=(xmxc)cosα(zmzc)sinα.(2)

For a particular measurement (xc, zc, and zm are determinate), the xm can be expressed as a function of xw and α.

xm(xw, α)=xw+(zmzc)sinαcosα+xc.(3)

Under the n th actively-introduced pitch angle αn, the angular signals captured in the sample-beam arm sn(xw) and the reference-beam arm rn(xw) can be explained by the mirror slope m(xm) at the actual sampling position xm and the instrument error of the sample-beam autocollimator e(sn(xw)) at its current reading sn(xw) as well as the uncorrelated additive random noise na.

sn(xw)+rn(xw)m(xm(xw,α))+e(sn(xw))+αn+na,n[0,N1].(4)

Here the instrument error of the reference-beam autocollimator is ignored in our model, as the reference-beam angle rn(xw) varies in a small range, usually <10 μrad, if an air-bearing translation stage is used.

The mirror slope m(xm) and the instrument error of sample-beam autocollimator e(sn(xw)) are then represented by two independent uniform cubic B-splines M(xm) and E(s(xw)) as m(xm)=M(xm)cm and e(sn(xw))=E(sn(xw)) ce, respectively, where cm and ce are column vectors containing the B-spline coefficients. Therefore, the mathematical model of multi-pitch NSP becomes

sn(xw)+rn(xw)M(xm(xw,αn))cm+E(sn(xw)) ce+αn+na,  n[0, N1],(5)

Once the coefficients cm and ce are determined, we can reconstruct the mirror slope m(xm) and the sample-beam instrument error e(sn(xw)). The multi-pitch NSP algorithm is essentially to optimize the B-spline coefficients cm and ce, and the pitch angles α=[α0,α1,, αN1]. In addition, to avoid the ambiguities in the optimized results, several regularizations are applied in the designs of the data acquisition and the constraints in algorithm [12]. Putting the constraints on the first pitch angle, the instrument error intercept, and the linear term, the optimization can be expressed as

c^m,c^e, α^=argmin cm, ce, α n=0N1xw(sn(xw)+rn(xw)M(xm(xw,αn))cmE(sn(xw))ceαn)2s.t.α0=0,E(0)ce=0,sE(s)ce=0.(6)

where the first pitch angle α0 is constrained to 0. When the slope signal s=0, the instrument error intercept is constrained as e(0)=E(0) ce=0. If we fit the instrument error e(s) up to the linear terms, we have e(s)=E(s) cee(0)+εs, where s is the column vector of all slope sample values, the symbol stands for equal in a least squares sense. and ε is the linear term coefficient. Since we have constrained the instrument error intercept e(0)=0, we have E(s) ceεs. As the third constraint, the linear term coefficient ε is also constrained to 0, so we have ε=(ss)1sE(s)ce=0. Because ss=|s|20 is a nonzero scalar value, this constraint is simplified as s E(s) ce=0.

One thing to highlight is that nonuniform pitch steps Δαn are necessary in data acquisition to avoid the periodic errors in the optimization results. Technical details on the ambiguities and the regularization can be found in Ref. [12] with more simulations and discussions.

To calculate the sampling position xm(xw, αn) in the mirror coordinate system from the NSP x-scanning position xw and pitch-scanning angle α by Eq. 3, we need to know the profile of the mirror height zm and where the pitch rotation center (xc, zc) is in the mirror coordinate system. In the following sections, we are discussing the necessary accuracy of these different values.

Theoretical Analysis of the Sampling Position Error at Different Pitch Angles Considering the Mirror Height Profile and the Measurement Error of the Pitch Rotation Center Location

The pitch rotation center (xc,zc) can be determined using additional metrology instruments. The measurement error of the pitch rotation center can be expressed as exc=x^cxc, and ezc=z^czc, where (x^c, z^c) is the measured pitch rotation center. If the estimated mirror height profile is symbolized as z^m, the estimation error is ezm=z^mzm. In a real measurement, the dwell position of the x-stage x^w in the scans are defined as

x^w=(xmx^c)cosα(z^mzc)sinα.(7)

If we have a measurement error of exc when determining xc, then the true dwell position xw is

xw=x^w+exc=x^w+x^cxc.(8)

Based on Eq. 3, the estimated sampling position on the mirror x^m is

x^m=x^w+(z^mz^c)sinαcosα+x^c,(9)

And the true sampling position xm is

xm=xw+(zmzc)sinαcosα+xc.(10)

The sampling position error exm=x^mxm in the mirror coordinate system is

exm=x^mxm=(x^w+(z^mz^c)sinα)cosα(x^w+x^cxc+(zmzc)sinα)cosα+x^cxc.(11)

With some simplifications, it becomes

exm=[(z^mzm)(z^czc)]tanα(x^cxc)1cosαcosα.(12)

Finally, we have the sampling position error as

exmezmαezcαexcα22.(13)

Considering the pitch angle α1 rad, the error ezc will contribute a sampling position error of ezcα in Eq. 13, while exc only gives excα2/2 error on xm. It means that the error ezc has more impact on the multi-pitch NSP results than the error exc.

By using a simple measurement tool, such as a metric ruler, and the mechanical tolerances of the pitch rotation system, it is not difficult to determine the pitch rotation center location with a few mm accuracy. For a circular cylinder, this level of uncertainty is enough. The slope profile of a circular cylinder is linear with xm. In this case, the reconstruction is not sensitive to the measurement error ezc, because the slope error with a constant sampling error ezcαn at the n th pitch αn due to ezc in Eq. 13 will almost be equivalent to a slope offset on this linear slope profile. This slope offset will be treated as a pitch offset and will not affect the slope result by using the reconstruction algorithm. However, if the test mirror become strongly aspherical, the tolerance of the measurement on the pitch rotation center location becomes tighter, especially for the vertical distance zc. Since the slope profile of an aspherical mirror has nonlinear terms, the sampling error exm will lead to slope errors from these nonlinear terms. This becomes an important error source of the reconstruction in the multi-pitch NSP technique. A tolerance value is needed to control this type of error in the reconstruction result.

For simplicity, the mirror height profile zm is usually assumed as a flat surface, i.e., z^m=0. This “flat assumption” can be used when the mirror sag is much smaller than the tolerance of ezc. However, if the tolerance for ezc starts to be comparable to the mirror sag, its contribution ezmα to the sampling position error exm in Eq. 13 cannot be ignored and this will severely affect the reconstruction accuracy. A better estimate of the mirror height profile zm is necessary. Two options can be used: the known mirror shape parameters or an iterative reconstruction with an initial guess.

Simulation Study on Multi-Pitch NSP With “Extreme” Ellipses

To study the influence of ezm, exc, and ezc on the reconstruction results we have simulated the multi-pitch NSP data acquisition process as illustrated in Figure 3. This simulation features random variations of the pitch angles, the sample-beam instrument error that is an additive random noise na, and the measurement errors of exc and ezc.

FIGURE 3
www.frontiersin.org

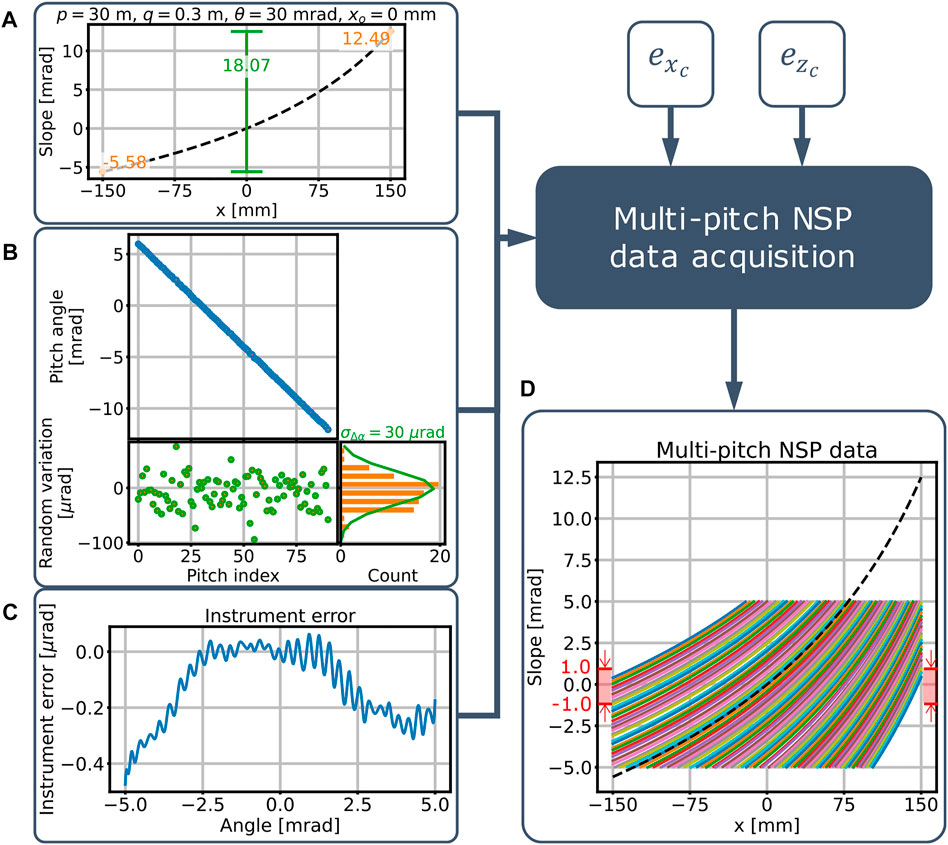
FIGURE 3. The simulation of the multi-pitch NSP dataset. (A) the tangential slope of the elliptical cylinder with the default parameters, (B) the pitch angle and its random variations in step, (C) the instrument error of sample-beam autocollimator from a real multi-pitch NSP measurement, and (D) the simulated multi-pitch NSP data with the dashed curve showing the whole slope profile of the test mirror.

Descriptions of the Multi-Pitch NSP Simulations

In our simulations, as shown in Figure 3A, we used a default ellipse with the following parameters: the source distance p= 30 m, the image distance q= 0.3 m, the grazing angle θ= 30 mrad, and the tangential mirror length L= 0.3 m (total slope = 18.07 mrad). The mirror default parameters will be modified to make different comparisons.

To avoid the known periodic errors in the reconstruction [12], pitch steps with small random variations are implemented. For simplicity as shown in Figure 3B, we choose the average pitch step Δα¯= 0.2 mrad and the standard deviation of the random variation on the pitch step is 30 µrad. The starting and ending pitch angles are determined by the slope range of the test mirror. The whole multi-pitch scan starts and finishes at angle values within (−1, 1) mrad at the two ends of the scanning range as shown in Figure 3D. The slope measuring range is set to be ± 5 mrad like the sample-beam autocollimator installed in our NSP instrument.

The instrument error used in the simulation shown in Figure 3C is a reconstruction of the instrument error from a real multi-pitch NSP experiment [12]. The measurement error of the pitch rotation center exc and ezc are also considered in the data acquisition when calculating the sampling position on the mirror xm. We add the normally distributed random angular noises na with a standard deviation σna=70 nrad, which is a typical value based on our real NSP measurement. Finally, the multi-pitch NSP data is simulated as shown in Figure 3D.

Target Ellipse Fitting

For the characterization of synchrotron mirrors, the target ellipse fitting on slope is usually implemented with p, q, and θ fixed and the chief ray position xo and the tilt (the slope bias) optimized. But in this work focusing on the extreme” ellipses, we include the grazing angle θ into the optimization with the following considerations:

1) The source and image distance values p and q are usually more constrained in most applications.

2) By changing the grazing angle θ with Δθ, the corresponding focus displacement will be 2qΔθ. The q value for an “extreme” ellipse is commonly much shorter comparing to a “relaxed” ellipse. With the same restrict on the focus displacement, the tolerance of θ becomes larger when fit an “extreme” ellipse.

Therefore, we fit the reconstructed slope to the best ellipse with fixed p and q, while θ, xo, and the tilt are optimized. As a fitting result, we can get the best fitted θ and xo with their confidence intervals, and the associated slope residuals.

Iterative Reconstruction

Our first example is to demonstrate that the “flat assumption” (z^m=0) does not work for the ellipse with the default parameters: p= 30 m, q= 0.3 m, θ= 30 mrad, and L= 0.3 m (mirror sag = 777 µm), but it works well for some more “relaxed” ellipses (for example with the q= 0.6 m (mirror sag = 328 µm) as illustrated in Figure 4A). For this purpose, the measurement error of the pitch rotation center is set as exc=0 and ezc=0. In this case, theoretically we should reconstruct the mirror slope “perfectly” with only the algorithm error and the random errors due to the slope noise.

FIGURE 4
www.frontiersin.org

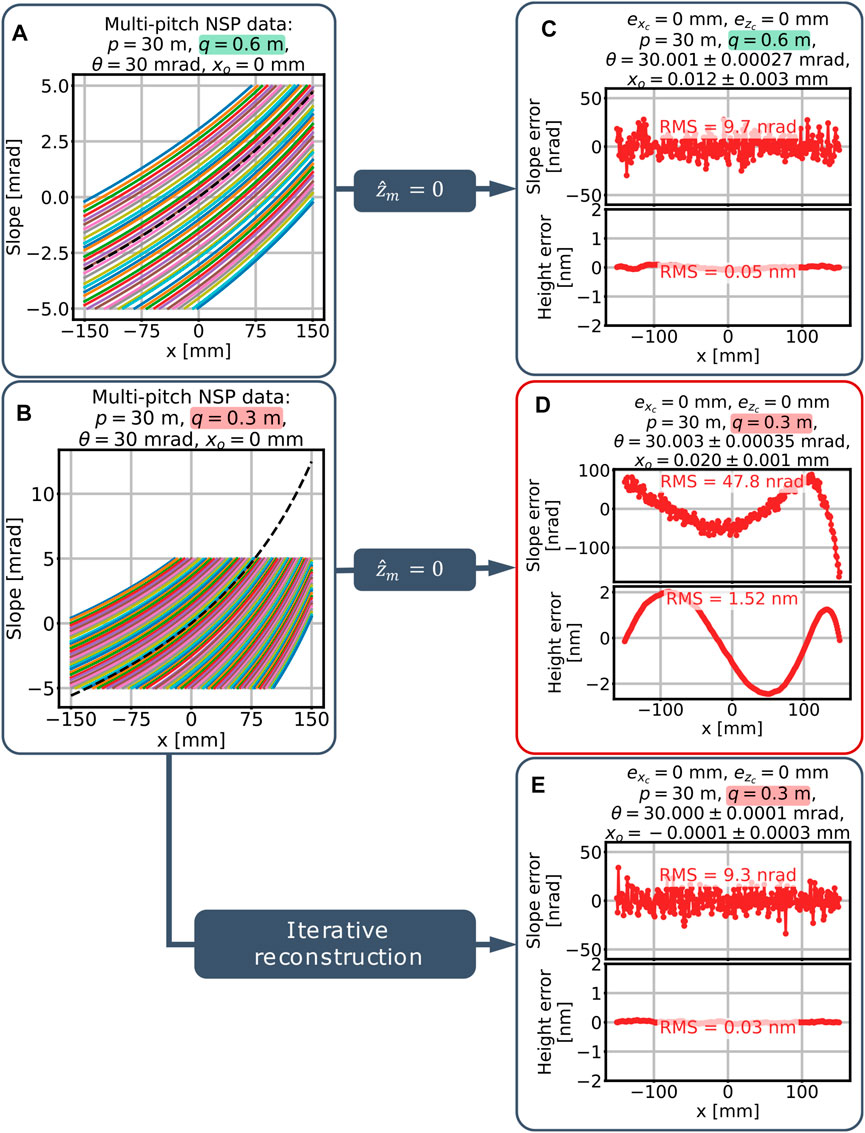
FIGURE 4. The “flat assumption” (z^m=0) does not always work when reconstructing the “extreme” ellipse in multi-pitch NSP. It is demonstrated with the simulated multi-pitch NSP dataset for (A) a “relaxed” ellipse with p= 30 m, q= 0.6 m, θ= 30 mrad (mirror sag = 328 µm), (B) the default ellipse with p= 30 m, q= 0.3 m, θ= 30 mrad (mirror sag = 777 µm). By optimizing θ and xo, the best fitting results of (C) the “relaxed ellipse” with the “flat assumption”, (D) the default ellipse with flat assumption, and (E) the default ellipse with the proposed iterative reconstruction.

However, as demonstrated in Figure 4, the “flat assumption” does not always give a perfect reconstruction. For the more “relaxed” ellipse with q= 0.6 m in Figure 4A, the reconstruction assuming z^m=0 ends up with an acceptable fitting result in Figure 4C: small slope residuals (due to the redundancy, the RMS of the slope residuals is much less than the standard deviation of the slope noises), about only 1 µrad grazing angle change, and 9 µm xo adjustment. By contrast, the reconstruction error becomes much larger for a more “extreme” elliptical mirror in Figure 4B using the “flat assumption” (z^m=0). As shown in Figure 4D, even after the best fit adjusting θ and xo with 3 µrad and 20 μm, respectively, we still have more than 40 nrad RMS slope residuals giving about 1.5 nm RMS residuals in height as a systematic error from the metrology instrument. This is dominated by the algorithm error, which is too large for the X-ray mirror characterization. Therefore, the “flat assumption” (z^m=0) cannot always provide correct results even if we have no measurement errors on the pitch rotation center exc=0 and ezc=0.

To measure “extreme” elliptical mirrors, we need to consider the mirror height profile z^m. To solve this problem, we propose to use the “flat assumption” to get a reconstructed mirror slope first and then integrate the obtained slope to get the mirror height profile. This mirror height profile is then used as our estimation for z^m to recalculate the slope with the multi-pitch NSP approach. This iterative reconstruction process usually needs only one iteration to give a satisfactory result as shown in Figure 4E.

Using this approach, the z^m estimation issue is resolved for “extreme” elliptical mirrors. Since many of the mirrors in this study are extremely “extreme” ellipses which cannot be assumed as “flat”, we apply the proposed iterative reconstruction method by default to enable the following study on the tolerance of the pitch rotation center location errors exc and ezc for different elliptical mirrors.

Simulation Study on the Measurement Tolerance of the Pitch Rotation Center

To conduct a tolerance study, we need to set a threshold. Here we set the threshold on the systematic slope error contributed from exc and ezc. If 100 nrad slope accuracy is expected, the systematic slope error contribution from exc and ezc should be less than 10 nrad RMS.

The error contribution due to exc and ezc is isolated by setting the additive random noise on slope in the model to zero. Therefore, by meeting the reconstruction error <10 nrad RMS on the slope residuals, we can give a tolerance to the pitch rotation center error exc and ezc.

Default Ellipse Case and Influence of Shape Parameters

Here we take the default ellipse (p= 30 m, q= 0.3 m, θ= 30 mrad, and L= 0.3 m) as our sample mirror. When the measurement errors exc changes from −10 to 10 mm, we can see in Figure 5A that the slope residuals is less than 10 nrad RMS (the red dash line in Figure 5) after θ and xo optimization, so the tolerance of exc is obviously much larger than ± 10 mm. It is easy to meet this tolerance requirement.

FIGURE 5
www.frontiersin.org

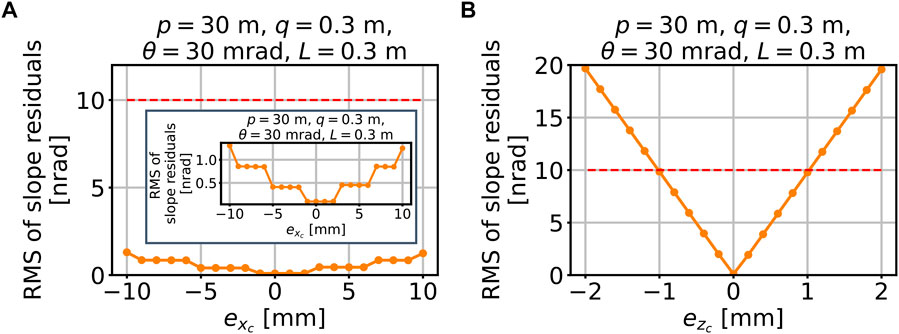
FIGURE 5. Simulation with the default ellipse demonstrates the tolerance of ezc is much tighter than that of exc:(A) the slope residuals due to exc less than 10 nrad RMS within ± 10 mm range. (B) the slope residuals due to ezc across the red dash line (10 nrad RMS threshold) at ezc± 1 mm for this ellipse.

From Figure 5B, we can see that only when the measurement errors on the vertical distance ezc changes within ±1 mm, after θ and xo are optimized, the RMS value of the slope residuals are smaller than 10 nrad.

Following Eq. 13 and Figure 5, the tolerance of exc is much larger than the tolerance of ezc and it is easier to measure xc with the required accuracy in practice. For this reason, we will focus on the tolerance of ezc in the following study.

Starting with the default ellipse parameters, we then modify one of the parameters q, θ, and L within a certain range while the others are maintained at their default values. We can then study the tolerance values of ezc with different ellipse geometries. First, we change the image distance q from 0.2 to 0.6 m with 0.1 m step, and the corresponding tolerance values of ezc are shown in Figure 6A. Then, we vary the grazing angle θ from 10 mrad up to 40 mrad with 5 mrad step and the tolerance values of ezc are shown in Figure 6B. Finally, the mirror length L is changed from 0.15 to 0.4 m with 0.05 m step. The tolerance values of ezc are shown in Figure 6C.

FIGURE 6
www.frontiersin.org

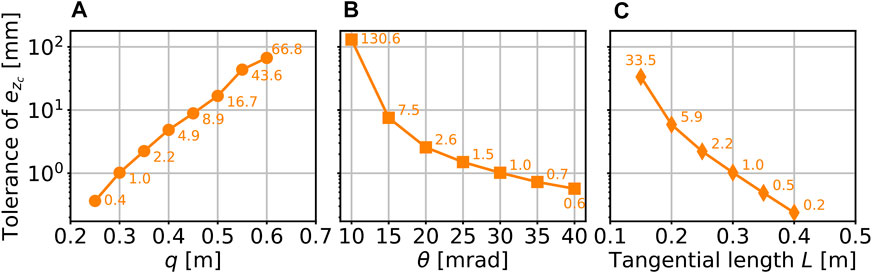
FIGURE 6. Tolerance of ezc becomes tighter when the ellipse becomes more “extreme”. From the default ellipse, change one parameter at a time: (A) the q value, (B) the θ value, (C) the length of the optical area.

The results in Figure 6 clearly reveal that the more “extreme” are the ellipses, with shorter image distance q, larger grazing angle θ, or longer optical length L, the tighter are the tolerance values of ezc (in orange in Figure 6). Therefore, measuring “extreme” ellipses using the multi-pitch NSP technique brings new challenges on the zc measurement. In the next section, we present some results of the ezc tolerance calculations for two real “extreme” elliptical mirrors from an actual beamline optical design.

Two Ellipses From Beamline Optical Designs

The parameters of two elliptical cylindrical mirrors are listed in Table 1. These two mirrors are taken from two different sets of Kirkpatrick-Baez mirror systems proposed for the NSLS-II ARI beamlines.

TABLE 1
www.frontiersin.org

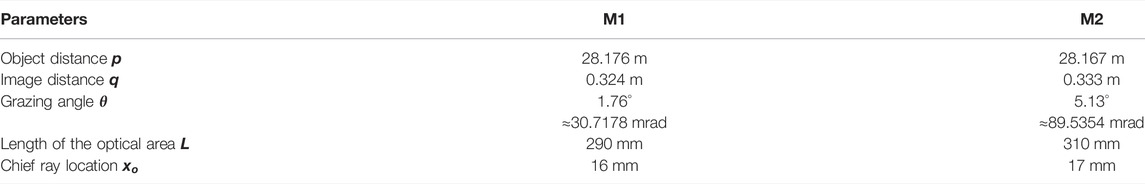
TABLE 1. Parameters of the two elliptical cylindrical mirrors.

To give a better description of these ellipse parameters, the height, slope, Radius of Curvature (RoC), and curvature variations of M1 and M2 are plotted in Figure 7. For M1, the mirror sag is about 0.5 mm, and its total slope range is almost 15 mrad, which is beyond the 10-mrad angular measuring range of the sampling-beam autocollimator in the NSP instrument. It is therefore necessary to change the pitch angle to measure the whole tangential profile of M1. Compared to M1, M2 is even more “extreme”. The mirror sag is 1.65 mm and the total slope range is about 45 mrad.

FIGURE 7
www.frontiersin.org

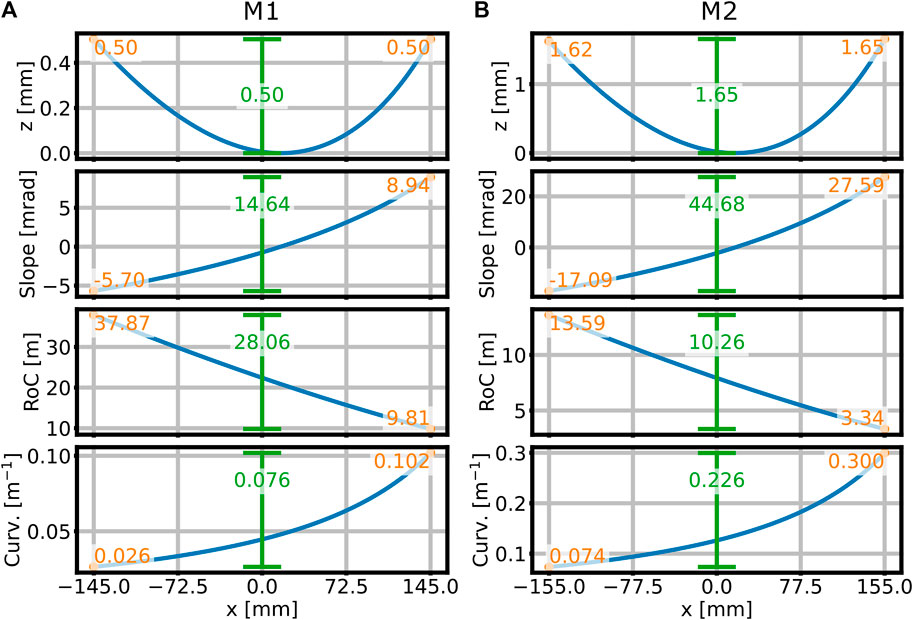
FIGURE 7. The height, slope, RoC, and curvature profiles of M1 on the (A) and M2 on the (B).

These mirrors are intended to focus the incoming X-ray beam to a diffraction limited spot size at 1 keV and 250 eV for M1 and M2, respectively (the diffraction limited spot size of about 37 and 72.6 nm for M1 and M2). To satisfy the Maréchal criterion, the height error of the diffraction limited mirror should be less than λ/(28θ). This means that the mirror height error must be in the order of 1.16 nm RMS and 1.98 nm RMS for M1 and M2, respectively.

In this study, we disregard the RoC limit by the sample-beam autocollimator in our NSP instrument (around 7–8 m). We assume the optical head can measure the mirror surfaces with these RoC values. Our main objective is to evaluate the tolerance of the pitch rotation center location. The RMS values of the multi-pitch NSP reconstructed slope residuals are calculated when the ezc varies within ± 3 mm for M1 and ±0.3 mm for M2 as shown in Figure 8.

FIGURE 8
www.frontiersin.org

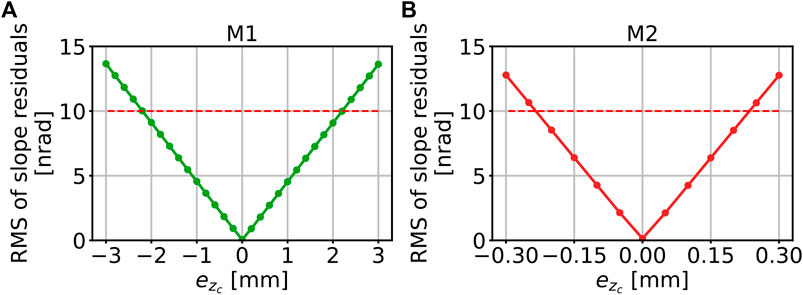
FIGURE 8. The RMS value of the slope residuals varies along the measurement error of the vertical distance ezc for the M1 on the (A) and the M2 on the (B).

Applying the 10-nrad-RMS threshold as the error budget analyzed above, the tolerance of the ezc for M1 is about ± 2.2 mm. The tolerance for the ezc for M2 is only around ± 0.23 mm, which is very tight and not easy to measure with simple approaches.

By numerically searching the intersections between the curve of the RMS of slope residuals and the red dash line of 10-nrad-RMS threshold, we can determine the tolerance values of
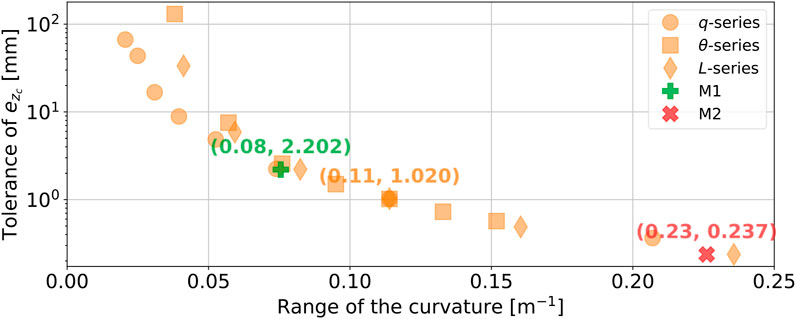
 ezc for all ellipses of this study. If we use the variation range of the mirror curvature (1/RoC) as the horizontal axis, these different ellipses in series (q-, θ-, and L-series in Figure 6) and two real mirror designs (M1 and M2) can be included into one unified plot as shown in Figure 9.

FIGURE 9
www.frontiersin.org

FIGURE 9. The ezc tolerance values versus the curvature variation ranges of the ellipses of q-series, θ-series, L-series, M1, and M2. The tolerance of the ezc generally gets tighter when a mirror with a larger curvature range is under test.

An elliptical mirror becomes more “extreme” when its curvature varies in a larger range. The requirement on the pitch rotation center measurement becomes tight if the ellipse to test is very “extreme” as shown in Figure 9. The use the multi-pitch NSP technique to measure these kind of X-ray mirrors requires a precise auxiliary measurement of the pitch rotation center.

The vertical error of the pitch rotation center ezc introduces a systematic bias (or say a systematic error) on the reconstructed slope of the elliptical mirror under test from its true values. This systematic bias affects the fitting parameters (e.g., θ and xo) and the fitting residuals (on slope and height), as well as their uncertainties.

Let’s take a critical condition, M2 with ezc=0.237 mm (the red cross marker in Figure 9), as an example. In presence of a 70 nrad RMS angular noise, as shown in Figure 10B, we get 14.2 nrad RMS slope residuals and the corresponding height residuals are 0.36 nm RMS after optimizing θ and xo, though they only require a small adjustment. Since M2 should be characterized with a diffraction limited shape error below λ/(28θ)= 1.98 nm RMS, the 0.36 nm RMS bias added by an ezc=0.237 mm estimation error in the rotation center location, is barely acceptable.

FIGURE 10
www.frontiersin.org

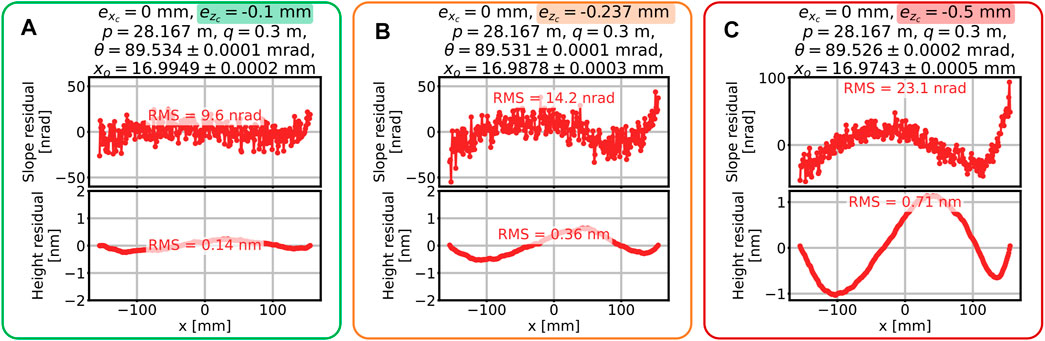
FIGURE 10. The slope and height residuals when measuring M2 with σna=70 nrad angular noise: (A) when ezc=0.1 mm, (B) under a critical condition of ezc=0.237 mm, and (C) when ezc=0.5 mm.

As shown in Figure 10A, the slope and height residuals are smaller when the center of rotation error is reduced to ezc=0.1 mm, and the best fit parameters θ and xo are closer to their nominal target values, compared to the critical condition  ezc=0.237 mm.

When ezc=0.5 mm as shown in Figure 10C, the height residuals increase to 0.71 nm RMS which is more than 1/3 of the diffraction limited allowed shape error. In this case, the characterization of M2 would be significantly biased because the systematic error due to ezc=0.5 mm is too large.

Framework to Determine the Measurement Tolerance of the Pitch Rotation Center

Before performing a multi-pitch NSP, it is required to ensure that the measurement of the pitch rotation center can meet the tolerance requirement. Therefore, we suggest a framework to determine the needed measurement accuracy of zc:

1) Set the RMS threshold of slope residuals from the best fit. This RMS threshold should be 1/10 of the RMS value of the desired slope errors in total. For example, if 100 nrad RMS total slope error is pursued based on the mirror specification, the RMS threshold of slope residuals should be set as 10 nrad.

2) Calculate the tolerance of the ezc according to the target ellipse parameters and the preset RMS threshold of slope residuals.

3) The RMS value σzc of the zc measurement should be 1/6 of the range of the ezc tolerance, if we take the ±3σzc as the full range of the ezc tolerance.

Within this framework, one can estimate if the selected metrology tool is adequate to measure zc for a particular elliptical mirror. Knowing the ellipse parameters and the uncertainty of the zc measurement device, step 2 can be realized by simulating the multi-pitch NSP measurement without introducing any angular noise.

Moreover, we can also carry out Monte Carlo simulations considering both uncertainties of the angular sensor and of the zc measurement device. As a result, it will give the uncertainties of the fit parameters, θ, xo and of the slope residuals as well.

Monte Carlo Simulation on M1

From what precedes we can infer that a correlation exists between the error committed on zc and the resulting errors in estimating the fit parameters. We use Monte Carlo simulations to study this correlation considering that the uncertainty of the two inputs, coming from the two separate metrology tools, are uncorrelated. The standard deviation of the additive angular noise σna is still set to 70 nrad, as previously.

M1 is selected as the test mirror in this Monte Carlo simulation. The average pitch steps are about 0.2 mrad, and 76 pitch angles are performed in the multi-pitch NSP simulation. As shown in Figures 8, 9, the tolerance of the ezc for M1 is about ± 2.2 mm if the RMS threshold of slope residuals is set at 10 nrad, so we will need a metrology technique to measure zc with an accuracy of σzc=2.2/30.7 mm. We simulated a sequence of 1,000 independent measurements of M1 mirror with the multi-pitch NSP technique, taking σzc=0.7 mm and σna=70 nrad for standard deviation of the two random inputs, as shown in Figure 11.

FIGURE 11
www.frontiersin.org

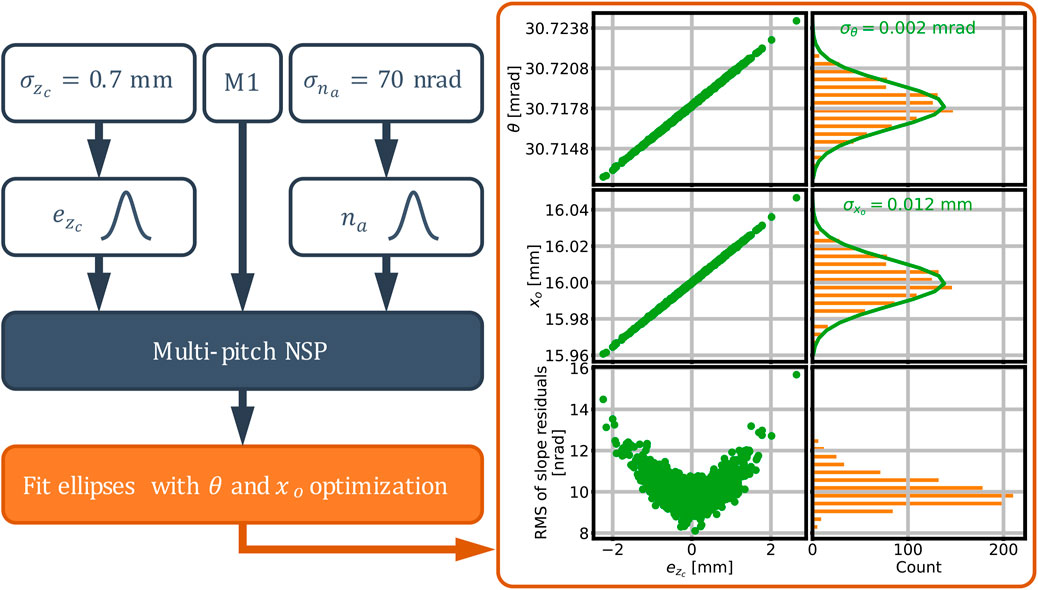
FIGURE 11. The Monte Carlo simulation of measuring M1 using the multi-pitch NSP with a pitch rotation center measurement error ezc with a standard deviation σzc=0.7 mm and a normally-distributed angular noise with σna=70 nrad gives the ellipse fitting results of the grazing angle θ in an uncertainty of ±3σθ=±6 µrad, the xo with an uncertainty of ±3σxo=±36 µm, and the RMS of the slope residuals from the best fit around 10±2 nrad RMS.

After the best fit of ellipse (optimization of θ and xo), as shown in the right panel of Figure 11, the Monte Carlo simulation can give the uncertainty of the measurement in θ and xo, and the slope residuals from the best fit as the result of the measurement and data analysis. Taking this simulation as an example, if we measure the vertical distance zc with σzc=0.7 mm and perform the angle acquisition for multi-pitch NSP with σna=70 nrad, the slope residuals will end up at 10 nrad RMS level (the RMS of slope residuals due to ezc is less than 10 nrad RMS threshold). The grazing angle is estimated with a ±3σθ uncertainty as θ^=30.7178±0.006 mrad and the chief ray location, with a ±3σxo uncertainty, as x^o=16±0.036 mm. The Monte Carlo simulation offers a better picture of what we are expecting to get from the multi-pitch NSP measurement of a specific test mirror with a particular measurement of the pitch rotation center.

Conclusion

To take the challenge of measuring extreme off-axis elliptical mirrors, we revisit the multi-pitch NSP technique from its basic theory to the reconstruction algorithm. The true abscissa xm of the measured position in the mirror coordinate system is needed in the reconstruction algorithm. This abscissa xm in the mirror coordinate system is derived as a function of recorded position in the instrumental word coordinate system, the mirror height profile zm and the measurement error on the pitch rotation center (xc, zc). We discuss the failure of the “flat assumption” (z^m=0) when measuring “extreme” ellipses and propose a solution with iterative reconstruction in multi-pitch NSP system.

The tolerance of the measurement of the pitch rotation center location (xc, zc) is studied with simulations on a series of ellipse parameters. We find out from both theoretical analysis and simulations that the tolerance of the xc measurement is large, and the requirement can easily be satisfied. When measuring “extreme” ellipses, the tolerance of the zc measurement is much tighter. We proposed a practical framework to determine the needed measurement accuracy of the zc measurement. For some extreme cases, the tolerance of the ezc is so small that the measurement of zc can be a challenge.

A Monte Carlo simulation on a real design of an “extreme” elliptical mirror shows that, with a known accuracy of the pitch rotation center measurement, we can estimate θ and xo with their uncertainties and get the slope residuals from the best fit. The RMS value of the slope residuals due to measurement error ezc is controlled by meeting the tolerance of the ezc.

This simulation study can guide the real multi-pitch NSP measurement for “extreme” elliptical mirrors. The tolerance of ezc can be calculated before the design of the measurement. A proper way to measure zc becomes the key to the “extreme” elliptical mirror characterization with the multi-pitch NSP technique.

Data Availability Statement

The original contributions presented in the study are included in the article/Supplementary Material, further inquiries can be directed to the corresponding author.

Author Contributions

LH and MI contributed to conception, methodology and funding acquisition. LH wrote the first draft of the manuscript. TW and KN contributed to the review of the manuscript. FP reviewed and modified the manuscript. JN contributed to the review of the revised version. MI supervised the research. All authors discussed the results, revised the manuscript, and approved the submitted version.

Funding

This work was supported by NSLS-II Facility Improvement Project (21153) and DOE Office of Science (DE-SC0012704).

Conflict of Interest

The authors declare that the research was conducted in the absence of any commercial or financial relationships that could be construed as a potential conflict of interest.

Publisher’s Note

All claims expressed in this article are solely those of the authors and do not necessarily represent those of their affiliated organizations, or those of the publisher, the editors and the reviewers. Any product that may be evaluated in this article, or claim that may be made by its manufacturer, is not guaranteed or endorsed by the publisher.

Acknowledgments

This research used resources of the National Synchrotron Light Source II, a U.S. Department of Energy (DOE) Office of Science User Facility, operated for the DOE Office of Science by Brookhaven National Laboratory under Contract No. DE-SC0012704.

References

1. Takacs PZ, Qian S-n., Colbert J. (1987). Design of A Long Trace Surface Profiler, Metrol Fig Finish, p. 59. Proc. SPIE 0749. doi:10.1117/12.939842

CrossRef Full Text | Google Scholar

2. Siewert F, Noll T, Schlegel T, Zeschke T, Lammert H. The Nanometer Optical Component Measuring Machine: A New Sub-nm Topography Measuring Device for X-ray Optics at BESSY. AIP Conf Proc (2004) 705:847–50. doi:10.1063/1.1757928

CrossRef Full Text | Google Scholar

3. Qian S, Jark W, Takacs PZ. The Penta‐prism LTP: A Long‐trace‐profiler with Stationary Optical Head and Moving Penta Prisma). Rev Scientific Instr (1995) 66:2562–9. doi:10.1063/1.1145658

CrossRef Full Text | Google Scholar

4. Ali Z, Yashchuk VV. Automated Suppression of Errors in LTP-II Slope Measurements of X-ray Optics .(2011) Part 2 : Specification for automated rotating/flipping/aligning system n.d.:1–8. Available at: https://www.osti.gov/servlets/purl/1170543. doi:10.2172/1170543

CrossRef Full Text | Google Scholar

5. Siewert F, Buchheim J, Zeschke T. Characterization and Calibration of 2nd Generation Slope Measuring Profiler. Nucl Instr Methods Phys Res Section A: Acc Spectrometers, Detectors Associated Equipment (2010) 616:119–27. doi:10.1016/j.nima.2009.12.033

CrossRef Full Text | Google Scholar

6. Nicolas J, Pedreira P, Šics I, Ramírez C, Campos J. Nanometer Accuracy with Continuous Scans at the ALBA-NOM. Adv Metrol X-ray EUV Opt VI (2016) 9962:996203. doi:10.1117/12.2238128

CrossRef Full Text | Google Scholar

7. Alcock SG, Sawhney KJS, Scott S, Pedersen U, Walton R, Siewert F, et al. The Diamond-NOM: A Non-contact Profiler Capable of Characterizing Optical Figure Error with Sub-nanometre Repeatability. Nucl Instr Methods Phys Res Section A: Acc Spectrometers, Detectors Associated Equipment (2010) 616:224–8. doi:10.1016/j.nima.2009.10.137

CrossRef Full Text | Google Scholar

8. Nicolas J, Martínez JC. Characterization of the Error Budget of Alba-NOM. Nucl Instr Methods Phys Res Section A: Acc Spectrometers, Detectors Associated Equipment (2013) 710:24–30. doi:10.1016/j.nima.2012.10.125

CrossRef Full Text | Google Scholar

9. Qian S, Idir M. Innovative Nano-Accuracy Surface Profiler for Sub-50 Nrad Rms Mirror Test. 8th Int Symp Adv Opt Manuf Test Technol Subnanom Accuracy Meas Synchrotron Opt X-ray Opt (2016) 9687:96870D. doi:10.1117/12.2247575

CrossRef Full Text | Google Scholar

10. Avila J, Boury A, Caja-Muñoz B, Chen C, Lorcy S, Asensio MC. Optimal Focusing System of the Fresnel Zone Plates at the Synchrotron SOLEIL NanoARPES Beamline. J Phys Conf Ser (2017) 849:012039. doi:10.1088/1742-6596/849/1/012039

CrossRef Full Text | Google Scholar

11. Polack F, Thomasset M, Brochet S, Rommeveaux A. An LTP Stitching Procedure with Compensation of Instrument Errors: Comparison of SOLEIL and ESRF Results on Strongly Curved Mirrors. Nucl Instr Methods Phys Res Section A: Acc Spectrometers, Detectors Associated Equipment (2010) 616:207–11. doi:10.1016/j.nima.2009.10.166

CrossRef Full Text | Google Scholar

12. Huang L, Wang T, Nicolas J, Polack F, Zuo C, Nakhoda K, et al. Multi-pitch Self-Calibration Measurement Using a Nano-Accuracy Surface Profiler for X-ray Mirror Metrology. Opt Express (2020) 28:23060. doi:10.1364/oe.392433

PubMed Abstract | CrossRef Full Text | Google Scholar

Keywords: x-ray mirror, mirror metrology, multi-pitch NSP, mirror inspection, tolerance study

Citation: Huang L, Wang T, Polack F, Nicolas J, Nakhoda K and Idir M (2022) Measurement Uncertainty of Highly Asymmetrically Curved Elliptical Mirrors Using Multi-Pitch Slope Stitching Technique. Front. Phys. 10:880772. doi: 10.3389/fphy.2022.880772

Received: 21 February 2022; Accepted: 20 April 2022;
Published: 11 May 2022.

Edited by:

Qiushi Huang, Tongji University, China

Reviewed by:

Shanyong Chen, National University of Defense Technology, China
Maurizio Vannoni, European X-Ray Free Electron Laser, Germany

Copyright © 2022 Huang, Wang, Polack, Nicolas, Nakhoda and Idir. This is an open-access article distributed under the terms of the Creative Commons Attribution License (CC BY). The use, distribution or reproduction in other forums is permitted, provided the original author(s) and the copyright owner(s) are credited and that the original publication in this journal is cited, in accordance with accepted academic practice. No use, distribution or reproduction is permitted which does not comply with these terms.

*Correspondence: Lei Huang, huanglei0114@gmail.com

Disclaimer: All claims expressed in this article are solely those of the authors and do not necessarily represent those of their affiliated organizations, or those of the publisher, the editors and the reviewers. Any product that may be evaluated in this article or claim that may be made by its manufacturer is not guaranteed or endorsed by the publisher.