 Marcus Powers1,2*†
 John Baines1†
- 1Townsville Cancer Centre, Townsville University Hospital, Townsville, QLD, Australia
- 2College of Science and Engineering, James Cook University, Townsville, QLD, Australia
The presence of the static field in magnetic resonance guided radiation therapy (MRgRT) systems, such as the Elekta Unity MR-Linac (MRL), influences charged particle motion due to the Lorentz force in and around patients. Consequently, for the Unity, changes to out-of-field dose (OFD) relative to conventional linacs occur due to the electron streaming effect (ESE) and spiraling contaminant electrons (SCE). This work investigates OFD associated with irradiation of the anterior MR imaging coil, which is in situ for all treatments on the Unity. Film measurements and Monaco simulations were performed to quantify the magnitude of OFD at the superior and inferior ends of the coil as a function of coil tilt relative to the beam direction. The dependence of OFD on field size and the relative electron density (RED) assigned to the coil and surrounding air are reported. The doses at both coil ends were clinically significant, with nearly 23.0% of the Dmax dose to water being recorded for the largest field (8.0 × 22.0 cm2) and 6.8% for the smallest field (3.0 × 3.0 cm2). Monaco simulations of OFD agreed with film within 5.0%, when appropriate calculation conditions were set. OFD decreases as coil tilt is reduced, and there is no evidence of ESE when the coil is horizontal. Clinically, the potential magnitude of cranio–caudal streaming dose from a tilted coil necessitates the use of appropriate shielding. A clinical case involving coil-induced ESE during treatment of a lesion in the right angle is presented. The planning-based investigation revealed that ESE doses associated with the coil and an immobilization vacuum bag can be clinically significant.
Introduction
In current clinical designs of magnetic resonance (MR) linacs, namely, the Elekta Unity (Elekta, Stockholm, Sweden) and ViewRay MRIdian (ViewRay, Oakwood Village, OH, United States) systems, the magnetic field is transverse to the treatment beam direction [1, 2]. This has specific implications for dose deposition within the patient as well as out-of-field patient exposure. For discussion of in-field dosimetry, the reader is referred to the work of other investigators [3–5]. The focus of this work is out-of-field dose (OFD) for the Unity MR-linac (MRL).
The Unity system integrates magnetic resonance imaging (MRI) functionality with a 7 MV FFF X-ray source, capable of bidirectional rotation around the static B0 field [6, 7]. To achieve this, the beam generating system is mounted on an annular gantry that is free to rotate around a modified Philips Ingenia 1.5 T MRI. The B0 field of the MRI is generated by a split-coil, superconducting magnet and the gantry rotation plane is between the coils. For all gantry positions, the in-line accelerator and X-ray source are radially aligned with the isocenter. X-rays emanating from the source pass through the helium-filled, aluminum cryostat of the magnet, avoiding the superconducting coils. The isocenter is 143.5 cm away from the source and 14.0 cm above the patient couch. A schematic of the Unity system is shown in Figure 1, courtesy of Elekta.
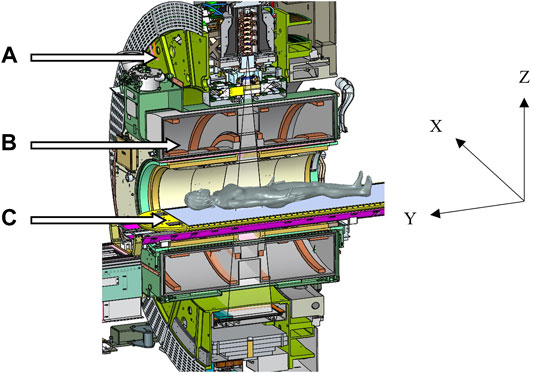
FIGURE 1. Schematic of the Elekta Unity MR-Linac, courtesy of Elekta, showing (A) the gantry ring, (B) the coil system embedded in the cryostat, and (C) the patient treatment couch. The IEC61217 coordinate system is shown, and the B0 field is in the –Y direction.
In the bore of the Unity, secondary electrons produced via Compton interactions within a patient, or in air, interact with the magnetic field via the Lorentz force. In a phantom study, it has been demonstrated that for X-ray beams orthogonal to planar tissue–air interfaces, secondary electrons enter the air and return to the tissue under the influence of the Lorentz force [8]. This is the so-called electron return effect (ERE) [8] and can lead to clinically significant increased skin dose [9]. In the case of beams incident on oblique tissue–air interfaces, secondary electrons entering the air have trajectories in the direction of B0 [10]. This is referred to as the electron streaming effect (ESE), and its effect on OFD in the cranio–caudal direction has been observed clinically [11, 12]. In addition, Lorentz interactions cause contaminant electrons in the primary X-ray beam to spiral along the direction of B0. Spiraling contaminant electrons (SCE) also contribute to OFD in the cranio–caudal direction [13, 14].
In magnetic resonance guided radiation therapy (MRgRT), daily imaging is utilized to identify changes in tumor shape and position. Subsequent adaptive planning is performed to optimize patient treatment for each fraction [15]. To facilitate imaging of the tumor site, an MR receiver coil is positioned anteriorly above the requisite patient anatomy. A previous work has suggested that irradiation of the tilted anterior coil induces clinically significant OFD [14]; however, a thorough characterization of this phenomenon is lacking. In this work, we report on ESE originating from irradiation of this anterior imaging coil. Measured ESE is compared to calculations using the Elekta Unity treatment planning system (TPS). In addition, a clinical case of ESE from the coil is discussed. The strategies to mitigate OFD to patient surfaces in the cranio–caudal path of streaming electrons are also briefly presented.
Methods and Materials
Measurements
ESE was investigated with the coil at 7.0°, 3.5°, and 0.0° to the horizontal, with 15.0 × 15.0 cm2 EBT3 films (Ashland ISP Advanced Materials, NJ, United States) positioned below (superiorly) and above (inferiorly) the coil (Figure 2). A dummy film (0.27 mm water equivalent thickness) was attached to the measurement film (0.13 mm to active layer) to achieve an effective measurement depth of 0.4 mm. With the gantry at 0.0° (G0), the coil was centered on the beam axis. The film was marked to indicate orientation with respect to the beam central axis.
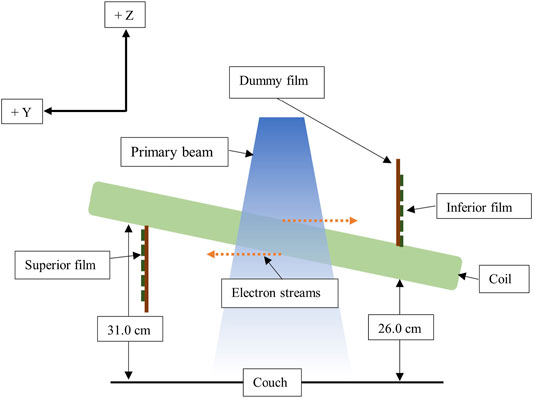
FIGURE 2. Schematic showing the film setup for coil ESE measurements, not to scale. The IEC61217-positive Y and Z axes are shown.
For a 7.0° tilt, the film exposure was investigated for 500 MU, G0, beams with field sizes of 8.0 × 22.0 cm2 (IECX, IECY), 5.0 × 22.0 cm2, 5.0 × 5.0 cm2, 5.0 × 3.0 cm2, and 3.0 × 3.0 cm2. Larger field sizes (Y = 22.0 cm) were representative of head and neck fields, while smaller fields were indicative of prostate treatments. To investigate the impact of coil elevation on ESE, additional film exposures were obtained for a 500 MU, 5.0 × 22.0 cm2 G0 field, with coil tilts of 3.5° and 0.0°. For each inclination, the superior end of the coil was 31.0 cm above the patient positioning system.
Film calibration was performed using 4.0 × 2.0 cm2 film strips at 5.0 cm depth in solid water, SSD = 138.5 cm, with a 10.0 × 10.0 cm2 field and exposures of 0, 60, 125, 250, and 500 MU. Films were scanned using an Epson 12000XL Expression (Epson, Seiko Corporation, Japan), with corrections applied to account for the lateral response artifact [16]. Images were analyzed using FilmQA™ Pro software (Ashland ISP Advanced Materials, NJ, United States) and triple channel analysis [17]. For each field size, dose profiles were derived in the ± Z directions (vertical), parallel to the beam central axis. Horizontal profiles were obtained for the 8.0 × 22 cm2 field through the center of peak dose as indicated from the vertical profiles. The doses were normalized to the nominal maximum dose-to-water (Dmax) for a 10.0 × 10.0 cm2 G0 field, 500 MU, at 5.0 cm depth (SSD = 138.5 cm).
Simulations
The Monaco v5.40 TPS (Elekta, Stockholm, Sweden) was used for all simulations in this work. Within this version, a GPU-based Monte Carlo dose engine (GPUMCD) is used for rapid calculations in voxelized geometries [18, 19]. The effect of the static 1.5 T magnetic field is simulated during particle transport and dose deposition calculations [18, 19]. For CT planning, relative electron densities (REDs) of voxels are typically assigned based on a scanner-specific, CT-to-RED conversion. For MR planning, REDs of structures are typically assigned or “forced” to user-specified values. REDs are mapped to chemical composition using patient, phantom, or couch material lookup tables. The calculation accuracy is controlled through statistical uncertainty and dose grid resolution settings. Further information on the TPS can be found elsewhere [18–20].
For simulations of coil ESE and for all investigated field sizes, a CT dataset of air was imported into Monaco. The default Elekta coil model (RED = 0.089) was positioned at 7.0° to the horizontal, and each experimental beam was added. Scoring planes (RED = 1.000) 30.0 × 30.0 × 0.1 cm3 were added, corresponding to film positions. The air around the coil was contoured, and simulations of ESE were performed with the air RED either 1) unforced or 2) forced to 0.010. These options were selected since 1) for CT-based planning, the minimum RED depends on the CT-to-RED conversion, and 2) the minimum forced RED for a structure is 0.010, which would be common practice to simulate internal air structures in Monaco with MR-based planning. ESE dose profiles were derived from simulated transverse dose planes, centered within the scoring regions (0.5 mm depth), using Verisoft™ v7.2 (PTW, Freiburg, Germany). For the 8.0 × 22.0 cm2 field, forced RED simulated doses were extracted for the superior and inferior ends of the coil; however, for the remaining fields, only dose profiles from the superior end were determined. Vertical profiles, through the unforced RED simulated doses, were extracted for all fields and both ends of the coil. Horizontal profiles were determined for the 8.0 × 22.0 cm2 field only, again through the center of the peak dose distribution.
To investigate the effect of reduced coil tilt, simulated ESE profiles (air RED unforced) at both ends of the coil were determined with a 3.5° tilt for the 5.0 × 22.0 cm2 field, 500 MU. Finally, with the coil horizontal, simulated OFD doses at the coil ends were determined for the same field. For both simulations, the default coil model was used.
In the TPS, the default coil model is a homogenous structure assigned with a generic, vendor defined RED. Clinically, this structure is required to be present above the patient for dose calculations. The true coil structure contains a high-density substrate in which the RF receiving coil is embedded, surrounded by a lower density foam (Figure 3). Hence, modeling this as a uniform RED may be erroneous. To test this, a CT was acquired of the anterior coil with 1.0 mm slices, and the dataset was transferred to Monaco. For the CT acquisition, the coil was in the same position as it was for the 7.0° coil tilt measurements. The coil and air around the coil (RED unforced) were contoured separately. Scoring planes were assigned as described previously. Simulations of superior and inferior ESE for the 8.0 × 22.0 cm2 were performed with the coil RED: 1) forced to 1.000 (water), 2) forced to the mean value determined by Monaco for the structure (RED = 0.075), and 3) unforced. Vertical and horizontal dose profiles were determined through each dose distribution as described previously.
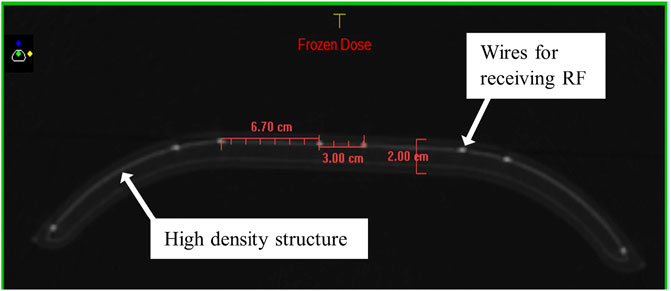
FIGURE 3. Internal structure of the coil as from a CT of the device, showing the high-density substructure housing the RF receiver wires and providing structural support. Distances between the wires and the coil thickness are shown in red.
All simulations utilized a 0.1 cm dose grid and 0.2% statistical uncertainty per control point. Dose deposition was determined to the local medium, and with these settings, the calculation statistical uncertainty was <1.0% within the dose planes. Inclusion of the Monaco anterior coil model required selection of the patient lookup table. For all simulations, doses were normalized similarly to the film and compared to measurements using difference plots. Note that with a 0.1 cm calculation grid, there was an offset of 0.1 mm between measurement and simulation depths.
Clinical Case
During treatments, multiple streams from the coil could be expected. The Monaco TPS was used to investigate ESE associated with the tilted coil for a patient case. A 30.0 Gy in three fractions step-and-shoot intensity modulated radiation therapy plan was generated on the reference CT dataset to treat a lesion in the patient’s right ankle. The orientation of the patient’s feet required the anterior coil to be tilted approximately 13.0° to improve the MR signal, with the superior end (+Y) higher than the inferior (−Y). A vacuum immobilization device was used during treatment to reduce patient (foot) motion. In addition, 2.0 cm of jelly bolus shielding was provided at either end of the coil to protect the patient from streaming electrons. The patient was positioned feet first supine (FFS); FFS orientation would mean that the “superior” direction would point oppositely to the direction used in non-clinical investigations. To keep a consistent coordinate system and to aid with labelling the reference to “inferior” and “superior” was not changed when referencing the clinical case.
To visualize and accurately quantify electron streaming doses, the air around the coil was contoured and assigned an unforced RED. The structure was expanded to include the patient volume and assigned as the external contour. This was necessary as Monaco will not display dose to regions outside the external contour unless such structures have forced REDs. The plan was calculated using a 0.2 cm dose grid, 3.0% statistical uncertainty per control point according to the clinical workflow, with the patient lookup table and dose deposition to the local medium.
Results
Measurements
The measured vertical profiles at the superior and inferior ends of the coil with a 7.0° tilt are shown in Figures 4A–E. The profiles at the superior and inferior ends are along the –Z and + Z directions, respectively. All profiles exhibit a peak dose region and an approximately constant dose “tail” region, the onset of which depends on the Y dimension of the field. For a given field size, the profile peak doses at either end of the coil are comparable and are dependent on the Y dimension of the field. In the tail region, the measured dose at the inferior end of the coil is greater than that at the superior end.
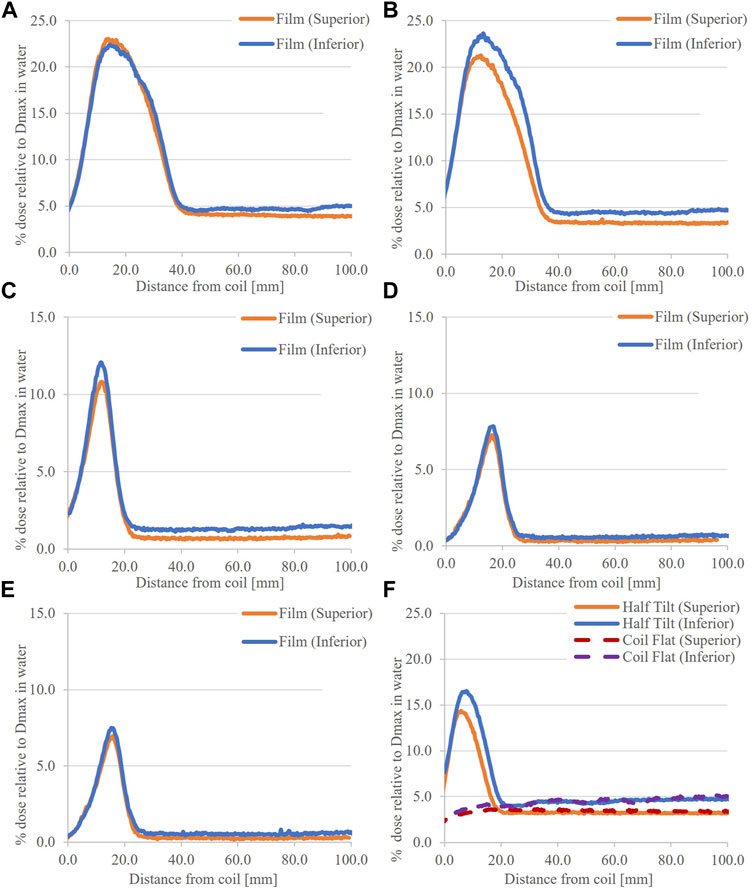
FIGURE 4. Vertical profiles through measured ESE doses, coil tilted 7.0°, for the (A) 8.0 × 22.0 cm2, (B) 5.0 × 22.0 cm2, (C) 5.0 × 5.0 cm2, (D) 5.0 × 3.0 cm2, and (E) 3.0 × 3.0 cm2 fields. In (F) doses for the coil tilted 3.5° and the coil flat, using 5.0 × 22.0 cm2 field, are provided.
With the coil at 3.5° and 0.0°, vertical profiles are shown in Figure 4F. For 3.5°, the width and magnitude of the peak region at either coil end are significantly less than those for corresponding 7.0° tilt profiles. At 0.0°, there is no peak and the dose is consistent with the tail sections of the tilted coil positions. Finally, horizontal profiles for the 8.0 × 22.0 cm2 field are comparable at both ends of the coil (Figures 5A,B).
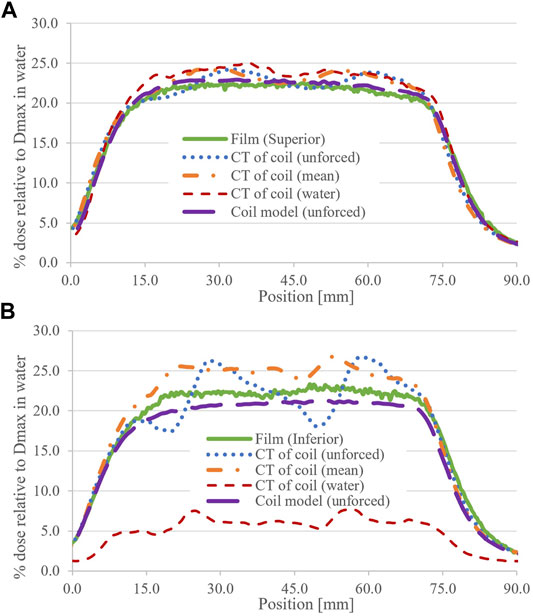
FIGURE 5. Measured and calculated horizontal profiles for the 8.0 × 22.0 cm2 field for (A) superior and (B) inferior coil ends. The RED status of the coil structure (CT dataset) and the air (coil model) is shown in parentheses.
Simulations
For ease of comparison, simulated and corresponding measured profiles are presented together. Figure 6 shows dose profiles and differences (simulated–measured) for the 8.0 × 22.0 cm2 field, air RED forced and unforced and at both ends of the coil. With air RED unforced (coil model), simulated and measured profile differences <3.8% of Dmax are observed in the peak region, and negligible differences are evident in the tail region. With air RED forced, simulated ESE peak doses at the coil ends are underestimated by −4.7% and −7.7% of Dmax superiorly and inferiorly, respectively. However, in the tail region, OFD is overestimated by 8.6% and 7.6% of Dmax superiorly and inferiorly, respectively. Due to this observation, forced RED simulated profiles at the inferior end of the coil are omitted from the profile comparisons for field sizes other than 8.0 × 22.0 cm2.
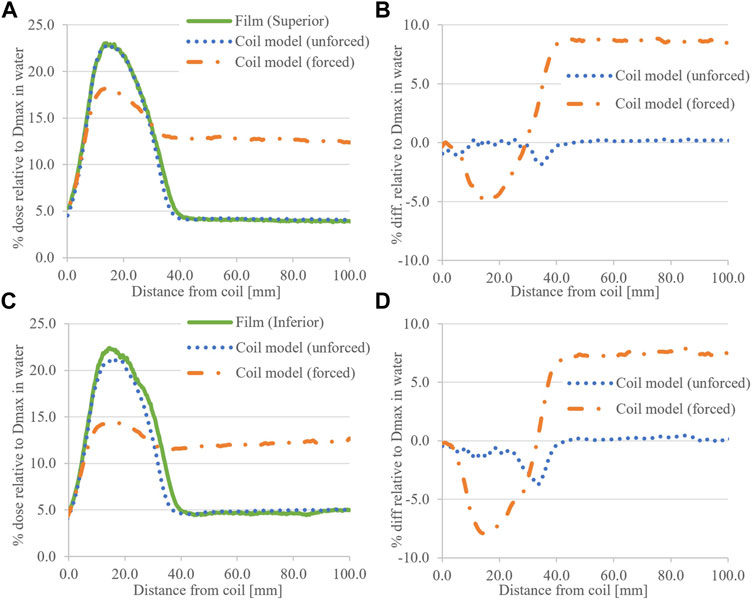
FIGURE 6. Calculated ESE dose for the 8.0 × 22.0 cm2 field with the coil model compared to film data. (A) shows the superior (+Y) data with (B) associated difference plots. Similarly for (C) inferior (−Y) and (D) associated difference plots. The RED status for the air around the coil is provided in parentheses.
Figure 7 shows profile comparisons for the small fields investigated (5.0 × 5.0 cm2 and below). In general, forced air RED reduces peak dose and increases tail dose. The differences between simulated and measured peak doses are within the range −2.5%–2.5% Dmax, and in tail regions, differences <0.4% are observed.
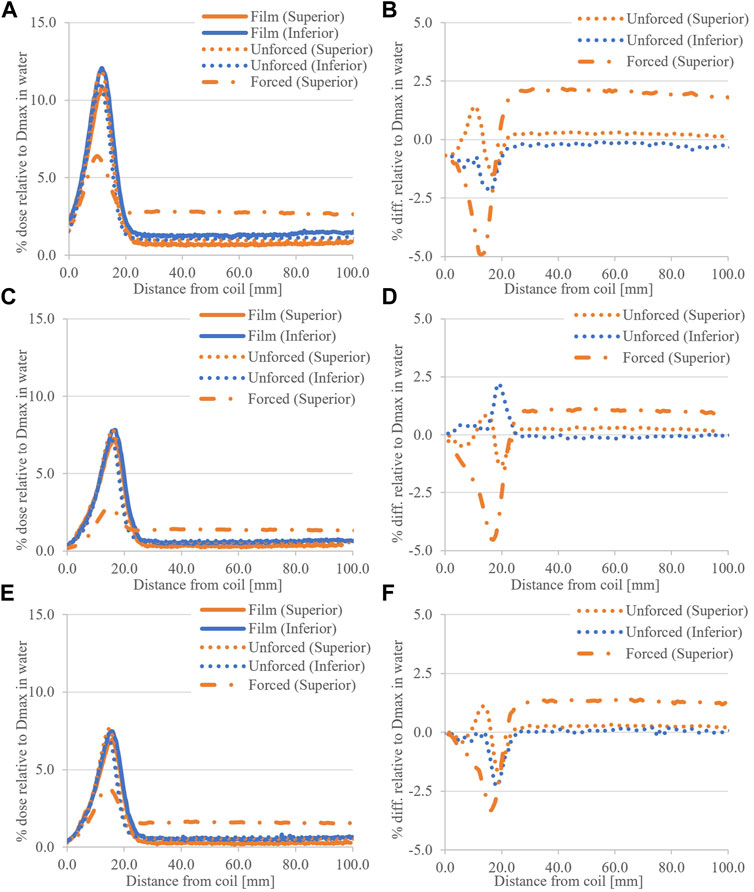
FIGURE 7. Small field coil ESE doses, calculated and measured, for (A) the 5.0 × 5.0 cm2 field with (B) associated difference plot. (C) shows the 5.0 × 3.0 cm2 results and (D) associated differences, and similarly with (E) the 3.0 × 3.0 cm2 results and (F) difference plots.
Figures 8A–E shows comparisons of 5.0 × 22.0 cm2 profiles. At both ends of the coil, 7.0° tilt, there is agreement between simulated and measured profiles with unforced air RED. The differences are in the range −4.8%–1.6% of Dmax for the peak regions, and <0.6% in tail regions. With the coil tilt reduced to 3.5°, the width and magnitude of the peak region are reduced relative to the 7.0° tilt data. The dose differences were in the range of −3.2%–3.4% of Dmax. As with measurements, simulations with the coil horizontal do not show a peak region in OFD. Furthermore, the calculated dose here is consistent with tail regions from the same field size, independent of coil tilt (Figure 4F and Figure 8).
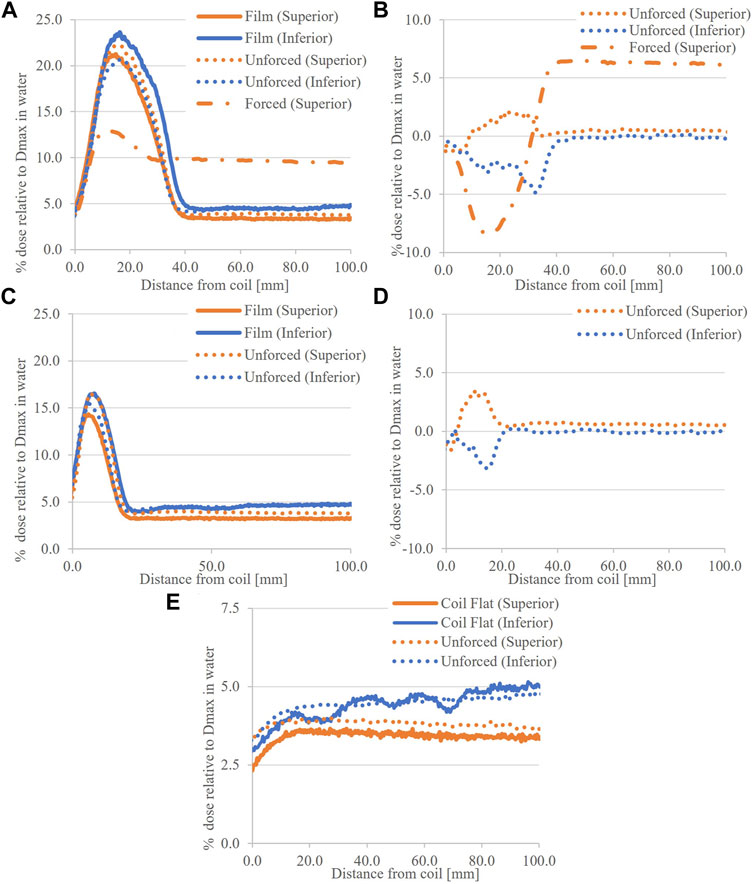
FIGURE 8. Calculated and measured ESE dose for the 5.0 × 22.0 cm2 field with the Elekta coil model. (A) shows the 7.0° tilt data, with (B) associated differences, and in (C), the 3.5° tilt data and (D) differences. In (E), the coil flat data is given with differences omitted given the consistency of measured data with tail regions from the tilted cases.
The simulated ESE doses, for the 8.0 × 22.0 cm2 field, with the CT of the coil are presented in Figures 9A–D. With the coil RED set to 1.000 (water), absolute differences to films greater than 5.0% of the Dmax dose were observed in the superior peak. Significant differences are apparent in the inferior dose, and hence are omitted from the difference plot (Figure 9D). Simulations with the coil RED forced to its mean value and unforced show improved differences to the film.
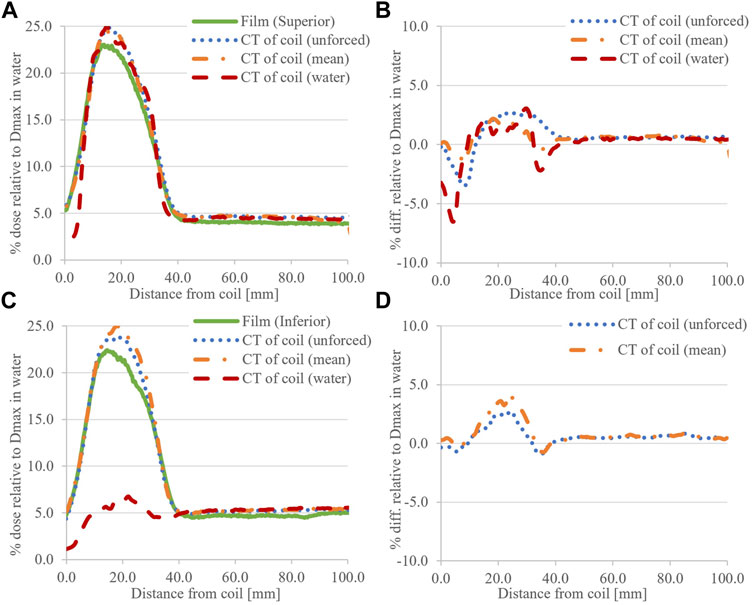
FIGURE 9. Calculated ESE dose for the 8.0 × 22.0 cm2 field with a CT of the coil, compared to film data. (A) shows the superior (+Y) data with (B) associated difference plots. Similarly for (C) inferior (−Y) and (D) associated difference plots. The RED status of the coil is provided in parentheses, and the omission of the inferior differences was noted when this was set to 1.000 (water) due to its obvious mismatch with measurements.
In calculated horizontal profiles for the 8.0 × 22.0 cm2 field (Figure 5), distinct deviations from profile flatness are observed when using a CT of the coil. This was most pronounced for unforced RED calculations with the coil CT dataset at the inferior end of the coil. When using the default coil model, horizontal profiles are in better agreement with measurements; however, an approximate 1.5% (of Dmax) dose offset can be observed consistently across the inferior profiles (Figure 5B).
Clinical Case
Images of the TPS determined streaming doses, for the investigated patient case, are shown in Figure 10. Figure 10A shows that streaming doses as high as 8.3% of the prescription dose (30.0 Gy) can be present during irradiation of the coil. Note that these originated from a single beam. This stream came within 2.0 cm of the patient contralateral foot as positioned at simulation (Figure 10B). Interestingly, dose as high as 13.3% of the prescription dose was observed originating from the vacuum immobilization bag (Figure 10C).
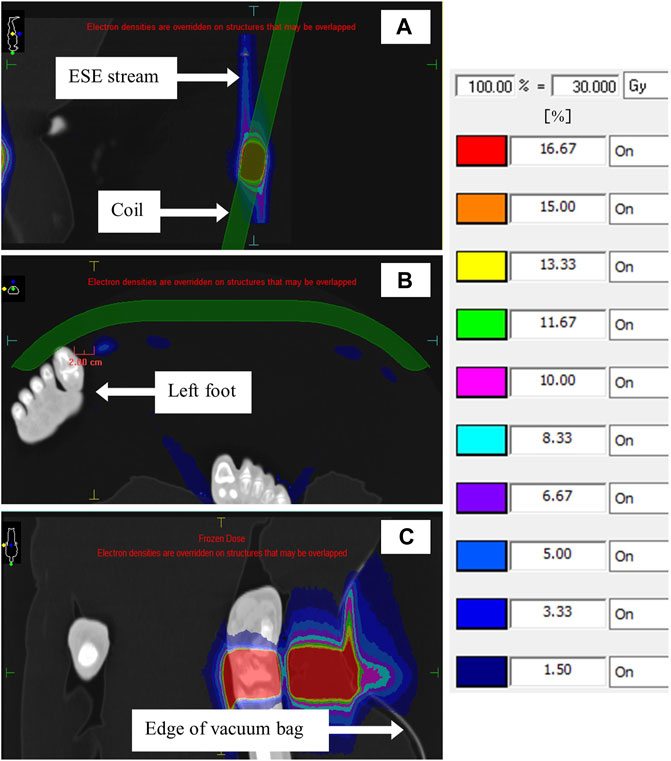
FIGURE 10. TPS images showing ESE doses for the patient case. The sagittal image in (A) shows ESE streams above and below the coil, and the transverse image in (B) shows the proximity of one such stream to the patient’s left foot. In (C), a coronal slice through the patient’s right ankle shows ESE emanating from the vacuum immobilization bag. Note the patient orientation icon in the top left.
Discussion
Measurements
From Figures 4, 5, the magnitude of the ESE dose from the coil was significant at both ends. Nearly 23.0% of the Dmax dose to water was observed for the 8.0 × 22.0 cm2 field (Figure 4A). This is comparable to doses reported previously for irradiation of water phantoms [10]; however, they are dependent on the field size and coil tilt. It appears that ESE dose superiorly is comparable to the inferior end, which contrasts with previous investigations where the ESE dose from beam exit through phantoms was greater than that from beam entry [10, 20]. This may be due to the internal structure of the coil (Figure 3), where high density layers would attenuate forward scatter electrons and increase backscattered electrons. The magnitude of coil ESE dose and the comparable readings at either end of the coil will require shielding at both locations to protect patients. Of course, if the coil is horizontal, the ESE dose would be minimized (Figure 4F and Figure 8E) [14]. This may not be possible in all scenarios, particularly when the patient geometry does not allow for it and MR image quality would be significantly impacted. For this, increased distance of the receiver coil from the RF signal origin (patient) can deteriorate signal-to-noise.
A field size effect was observed in film measurements, where smaller fields produced less ESE dose in agreement with previous phantom works [10, 20]. Decreasing the field size limits the number of secondary electrons produced and reduces the coil length (and therefore total volume), which is irradiated in-line with B0. The latter appears to be a greater effect as comparable peak doses were observed for fields with similar Y dimension and coil tilt, which were not observed for fields with similar X dimension (Figure 4).
The measurements with the coil tilt halved (Figure 4F) show that the peak dose is reduced approximately 7.0% compared to the 7.0° tilt. When the tilt was removed, the recorded OFD was comparable to that previously reported for SCE and background photons [13, 14]. This was expected given previous works highlighting the effect of surface angulation on the ESE dose [10, 12]. Note that several effects contribute here. For reducing tilt, the distance which an electron must travel along B0 (±Y) to be able to rotate, and not return to the surface, is increased. Hence, electrons which stream represent those which have large parallel components of motion. Second, as the tilt is reduced, the distance from a given generation point to the coil edge is increased. Thus, one may expect more electrons escaping for larger coil inclinations. These are shown schematically in Figure 11. Finally, increasing the coil tilt increases the volume, which is irradiated as a function of the cosine of the angle, enabling more electron streams to be produced. The minimum coil tilt necessary to observe ESE was not determined here; hence, further work with Monte Carlo is warranted.
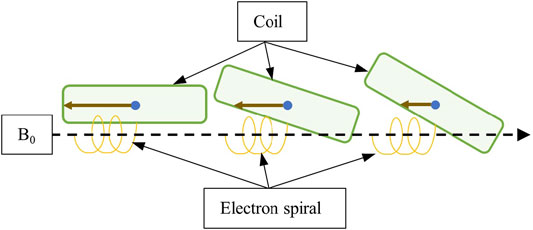
FIGURE 11. Diagram showing how the coil tilt can affect the electron streaming. Larger tilts (middle and right) create increased distance between the electron spiral and coil surface, meaning the lateral distance the electron must travel to escape and not return to the surface is reduced. Larger tilts also decrease the lateral distances electrons must travel to escape from inside the coil (brown solid arrow) after initial generation.
For all field sizes, the tail regions in vertical profiles show equivalent doses to previous results for OFD from SCE and background photons [13, 14] with equivalent field sizes. In this region, the inferior dose shows a subtle increase with distance from the coil (moving + Z). The opposite is seen at the superior end. This is due to primary beam reduction through the inverse square law, resulting in fewer electron streams per area of the irradiated air. The attenuation of the coil will also subtly contribute to the difference observed between superior and inferior tail dose regions. The measurements at the inferior end with the coil flat (Figure 4F) show some irregularity in profile shape, which was not observed in measurements at the superior end. These were attributed to backscatter from the coil external support/positioning structure (at the ends of the device), which does not contribute for the film dose at the superior end.
The horizontal measured profiles in Figure 5 appear as expected, except for a subtle step in the inferior plot. The cause of the step has yet to be identified; however, the film setup and coil internal structure are being investigated.
Simulations
Figures 6–8 showed that comparatively good agreement was obtained between ESE calculations with the Elekta supplied coil model and film data for unforced air RED. The dose differences were less than ±5.0% of Dmax, occurring primarily around steep dose gradients, and were less varied than differences associated with a CT of the coil (Figure 9). The TPS calculated a slightly larger superior ESE dose than that of inferior, opposite to film measurements. This may be because the coil structure is homogenous for these simulations, which is not the case for measurements. Note that agreement to film data in calculated tail regions, superior and inferior, suggests data handling is not an issue.
The aforementioned agreement between measurements and simulations of ESE from the coil contrasts with previous publications [14]. When the air RED is forced to 0.010 as with the previous work [14, 20], greater differences between simulated and measured results were observed. In regions of the ESE dose (peaks), forcing the air RED lowered calculated doses (Figures 6–8). The opposite was observed in regions of SCE and background photons (tails). Higher air RED (forced to 0.010) means that the attenuation of the electron stream is increased as it travels from the coil to the scoring plane; hence, lower doses are calculated in profile peaks. In addition, increased RED means that more contaminant electrons will be produced in the air. The interplay of increased Compton interactions and electron attenuation results in an increase of SCE in the scoring plane. Hence, when calculating on MR datasets with forced RED for air, one could expect ESE doses to be underestimated and the opposite for SCE doses. It is uncommon for the air around the patient to be contoured and ultimately assigned a forced RED, although this may be performed to visualize electron streams [14]. Therefore, these discrepancies are of concern primarily for internal air structures. Strategies to mitigate these modeling errors, and further effects on OFD, are discussed elsewhere [20]; briefly, however, unforced RED for air contours should be considered when possible.
Reducing the tilt in simulations with the coil model (Figure 8) showed a dose reduction as observed for the film; however, it was less significant. Relative to the 7.0° tilt, the 3.5° doses were reduced by 5.6% and 5.2% of the Dmax dose for superior and inferior planes, respectively. The setup consistency between measurement and TPS will contribute to this. Note that no irregularities in the inferior dose for the simulated coil flat profiles are present as the TPS does not model the external supporting structure at the ends. Regardless, the magnitude of simulated ESE is consistent with measurements at this end. The difference between the two datasets at the superior end can be attributed to a mismatch in film and scoring plane locations (Figure 8E).
The differences between peak doses simulated with the CT of the coil and measured with the film (Figure 9) are within ±5.0% of Dmax. For calculations with the coil RED unforced or set to its mean value, regions of steep dose gradients agreed with the film. With the coil RED set to 1.000, calculated inferior peak doses are less than the superior peak dose, consistent with the published work [10]. Raising the RED increases the number of Compton interactions occurring within the coil. Consequently, an increase in Compton electrons, and hence electrons backscattered to the surface, is expected. However, it appears that due to the higher RED, the attenuation of these electrons results in reduced ESE relative to that exiting from the posterior surface of the coil.
Superiorly, the peak dose with the coil RED of 1.000 is comparable to that with lower RED. It appears that the interplay of attenuation and Compton electron production as functions of RED is in part responsible to the observed magnitude of the peak dose. A Monte Carlo investigation could be used to investigate the magnitude of superior and inferior coil ESE dose as a function of coil RED; however, this is beyond the scope of this work.
Furthermore, the superior peak dose with an RED of 1.000 is constricted relative to other data. The dose for the slopes around the peak is correlated with electrons escaping at the beam ± Y peripheries. It is reasonable to suggest that these electrons are more laterally scattered than those at the center. In Compton interactions, laterally scattered electrons have lower kinetic energy, and with higher RED materials (more attenuating), these electrons may not have the energy to escape and stream (Figure 12). Hence, a constriction in the peak width in the dose profile would be observed.
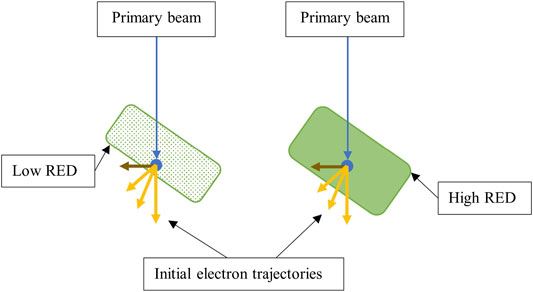
FIGURE 12. Diagram showing how increasing the coil RED can change resulting ESE doses. One can observe that higher RED materials have increased water equivalent thickness. Hence, laterally scattered electrons (brown) are not energetic enough to escape. Note that the effect of the magnetic field on electron paths and the full electron distribution are not shown.
Horizontal profiles, calculated with the default coil model, show good agreement to film data in terms of profile shape. The consistent difference to film, at the inferior end, may be due to setup uncertainties for measurements. Calculations using a CT of the coil show discontinuities, which are most pronounced at the inferior end. The location of these in the profiles is correlated with the location of the RF wires, within the coil, upstream. Clearly, using a CT of the coil to simulate ESE doses introduces uncertainties which are not present during measurements; however, this process is outside routine clinical practice and may not be of concern for users. Ultimately, independent Monte Carlo techniques may be required to address concerns with modeling coil ESE with a uniform RED in the TPS, when the true structure is heterogeneous.
Clinical Case
For the clinical case investigated, electron streaming from the coil can be observed for inferior and superior directions (Figure 10). These doses are comparable for a given beam, consistent with the aforementioned phantom investigation. The use of multiple beams clearly causes the resulting streams to be dispersed across the coil, which needs to be considered when applying shielding. However, the dose magnitude of each stream is reduced with the addition of more projections. Due to the height and angulation of the coil, electron streams in the −Y direction would have been incident on the patient, had the appropriate shielding not been present.
The magnitude of ESE dose originating from the vacuum bag was significant; however, it did not pose a danger to the patient. The potential for ESE from the vacuum bag is yet to be discussed and warrants further investigation. In vivo measurements would be of benefit. Mitigating ESE from the device would be a challenge, given its purpose and design. Hence, the geometry of the patient, vacuum bag, and planned beams should be scrutinized if using the device. A more in-depth investigation of this case and the aforementioned nonclinical studies is provided elsewhere, with the inclusion of patient-induced ESE doses [20].
Conclusion
In this work, out-of-field dose associated with the tilted anterior coil was characterized with film measurements and Monaco TPS calculations. Several fields were delivered to a tilted anterior coil, and ESE was measured at the inferior and superior ends of the device. The experimental arrangement was modeled in Monaco using different models for the coil. The effect of varying coil and air RED, as well as coil angulation, on resulting ESE doses was determined. A patient case was briefly discussed to highlight the ESE dose from the coil in a clinical scenario.
ESE doses from the tilted coil were clinically significant for all field sizes investigated. Approximately 23.0% of the Dmax dose to water was observed with film and simulations for an 8.0 × 22.0 cm2 field. Streaming doses at both coil ends were clinically significant, and this has implications for patient shielding; however, the effect can be reduced by removing the coil tilt. Smaller fields produced less ESE dose, and the effect of reducing the Y field dimension (in line with B0) is more pronounced than reducing the X dimension. The angulation of the coil also affected the ESE dose, with smaller tilts resulting in lower measured and calculated doses. Overall, simulations with the Elekta supplied coil model and unforced air RED resulted in doses consistent with measurements. Due to discrepancies between simulated and measured OFD with forced air RED, it is recommended that unforced air RED should be used for simulations. This would not be possible in the typical MR-only Unity treatment workflow. Calculations with the CT of the coil showed larger differences with measurements compared to simulations using the coil model; however, use of the coil CT dataset is outside routine clinical practice. The patient case showed that ESE doses from the coil and vacuum bag can be significant. Further work, with Monte Carlo and in vivo measurements, is warranted to address the areas discussed previously.
Data Availability Statement
The raw data supporting the conclusion of this article will be made available by the authors, without undue reservation.
Ethics Statement
Written informed consent was obtained from the individual(s) for the publication of any potentially identifiable images or data included in this article.
Author Contributions
MP and JB contributed to the conception and design of the study. MP and JB performed the data collection and analysis. MP and JB wrote this manuscript, and both authors approved the final version.
Conflict of Interest
The authors declare that the research was conducted in the absence of any commercial or financial relationships that could be construed as a potential conflict of interest.
Publisher’s Note
All claims expressed in this article are solely those of the authors and do not necessarily represent those of their affiliated organizations, or those of the publisher, the editors, and the reviewers. Any product that may be evaluated in this article, or claim that may be made by its manufacturer, is not guaranteed or endorsed by the publisher.
Acknowledgments
These authors wish to acknowledge that this article contains content that has been presented in MP thesis at the College of Science and Engineering, James Cook University, Townsville.
References
1. Raaymakers BW, Lagendijk JJW, van der Heide UA, Overweg J, Brown K, Topolnjak R, et al. Integrating a MRI Scanner with a Radiotherapy Accelerator: a New Concept of Precise on Line Radiotherapy Guidance and Treatment Monitoring. In: 14th International Conference on the use of Computers in Radiation Therapy; Seoul, South Korea, January, 2004 (2004). p. 89–92.
2. Mutic S, Dempsey JF. The ViewRay System: Magnetic Resonance-Guided and Controlled Radiotherapy. Semin Radiat Oncol (2014) 24:196–9. doi:10.1016/j.semradonc.2014.02.008
3. van Asselen B, Woodings SJ, Hackett SL, van Soest TL, Kok JGM, Raaymakers BW, et al. A Formalism for Reference Dosimetry in Photon Beams in the Presence of a Magnetic Field. Phys Med Biol (2018) 63:125008. doi:10.1088/1361-6560/aac70e
4. O'Brien DJ, Roberts DA, Ibbott GS, Sawakuchi GO. Reference Dosimetry in Magnetic fields: Formalism and Ionization Chamber Correction Factors. Med Phys (2016) 43:4915–27. doi:10.1118/1.4959785
5. O'Brien DJ, Dolan J, Pencea S, Schupp N, Sawakuchi GO. Relative Dosimetry with an MR-Linac: Response of Ion chambers, diamond, and Diode Detectors for off-axis, Depth Dose, and Output Factor Measurements. Med Phys (2018) 45:884–97. doi:10.1002/mp.12699
6. Raaymakers BW, Lagendijk JJW, Overweg J, Kok JGM, Raaijmakers AJE, Kerkhof EM, et al. Integrating a 1.5 T MRI Scanner with a 6 MV Accelerator: Proof of Concept. Phys Med Biol (2009) 54:N229–N237. doi:10.1088/0031-9155/54/12/N01
7. Woodings SJ, Vries JHW, Kok JMG, Hackett SL, Asselen B, Bluemink JJ, et al. Acceptance Procedure for the Linear Accelerator Component of the 1.5 T MRI‐linac. J Appl Clin Med Phys (2021) 22:45–59. doi:10.1002/acm2.13068
8. Raaijmakers AJE, Raaymakers BW, Lagendijk JJW. Integrating a MRI Scanner with a 6 MV Radiotherapy Accelerator: Dose Increase at Tissue-Air Interfaces in a Lateral Magnetic Field Due to Returning Electrons. Phys Med Biol (2005) 50:1363–76. doi:10.1088/0031-9155/50/7/002
9. Godoy Scripes P, Subashi E, Burleson S, Liang J, Romesser P, Crane C, et al. Impact of Varying Air Cavity on Planning Dosimetry for Rectum Patients Treated on a 1.5 T Hybrid MR‐linac System. J Appl Clin Med Phys (2020) 21:144–52. doi:10.1002/acm2.12903
10. Malkov VN, Hackett SL, Wolthaus JWH, Raaymakers BW, van Asselen B. Monte Carlo Simulations of Out-Of-Field Surface Doses Due to the Electron Streaming Effect in Orthogonal Magnetic fields. Phys Med Biol (2019) 64:115029. doi:10.1088/1361-6560/ab0aa0
11. Park JM, Shin KH, Kim J-i., Park S-Y, Jeon SH, Choi N, et al. Air-electron Stream Interactions during Magnetic Resonance IGRT. Strahlenther Onkol (2018) 194:50–9. doi:10.1007/s00066-017-1212-z
12. Liu H, Ding S, Wang B, Li Y, Sun Y, Huang X. In-Air Electron Streaming Effect for Esophageal Cancer Radiotherapy with a 1.5 T Perpendicular Magnetic Field: A Treatment Planning Study. Front Oncol (2020) 10:607061. doi:10.3389/fonc.2020.607061
13. Hackett SL, van Asselen B, Wolthaus JWH, Bluemink JJ, Ishakoglu K, Kok J, et al. Spiraling Contaminant Electrons Increase Doses to Surfaces outside the Photon Beam of an MRI-Linac with a Perpendicular Magnetic Field. Phys Med Biol (2018) 63:095001. doi:10.1088/1361-6560/aaba8f
14. Baines J, Powers M, Newman G. Sources of Out-Of-Field Dose in MRgRT: an Inter-comparison of Measured and Monaco Treatment Planning System Doses for the Elekta Unity MR-Linac. Phys Eng Sci Med (2021) 44:1049–59. doi:10.1007/s13246-021-01039-6
15. Winkel D, Bol GH, Kroon PS, van Asselen B, Hackett SS, Werensteijn-Honingh AM, et al. Adaptive Radiotherapy: The Elekta Unity MR-Linac Concept. Clin Transl Radiat Oncol (2019) 18:54–9. doi:10.1016/j.ctro.2019.04.001
16. Lewis D, Chan MF. Correcting Lateral Response Artifacts from Flatbed Scanners for Radiochromic Film Dosimetry. Med Phys (2014) 42:416–29. doi:10.1118/1.4903758
17. Lewis D, Micke A, Yu X, Chan MF. An Efficient Protocol for Radiochromic Film Dosimetry Combining Calibration and Measurement in a Single Scan. Med Phys (2012) 39:6339–50. doi:10.1118/1.4754797
18. Hissoiny S, Raaijmakers AJE, Ozell B, Després P, Raaymakers BW. Fast Dose Calculation in Magnetic fields withGPUMCD. Phys Med Biol (2011) 56:5119–29. doi:10.1088/0031-9155/56/16/003
19. Ahmad SB, Sarfehnia A, Paudel MR, Kim A, Hissoiny S, Sahgal A, et al. Evaluation of a Commercial MRI Linac Based Monte Carlo Dose Calculation Algorithm with Geant 4. Med Phys (2016) 43:894–907. doi:10.1118/1.4939808
Keywords: Elekta Unity, electron streaming effect, anterior coil, monaco unity, MRgRT, out-of-field dose, spiraling contaminant electrons
Citation: Powers M and Baines J (2022) Electron Streaming Effect Associated With the Elekta Unity Anterior Imaging Coil. Front. Phys. 10:880121. doi: 10.3389/fphy.2022.880121
Received: 21 February 2022; Accepted: 21 March 2022;
Published: 25 April 2022.
Edited by:
Urszula Jelen, Genesis Care, AustraliaReviewed by:
Shouliang Ding, Sun Yat-sen University Cancer Center (SYSUCC), ChinaPeter Metcalfe, University of Wollongong, Australia
Copyright © 2022 Powers and Baines. This is an open-access article distributed under the terms of the Creative Commons Attribution License (CC BY). The use, distribution or reproduction in other forums is permitted, provided the original author(s) and the copyright owner(s) are credited and that the original publication in this journal is cited, in accordance with accepted academic practice. No use, distribution or reproduction is permitted which does not comply with these terms.
*Correspondence: Marcus Powers, bWFyY3VzLnBvd2Vyc0BoZWFsdGgucWxkLmdvdi5hdQ==, bWFyY3VzLnBvd2Vyc0BteS5qY3UuZWR1LmF1
†These authors have contributed equally to this work and share first authorship