 Monique Y. Heinke
 Lois Holloway
 Robba Rai1
 Shalini K. Vinod
94% of researchers rate our articles as excellent or good
Learn more about the work of our research integrity team to safeguard the quality of each article we publish.
Find out more
ORIGINAL RESEARCH article
Front. Phys., 07 December 2022
Sec. Medical Physics and Imaging
Volume 10 - 2022 | https://doi.org/10.3389/fphy.2022.879707
This article is part of the Research TopicDosimetry and dose calculation for MR-guided radiation therapyView all 9 articles
Objectives: The objective of this study was to assess the repeatability of MRI for the purpose of radiotherapy treatment planning by considering the difference in registering MRI to MRI compared to registering CT and MRI.
Methods: Fifty patients undergoing radiotherapy planning for gynaecological, prostate, rectal, head and neck and CNS malignancies had a planning CT followed by two T2-weighted MRIs. Anatomical landmarks were contoured on each dataset and the images were rigidly registered. Centre of Mass (COM), Dice Similarity Coefficient (DSC), and Mean Distance to Agreement (MDA) were calculated to assess structure volume and position comparing CT-MRI and MRI-MRI.
Results: DSC and MDA demonstrated more consistency in delineated volumes for MRI-MRI than for the CT-MRI comparison. The median DSC values were ≥0.8 for 15 of 46 contoured structures for the CT-MRI comparison and 21 of 23 structures for the MRI-MRI comparison. MDA values were ≤1 mm for 11 of 46 structures for the CT-MRI comparison and 18 of 23 structures for the MRI-MRI comparisons. COM were also more consistent between MRI-MRI than between CT-MRI.
Conclusion: There was less variability of anatomical structures between repeated MRIs than registered CT and MRI datasets, demonstrating consistency of MRI for volume delineation in radiotherapy planning.
Computed tomography (CT) scans are the primary imaging modality used in the simulation process for radiotherapy treatment planning. However, target volumes and organs at risk (OARs) are not always well discriminated on CT images due to similar attenuation coefficients of soft tissues [1]. Magnetic resonance imaging (MRI) is increasingly being used in the radiotherapy planning process for many tumour sites, including those in the pelvis, head and neck (H&N), and brain [2–5].
The main advantage of MRI over CT is the superior contrast of soft tissue structures [6, 7]. MRI also has the advantage of incorporating functional information using diffusion weighted image sequences or dynamic contrast enhancement further contributing to target volume delineation. Unlike CT, it is possible to image in any plane. However, MRI is more prone to artefacts and distortion than CT [8] leading to some uncertainty as to the reliability and consistency of volume delineation. This is particularly important where MRI-only radiotherapy treatment planning (RTP) is being considered.
To date, the most common method of incorporating MRI in RTP and delivery is by registering MRI to the simulation CT scan. Structures delineated on MRI are transferred to the CT scan for RTP. However, systemic registration errors can arise from the inherent differences in the imaging modalities, changes in patient set-up and positioning between the MRI and CT scans with differences of 2–5 mm reported in the literature [9–13]. These errors are systematic and thus continue throughout the course of radiotherapy treatment and may result in a geographical miss and ultimately poorer tumour control. There also may be differences in anatomical structure positioning due to bladder and rectal filling, which will result in alterations in tumour volume localisation affecting the position of the prostate [14] or cervix [15]. Previous studies evaluating uncertainties in MRI-only RTP have assumed that MR-MR registration uncertainties are reduced compared to those for CT-MRI [15], based on better soft tissue delineation. To the best of our knowledge this has not explicitly been tested.
MRI-only RTP is possible, by creating a synthetic CT (sCT) using atlas-based [16, 17] or deep learning-based [18, 19] methods with assigned electron densities and is increasing in use, particularly with the recent clinical introduction of MRI-linac systems [20]. MRI-only RTP only requires a single MRI dataset, eliminating the need for image registration, while the MRI-linac systems allow for MR-guided radiotherapy (MRgRT), which utilises on-table MR imaging allowing for daily plan adaptation.
Consistency and reproducibility of the MRI scans as well as associated anatomical delineations is crucial for the accuracy of this workflow. The aim of this study is to assess the repeatability of MRI scans and the associated anatomical structure volumes used for RTP for pelvic, H&N and central nervous system (CNS) cancers compared to registration of CT to MRI. This work also explicitly tests the hypothesis that MR-MR registration uncertainties are reduced compared to those for CT-MRI for rigid registration.
Patients who were to undergo planning for radiotherapy at the Liverpool Cancer Therapy Centre, NSW, Australia, were prospectively recruited. A total of fifty patients were recruited and scanned for this study, 10 in each of the following groups: CNS; H&N; gynaecological cancers; rectal cancer; and prostate cancer. Ethics approval was obtained through the South Western Sydney Local Health District Research and Ethics Office.
For the CT and each MRI scan, patients were set up in the radiotherapy treatment position as per the Liverpool Cancer Therapy Centre tumour-site specific protocol, using the same immobilisation devices (including knee cushions, ankle stocks and vacbags) for patient stability and setup reproducibility. The only exception was for the CNS patients who did not have a mask for their MRI scans, as the mask did not fit within the brain coil. For these patients, the chin tilt was matched to the CT simulation scan to aid with fusion purposes, as per the departmental protocol for CNS MRI planning scans.
CT simulations were performed on a Phillips Brilliance Big Bore 16 slice CT scanner (Phillips, USA). The image matrix was 512 × 512 mm and a slice thickness of 2 mm with 2 mm slice increments for all patients apart from four of CNS patients who were undergoing stereotactic radiotherapy and 1 mm slice thickness was used as per departmental protocol.
MR images were obtained using a dedicated MAGNETOM Skyra 3T wide bore MRI scanner (Siemens Healthcare, Erlangen, Germany). A 32-channel integrated spine coil and an 18-channel body coil were utilised for area of interest i.e. H&N and pelvis. A 20-channel Head and Neck coil was used to acquire high resolution CNS scans. The slice thickness was 3 mm for the MRI scans for the pelvis and H&N scans. For the CNS patients the slice thickness was matched to the CT slice thickness based on whether the patient was undergoing stereotactic radiotherapy (1 mm or 2 mm slice thickness) or conventionally fractionated treatment (2 mm slice thickness). The slice thickness used was based on departmental protocols. Spacing of 0 mm was used for all scans. 2D T2-weighted turbo Spin Echo (TSE) MRI sequences were obtained in the transverse plane with a small field of view (FOV) covering the area of interest for all the pelvic and H&N scans. The entire brain was included for the CNS scans. An additional large FOV 2D T1-weighted TSE was acquired for both gynaecological and rectal cancer to assist with bone registration to CT. The minimum in-plane resolution was 1 mm2 for all scans.
All patients had their CT and MRI planning scans on the same day. Depending on the scheduling of the scans, based on availability, the CT was usually done first followed by the two MRI scans. Following the first MRI scan (MRI1), patients got up off the MRI couch and subsequently were repositioned for a second MRI scan (MRI2). On average there was 40 min between the acquisition of the CT and MRI1 scans and 15 min between the MRI1 and MRI2 scans.
A series of anatomical landmarks were contoured by a single observer on the CT and the two MRI datasets of each patient using MIM software (MIM software Inc., Ohio, USA). The contouring guidelines used of reach structure are described in Supplementary Table S1. To assess volume and registration consistency across the MRI FOV, both bony and soft tissue landmarks located throughout the MRI datasets were selected. The structures examined were expected to remain stable between scans. Bony structures were the maxillary sinus for the CNS and H&N scans and the acetabulum for the pelvic studies. Soft tissue structures included the spinal cord, cerebellum, parotid glands, larynx, external iliac vessels, and the prostate. The guidelines used to contour individual landmarks are described in the Appendix. For the MR and CT datasets, MIM software preset window-level settings for T2 MRI (check settings), CT bone (Window 400; Level 40) and CT soft tissue (Window 2500; Level 500) were used for contouring. For each structure a volume was created by contouring over a set number of image slices. The number of slices contoured for the structure was determined by the slice thickness of the CT (2 mm) or the MRI scans (3 mm). For each structure the same portion of the structure was contoured on each dataset and an equivalent volume length was contoured on each modality.
Where a portion of a structure was outside the MRI FOV or there were significant artefacts, for example from a total hip replacement; the affected structure was not included in the analysis for the three image datasets for that patient. These patients were not excluded from the study and they reflect the patient population receiving pelvic radiotherapy and the remaining structures were not affected by the artefact. In addition, when a structure was not wholly within the FOV for one or both of the MRI scans, for example the lateral portion of the acetabulum, this structure was not included in the analysis for that patient.
Following the contouring of the structures on each dataset, the images were registered using a rigid fusion to bone landmarks using MIM software. The algorithm used for rigid registration by MIM software is mutual information. The cost function is either correlation or mutual information with set constraints on the amount of translation and rotation allowed (communication with MIM engineering). An initial automatic fusion was then checked and adjusted manually by a single observer and checked by a second observer. The registrations used were CT to MRI1, CT to MRI2 and MRI1 to MRI2 and used identical cost functions. Structure volumes were transferred to the primary dataset and analysed. A summary of the workflow for the study and representative images and registrations are shown in Figure 1.
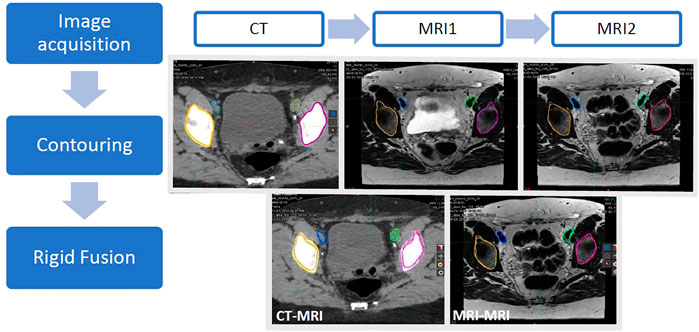
FIGURE 1. Schematic representation of the workflow. CT, MRI1 and MRI2 images were acquired on the same day with the patient set up in the radiotherapy treatment position for each scan. Anatomical structures (left and right acetabulum and left and right external iliac vessels) were contoured on the three image datasets. Rigid registrations between the CT and each MRI dataset (CT-MRI) as well as the two MRI datasets (MRI-MRI) were performed.
Contour comparison metrics were used in this study to compare each structure volume from the three image datasets (CT, MRI1 and MRI2) and the relative position of the structures between the registered images. Calculations were performed in MIM or using an in-house code in MATLAB (R2017b, MathWorks, Inc., Natick, MA, USA).
Volume in cubic centimetres (cm3) was the total volume of the contoured structure on each dataset and analysed prior to image registration. Centre of Mass (COM) is Euclidean distance from the centre position of each structure between image datasets, measured in millimetres (mm) and compares the registration of the image datasets. The Dice Similarity Coefficient (DSC) is a measure of spatial overlap between the contours on the fused datasets. The DSC range is between zero (indicating no overlap between structures) and 1 (indicating exact overlap). Mean Distance to Agreement (MDA), measured in millimetres (mm), is the average of straight-line distance between two contours. COM, DSC and MDA were calculated as described by Jameson et al. [21].
A student’s t-test was used to determine the statistical differences between the structure volumes between each dataset. A p-value of <0.05 was considered significant, (IBM SPSS Statistics, version 23, NY, USA).
The number of patient datasets included in the analysis of each structure for the different anatomical areas are presented in Table 1. Where structures were omitted from the analysis, the reason for omission is summarised in Table 1, for example, two of the prostate cancer patients had a unilateral total hip replacement with significant artefact affecting visualisation of the ipsilateral acetabulum, meaning this structure was excluded from the analysis.
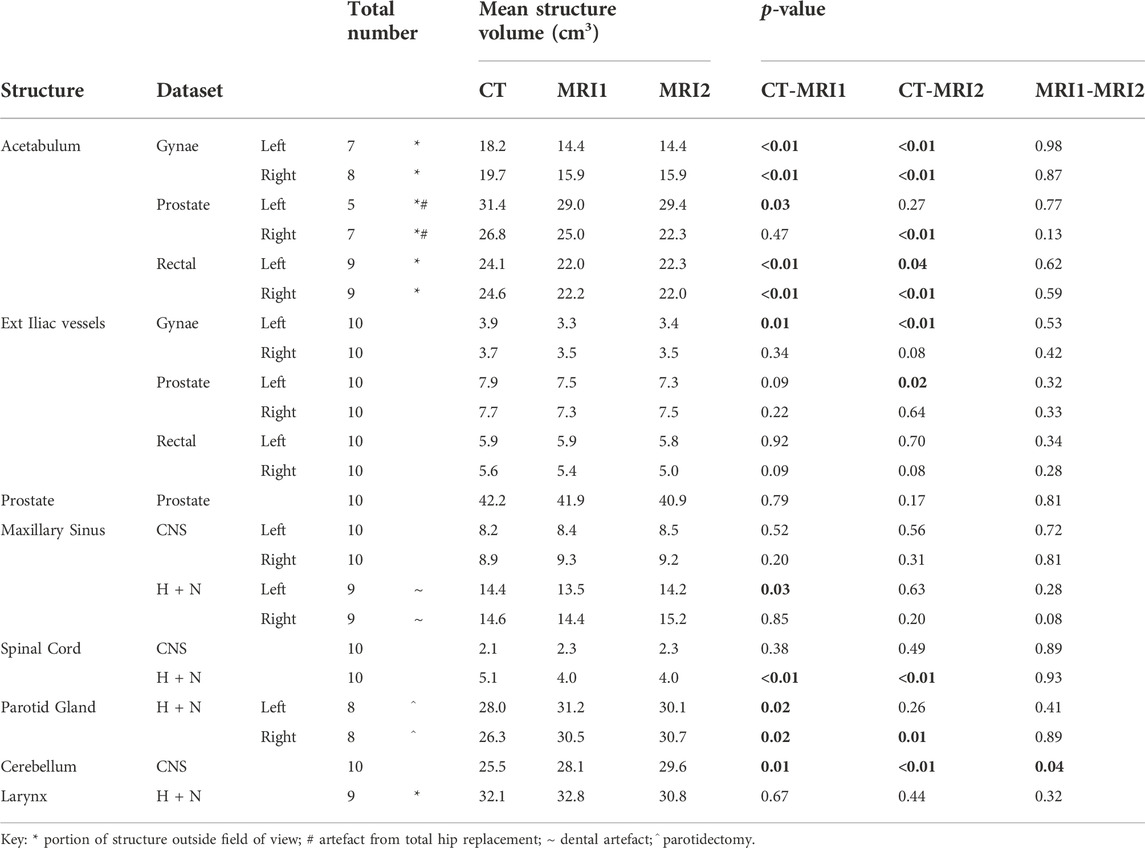
TABLE 1. Mean volume of each contoured anatomical structures (cubic centimeters (cm3)) on the CT, MRI1 and MRI2 datasets for the CNS, H + N, gynaecological, prostate and rectal cancer patient groups (n = 10 for each patient group); and p-values for the comparison of CT to each MRI and the two MRI scans. Statistically significant differences (<0.05) between the datasets are in bold. The numbers of structures included for each dataset are indicated. Where a structure was omitted from the analysis the reason is given below, see key.
The average volume in cm3 for the anatomical structures analysed for each tumour group are presented in Table 1. The average volumes of each structure on the pelvic MRIs were smaller when compared to the average on the CT scan. There was no significant difference between the average structure volume when comparing MR1 to MR2.
For the CNS and H&N scans the average volumes measured for each structure on the two MRI datasets were not significantly different, except for the average volume for the cerebellum, which was larger for MRI2. There was, however, more variability comparing the average structure volumes on the CT to both MRI datasets. In contrast to the pelvic scans, where all the structure volumes on the CT were larger than the corresponding structure on the MRI datasets, for the CNS and H&N scans some structures were larger on the CT while others smaller.
The median COM values for the anatomical structures analysed in the three pelvic treatment sites were similar for both CT to MRI comparisons, see Figure 2. This indicates that despite the smaller structure volumes on the MRI datasets compared to CT, there is good registration between imaging modalities. The median COM values were generally smaller for the MRI to MRI comparison, except for the left acetabulum on the Gynae dataset and the right acetabulum on the Rectal dataset. For MRI to MRI registration the median COM value was 2 mm or less for all structures, except for the left external iliac vessels on the Gynae scans which had a difference of 2.3 mm. The median COM for the prostate was 2.9 mm and 3.1 mm for each of the CT to MRI comparisons and 2.0 mm for the MRI to MRI comparison.
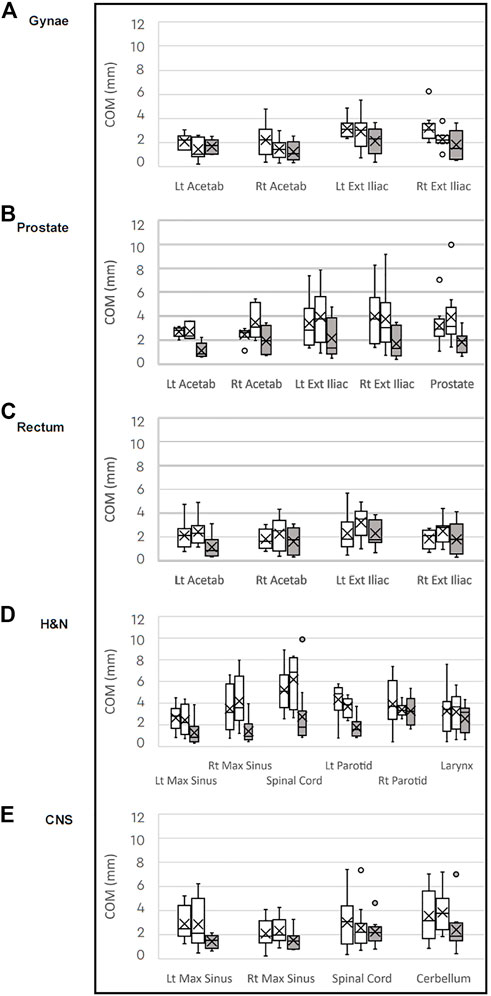
FIGURE 2. Box plots of median Centre of Mass (COM) differences in millimeters for each anatomical structure comparing the CT to MRI datasets (white) and MRI to MRI (grey) for the (A) gynaecological; (B) prostate; (C) rectal; (D) H&N: and (E) CNS patient groups.
There was a similar pattern for the CNS and H&N scans, with the median COM for all structures smaller on the MRI to MRI registration than for the CT to MRI registrations. The median COM of 19 of the 23 structures analysed over the five tumour groups were less than 2 mm for the MRI to MRI registration. The largest median COM distance was 3.2 mm for the right parotid and larynx structures on the H&N datasets.
For each of the treatment sites, the median DSC results for the CT to MRI and MRI to MRI comparisons are shown in the box plots in Figure 3. Overall, the CT to MRI DSC values for each structure are similar, and for all structures the MRI to MRI comparison has a higher DSC value. The median DSC value for the CT to MRI comparison was 0.70 or greater, except for the spinal cord on one CT to MRI comparison in each of the CNS and H&N datasets, which measured 0.67 and 0.65 respectively. For the MRI to MRI comparison, all structures had median DSC values of over 0.80, indicating there is better overlap of structures in the MRI to MRI registration. There was good overlap between the CT to MRI datasets for the prostate (median DSC 0.81 and 0.80), but better correlation between the prostate volumes on the two MRI scans (mean DSC 0.89).
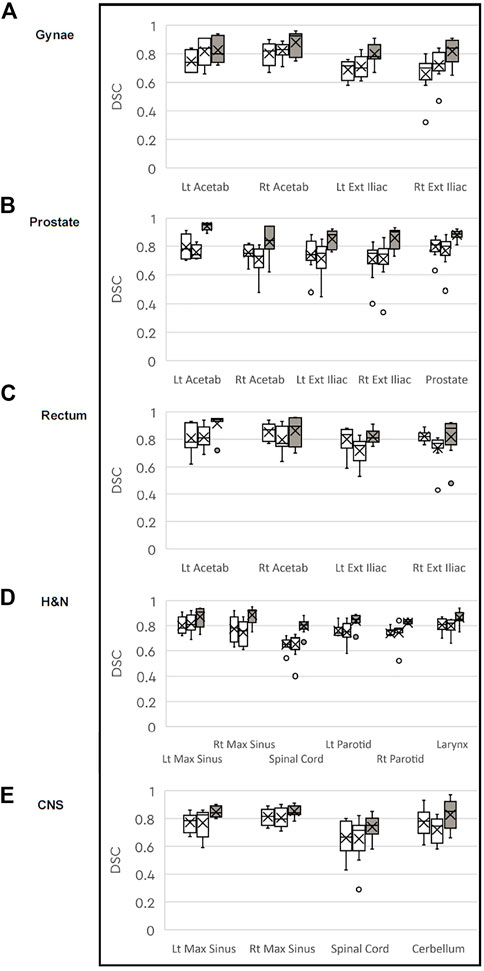
FIGURE 3. Box plots of median DICE Similarity Coefficient (DSC) for each anatomical structure comparing the CT to MRI datasets (white) and MRI to MRI (grey) for the (A) gynaecological; (B) prostate; (C) rectal: (D) H&N: and (E) CNS patient groups.
The median MDA values comparing the CT to the two MRIs for each structure is similar and is ≤ 1.2 mm for all structures, see Figure 4. The median MDA value for all structures in the MRI to MRI comparison is better than for the CT to MRI comparisons for all structures in all five tumour datasets.
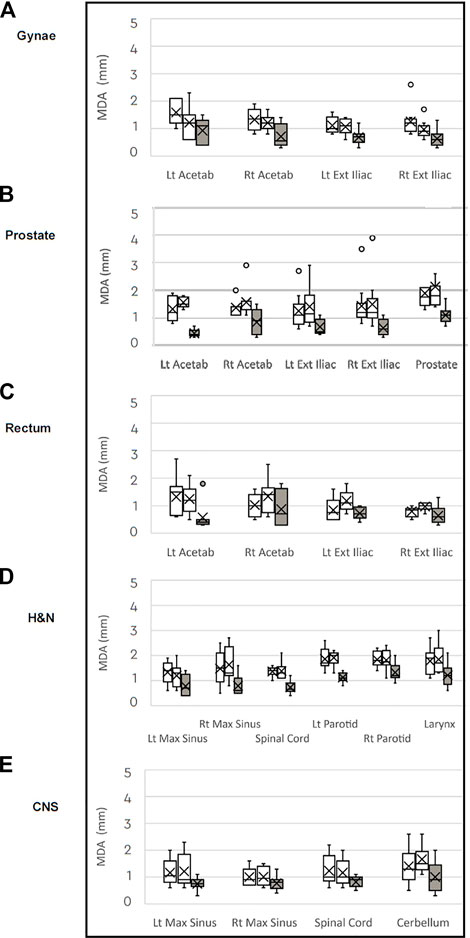
FIGURE 4. Box plots of median Mean Distance to Agreement (MDA) in millimeters for each anatomical structure comparing the CT to MRI datasets (white) and MRI to MRI (grey) for the (A) gynaecological; (B) prostate; (C) rectal: (D) H&N: and (E) CNS patient groups.
This study evaluates the repeatability of MR images for the purpose of radiotherapy treatment planning using image registration; anatomical structure volumes and position; and by analysing several metrics on CT and MRI datasets. The structure volumes on all pelvic scans were smaller on the MRI compared to the CT scans (Table 1) due to the superior soft tissue contrast on MRI compared to CT. Other studies have also reported smaller prostate, rectum, cervix and uterine body volumes on MRI scans as compared to the CT images [22–24]. The difference seen in the bone structure volumes (acetabulum and maxillary sinus) on CT and MRI is likely due to the poor visibility of bone on T2-weighted MRI sequences, which may vary up to 4 mm [25]. Mean parotid gland and cerebellar volumes were smaller on the CT datasets compared to MRI which indicates the improved ability to detect the structure edge on MR due to better soft tissue delineation, consistent with previous reports [26].
Overall, the reproducibility of structure volumes was good between CT and MRI, as seen by the DSC and mean MDA values for each structure. For 22 of 23 structures analysed the median DSC values comparing MRI to MRI scans were higher, indicating better volume correlation between the two MRI scans than between the CT and MRI (Figure 3). Our median DSC values for the prostate of 0.81 and 0.80 for the CT to MRI comparisons are comparable with published data. Sabater et al. reports a median DSC value of 0.70 for the prostate using a rigid registration of CT and MRI [27]. In our study, the median prostate DSC value of 0.89 for the MRI to MRI comparison demonstrates better volume consistency between the two MRI scans than the CT to MRI registration. A similar improvement in the prostate DSC value has been shown using deformable MR to MR registration [24]. MDA measures the average distance from a point in one dataset to the closest point in the second dataset. An MDA of 2 mm or less for CT to MRI are in keeping with published data, including MDA values ranging between 2 and 4 mm for the cervix clinical target volume (CTV) [28]. MDA distances were consistently smaller for all structures when the two MRIs (1.2 mm or less) were registered than for the CT to MRI registration, as shown in Figure 4. Both DSC and MDA results demonstrate there is superior volume correlation between sequential MRI scans than between CT and MRI.
The accuracy of position consistency between sequential MRI scans and CT to MRI was analysed by the COM metric using rigidly registered datasets. For all three pelvic treatment sites, the median COM values were similar for each CT to MRI comparison and were generally less than 3.0 mm. Thus, despite the smaller structure volumes on the MRIs, there is good registration between imaging modalities. For the prostate, the median COM values were 3.0 mm and 3.2 mm for each of CT to MRI comparison. This is consistent with the literature, where registration errors between CT and MRI datasets of up to 4 mm for the prostate are reported [10]. Other studies report registration differences of 1.7 and 1.9 mm for the left and right ovoids in cervix brachytherapy [23] and between 2.7 and 4.4 mm for rectal cancer CTV registration [10] when MRI is registered to the CT. Our median COM values were smaller for the MRI to MRI comparison, including for the prostate which had a median COM of 2.0 mm. A tolerance in the order of 2 mm is accepted in the central portion of MRI scans used for radiotherapy planning [29] and clinically Nyholm et al. report a 2 mm mean distortion of the prostate in the centre of the pelvis when using an MRI-only radiotherapy planning system [12]. MRI to MRI registration reduces registration errors as compared to CT to MRI image fusion.
A limitation of the current study is that geometric distortions were assumed to be minimal and were not specifically assessed. The MRI scans were performed with a large bandwidth and radiotherapy set-up protocols to minimise geometric and intrinsic differences of the images which included use of the vendor supplied gradient non-linearity corrections. Previous work has demonstrated distortions of MR images are smaller closer to the MRI isocenter and increase at larger distances [8] with variations measuring 5–10 mm at the periphery of the image [30–32]. A further limitation of this study is that the anatomical structures analysed are not generally contoured in radiotherapy simulation scans as they are neither the tumour volume or OARs. The structures that were analysed in this study were chosen to minimise variations in size, shape and position during and between scans. The bladder, rectum and cervix are prone to large variations [14, 15], so were not included. Prostate volumes were included but have been reported to move approximately 2 mm over the duration of an MRI scan [33]. Contouring guidelines were created by the authors to ensure the same portion of each selected structure was contoured on the three datasets. Minor variations in patient positioning and angulation affected the metrics, in particular the MDA values for the larger structures such as the acetabulum or maxillary sinus. These slight differences in patient setup are similar to those experienced in a clinical setting and are accounted for within the planning tumour volume (PTV) expansion. Image registration was carried out using the MIM software, which is used clinically within our department. Further investigations could be conducted to assess variability between other registration packages, however, this not within the scope of the current study.
The current study did not assess interobserver variability as only a single observer performed the contouring. The use of a single observer reflects clinical practice in RTP. Previous studies have looked at the issue of interobserver variability in contouring structures for H&N [34] and prostate [35] RTP. There was good interobserver correlation in the delineation of gross tumour volumes on both CT and MRI in the H&N region [34] and for the prostate on planning MRIs [35].
It should be noted that the slice thickness of the CT (2 mm) and MRI (3 mm) in this study differ. This means that there could be a 1 mm cranio-caudal difference in structure metrics, which would have an impact on structures which extend cranio-caudally. This difference in slice thickness is common in image acquisition for radiotherapy planning [24].
A practical consideration for the use of MRI in radiotherapy planning and treatment is consistency in patient setup and positioning which has an impact on the quality of image registration. Immobilising patients in the radiotherapy treatment position for all scans reduces potential set-up errors and improves target volume overlap and registration of structures on planning CT and MRI scans [22]. In addition, the correct positioning of the patient minimises variations in bony landmarks between scans, for example rotation of the pelvis in the sagittal plane increases the movement of the sacral promontory and pubic symphysis by up to 3 and 8 mm respectively [15].
MRI-only RTP requires the generation of sCT images from the MRI dataset to determine Hounsfield Unit (HU) values and hence calculate radiotherapy doses. Most studies describing methods for the generation of sCT images use 3D T2-weighted MRI sequences [16, 17, 36]. Koivula et al. describe a generalised method for the conversion of standard T2-weighted MR images to synthetic HU values required for the generation of a sCT [37]. Their method was tested on four different MRI scanners, two of which used 2D T2-weighted sequences. This generalised method produced clinically acceptable dose calculations for all MRI scanners and MRI sequences used in their study. No significant differences were noted between the dose calculations derived from sCT images generated from 2D or 3D MRI sequences, hence supporting the use of the 2D MRI sequence used in this study.
The use of MRI in radiotherapy has been expanding over the past decade. MRI used in treatment planning has led to improved target volume and normal tissue delineation, resulting in better tumour control rates [38, 39] and lower normal tissue complications [40]. MRI-only radiotherapy is being developed for clinical use, examples include MRI-only radiotherapy for prostate treatment [16, 17] and MR-guided radiotherapy using MRI combined with a cobalt-60 source [41] or a linear accelerator [1, 20, 42]. This study supports the use of MRI-only radiotherapy planning and treatment by demonstrating that there is consistency in MRI scans and associated structure volumes.
To our knowledge this is the first study examining anatomical reproducibility of sequential MRI compared with CT and MRI radiotherapy planning images for pelvic, H&N and CNS treatment. The results from this study demonstrate there is less variability of anatomical structures and improved registration between sequential MRI scans compared to CT and MRI scans. Clinically, these findings support the use of MR images alone for delineation of target volumes and OARs in the radiotherapy treatment planning process as we move toward a complete MRI only workflow.
The original contributions presented in the study are included in the article/Supplementary Material, further inquiries can be directed to the corresponding author.
The studies involving human participants were reviewed and approved by Liverpool Hospital. The patients/participants provided their written informed consent to participate in this study.
LH, MH, and SV designed the study. RR performed the MRI scanning, MH undertook the contouring and MH and RR performed the image registration. Data analysis was performed by LH and MH assisted with the data interpretation. MH wrote the manuscript and LH, RR, and SV contributed to editing the manuscript.
The authors would like to acknowledge the staff at the Liverpool Cancer Therapy Centre for assisting with study development, patient recruitment and image acquisition.
The authors declare that the research was conducted in the absence of any commercial or financial relationships that could be construed as a potential conflict of interest.
All claims expressed in this article are solely those of the authors and do not necessarily represent those of their affiliated organizations, or those of the publisher, the editors and the reviewers. Any product that may be evaluated in this article, or claim that may be made by its manufacturer, is not guaranteed or endorsed by the publisher.
The Supplementary Material for this article can be found online at: https://www.frontiersin.org/articles/10.3389/fphy.2022.879707/full#supplementary-material
Supplementary Table S1 | Summary of the contouring guidelines used for each anatomical structure in this study.
1. Keall PJ, Barton M, Crozier S. The Australian magnetic resonance imaging–linac program. Semin Radiat Oncol (2014) 24:203–6. doi:10.1016/j.semradonc.2014.02.015
2. Rasch C, Barillot I, Remeijer P, Touw A, van Herk M, Lebesque JV, et al. Definition of the prostate in CT and MRI: A multi-observer study. Int J Radiat Oncol Biol Phys (1999) 43:57–66. doi:10.1016/s0360-3016(98)00351-4
3. Barillot I, Reynaud-Bougnoux A The use of MRI in planning radiotherapy for gynaecological tumours. Cancer Imaging (2006) 6:100–6. doi:10.1102/1470-7330.2006.0016
4. Thiagarajan A, Caria N, Schoder H, Iyer NG, Wolden S, Wong RJ, et al. Target volume delineation in oropharyngeal cancer: Impact of PET, MRI, and physical examination. Int J Radiat Oncol Biol Phys (2012) 83:220–7. doi:10.1016/j.ijrobp.2011.05.060
5. Aoyama H, Shirato H, Nishioka T, Hashimoto S, Tsuchiya K, Kagei K, et al. Magnetic resonance imaging system for three-dimensional conformal radiotherapy and its impact on gross tumor volume delineation of central nervous system tumors. Int J Radiat Oncol Biol Phys (2010) 50:821–7. doi:10.1016/s0360-3016(01)01598-x
6. Khoo VS, Dearnaley DP, Finnigan DJ, Padhani A, Tanner SF, Leach MO. Magnetic resonance imaging (MRI): Considerations and applications in radiotherapy treatment planning. Radiother Oncol (1997) 42:1–15. doi:10.1016/s0167-8140(96)01866-x
7. Chen L, Price RA, Wang L, Li J, Qin L, McNeeley S, et al. MRI-based treatment planning for radiotherapy: Dosimetric verification for prostate IMRT. Int J Radiat OncologyBiologyPhysics (2004) 60:636–47. doi:10.1016/s0360-3016(04)00960-5
8. Walker A, Liney G, Metcalfe P, Holloway L. MRI distortion: Considerations for MRI based radiotherapy treatment planning. Australas Phys Eng Sci Med (2014) 37:103–13. doi:10.1007/s13246-014-0252-2
9. Roberson PL, McLaughlin PW, Narayana V, Troyer S, Hixson GV, Kessler ML. Use and uncertainties of mutual information for computed tomography/magnetic resonance (CT/MR) registration post permanent implant of the prostate. Med Phys (2005) 32:473–82. doi:10.1118/1.1851920
10. Dean CJ, Sykes JR, Cooper RA, Hatfield P, Carey B, Swift S, et al. An evaluation of four CT-MRI co-registration techniques for radiotherapy treatment planning of prone rectal cancer patients. Br J Radiol (2012) 85:61–8. doi:10.1259/bjr/11855927
11. Ulin K, Urie MM, Cherlow JM. Results of a multi-institutional benchmark test for cranial CT/MR image registration. Int J Radiat Oncol Biol Phys (2010) 77:1584–9. doi:10.1016/j.ijrobp.2009.10.017
12. Nyholm T, Nyberg M, Karlsson MG, Karlsson M. Systematisation of spatial uncertainties for comparison between a MR and a CT-based radiotherapy workflow for prostate treatments. Radiat Oncol (2009) 4:54. doi:10.1186/1748-717x-4-54
13. Daisne JF, Sibomana M, Bol A, Cosnard G, Lonneux M, Gregoire V. Evaluation of a multimodality image (CT, MRI and PET) coregistration procedure on phantom and head and neck cancer patients: Accuracy, reproducibility and consistency. Radiother Oncol (2003) 69:237–45. doi:10.1016/j.radonc.2003.10.009
14. Kerkhof EM, van der Put RW, Raaymakers BW, van der Heide UA, van Vulpen M, Lagendijk JJ. Variation in target and rectum dose due to prostate deformation: An assessment by repeated MR imaging and treatment planning. Phys Med Biol (2008) 53:5623–34. doi:10.1088/0031-9155/53/20/004
15. Kerkhof EM, van der Put RW, Raaymakers BW, van der Heide UA, Jurgenliemk-Schulz IM, Lagendijk JJ. Intrafraction motion in patients with cervical cancer: The benefit of soft tissue registration using MRI. Radiother Oncol (2009) 93:115–21. doi:10.1016/j.radonc.2009.07.010
16. Dowling JA, Sun J, Pichler P, Rivest-Henault D, Ghose S, Richardson H, et al. Automatic substitute computed tomography generation and contouring for magnetic resonance imaging (MRI)-Alone external beam radiation therapy from standard MRI sequences. Int J Radiat Oncology*Biology*Physics (2015) 93:1144–53. doi:10.1016/j.ijrobp.2015.08.045
17. Edmund JM, Nyholm T. A review of substitute CT generation for MRI-only radiation therapy. Radiat Oncol (2017) 12:28. doi:10.1186/s13014-016-0747-y
18. Shafai-Erfani G, Wang T, Lei Y, Tian S, Patel P, Jani AB, et al. Dose evaluation of MRI-based synthetic CT generated using a machine learning method for prostate cancer radiotherapy. Med Dosimetry (2019) 44:E64–E70. doi:10.1016/j.meddos.2019.01.002
19. Qi M, Li Y, Jia Q, Li B, Sun W, Dai Z, et al. Multi-sequence MR image-based synthetic CT generation using a generative adversarial network for head and neck MRI-only radiotherapy. Med Phys (2020) 47:1880–94. doi:10.1002/mp.14075
20. de Leon J, Crawford D, Moutrie Z, Alvares S, Hogan L, Pagulayan C, et al. Early experience with MR-guided adaptive radiotherapy using a 1.5 T MR-Linac: First 6 months of operation using adapt to shape workflow. J Med Imaging Radiat Oncol (2021) 66:138–45. doi:10.1111/1754-9485.13336
21. Jameson MG, Holloway LC, Vial PJ, Vinod SK, Metcalfe PE. A review of methods of analysis in contouring studies for radiation oncology. J Med Imaging Radiat Oncol (2010) 54:401–10. doi:10.1111/j.1754-9485.2010.02192.x
22. Hanvey S, Sadozye AH, McJury M, Glegg M, Foster J. The influence of MRI scan position on image registration accuracy, target delineation and calculated dose in prostatic radiotherapy. Br J Radiol (2012) 85:e1256–62. doi:10.1259/bjr/26802977
23. Dolezel M, Odrazka K, Zizka J, Vanaske J, Kohlova T, Kroulik T, et al. MRI-Based preplanning using CT and MRI data fusion in patients with cervical cancer treated with 3D-based brachytherapy: Feasibility and accuracy study. Int J Radiat Oncology*Biology*Physics (2012) 84:146–52. doi:10.1016/j.ijrobp.2011.11.003
24. Christiansen RL, Dysager L, Bertelsen AS, Hansen O, Brink C, Bernchou U. Accuracy of automatic deformable structure propagation for high-field MRI guided prostate radiotherapy. Radiat Oncol (2020) 15:32. doi:10.1186/s13014-020-1482-y
25. Wang H, Balter J, Cao Y. Patient-induced susceptibility effect on geometric distortion of clinical brain MRI for radiation treatment planning on a 3T scanner. Phys Med Biol (2013) 58:465–77. doi:10.1088/0031-9155/58/3/465
26. Gong G, Kong X, Wang X, Zheng C, Guo Y, Yin Y. Finding of dose evaluation for organs at risk in intensity-modulated radiation therapy for nasopharyngeal carcinoma using magnetic resonance imaging. Precis Radiat Oncol (2017) 1:7–12. doi:10.1002/pro6.6)
27. Sabater S, Pastor-Juan Mel R, Berenguer R, Andres I, Sevillano M, Lozano-Setien E, et al. Analysing the integration of MR images acquired in a non-radiotherapy treatment position into the radiotherapy workflow using deformable and rigid registration. Radiother Oncol (2016) 119:179–84. doi:10.1016/j.radonc.2016.02.032
28. Ghose S, Holloway L, Lim K, Chan P, Veera J, Vinod SK, et al. A review of segmentation and deformable registration methods applied to adaptive cervical cancer radiation therapy treatment planning. Artif Intell Med (2017) (2015) 64:75–87. doi:10.1016/j.artmed.2015.04.006
29. Paulson ES, Crijns SP, Keller BM, Wang J, Schmidt MA, Coutts G, et al. Consensus opinion on MRI simulation for external beam radiation treatment planning. Radiother Oncol (2016) 1:187–92. doi:10.1016/j.radonc.2016.09.018
30. Schnabel JA, Tanner C, Castellano-Smith AD, Degenhard A, Leach MO, Hose DR, et al. Validation of nonrigid image registration using finite-element methods: Application to breast MR images. IEEE Trans Med Imaging (2003) 22:238–47. doi:10.1109/tmi.2002.808367
31. Lee YK, Bollet M, Charles-Edwards G, Flower MA, Leach MO, McNair H, et al. Radiotherapy treatment planning of prostate cancer using magnetic resonance imaging alone. Radiother Oncol (2003) 66:203–16. doi:10.1016/s0167-8140(02)00440-1
32. Walker A, Liney G, Holloway L, Dowling J, Rivest-Henault D, Metcalfe P. Continuous table acquisition MRI for radiotherapy treatment planning: Distortion assessment with a new extended 3D volumetric phantom. Med Phys (2015) 42:1982–91. doi:10.1118/1.4915920
33. Kotte AN, Hofman P, Lagendijk JJ, van Vulpen M, van der H Intrafraction motion of the prostate during external-beam radiation therapy: Analysis of 427 patients with implanted fiducial markers. Int J Radiat Oncol Biol Phys (2007) 69:419–25. doi:10.1016/j.ijrobp.2007.03.029
34. Geets X, Daisne J-F, Arcangeli S, Coche E, De Poel M, Duprez T, et al. Inter-observer variability in the delineation of pharyngo-laryngeal tumor, parotid glands and cervical spinal cord: Comparison between CT-scan and MRI. Radiother Oncol (2005) 77:25–31. doi:10.1016/j.radonc.2005.04.010
35. Sanders JW, Mok H, Hanania AN, Venkatesan AM, Tang C, Bruno TL, et al. Computer-aided segmentation on MRI for prostate radiotherapy, Part I: Quantifying human interobserver variability of the prostate and organs at risk and its impact on radiation dosimetry. Radiother Oncol (2022) 169:124–31. doi:10.1016/j.radonc.2021.12.011
36. Johansson A, Karlsson M, Nyholm T. CT substitute derived from MRI sequences with ultrashort echo time. Med Phys (2011) 38:2708–14. doi:10.1118/1.3578928
37. Koivula L, Kapanen M, Seppala T, Collan J, Dowling JA, Greer PB, et al. Intensity-based dual model method for generation of synthetic CT images from standard T2-weighted MR images – generalized technique for four different MR scanners. Radiother Oncol (2017) 125:411–9. doi:10.1016/j.radonc.2017.10.011
38. Mazeron R, Castelnau-Marchand P, Escande A, Rivin del Campo E, Maroun P, Lefkopoulos D, et al. Tumor dose-volume response in image-guided adaptive brachytherapy for cervical cancer: A meta-regression analysis. Brachytherapy (2016) 15:537–42. doi:10.1016/j.brachy.2016.05.009
39. Dimopoulos JC, Lang S, Kirisits C, Fidarova EF, Berger D, Georg P, et al. Dose-volume histogram parameters and local tumor control in magnetic resonance image-guided cervical cancer brachytherapy. Int J Radiat Oncology*Biology*Physics (2009) 75:56–63. doi:10.1016/j.ijrobp.2008.10.033
40. Mazeron R, Fokdal LU, Kirchheiner K, Georg P, Jastaniyah N, Segedin B, et al. Dose–volume effect relationships for late rectal morbidity in patients treated with chemoradiation and MRI-guided adaptive brachytherapy for locally advanced cervical cancer: Results from the prospective multicenter EMBRACE study. Radiother Oncol (2016) 120:412–9. doi:10.1016/j.radonc.2016.06.006
41. Mutic S, Dempsey JF. The ViewRay system: Magnetic resonance-guided and controlled radiotherapy. Semin Radiat Oncol (2014) 24:196–9. doi:10.1016/j.semradonc.2014.02.008
Keywords: MR-guided radiotherapy, radiotherapy planning, repeatability, MRI-linac, MRL, image registration
Citation: Heinke MY, Holloway L, Rai R and Vinod SK (2022) Repeatability of MRI for radiotherapy planning for pelvic, brain, and head and neck malignancies. Front. Phys. 10:879707. doi: 10.3389/fphy.2022.879707
Received: 20 February 2022; Accepted: 18 November 2022;
Published: 07 December 2022.
Edited by:
Urszula Jelen, Genesis Care, AustraliaReviewed by:
Andrew Green, The University of Manchester, United KingdomCopyright © 2022 Heinke, Holloway, Rai and Vinod. This is an open-access article distributed under the terms of the Creative Commons Attribution License (CC BY). The use, distribution or reproduction in other forums is permitted, provided the original author(s) and the copyright owner(s) are credited and that the original publication in this journal is cited, in accordance with accepted academic practice. No use, distribution or reproduction is permitted which does not comply with these terms.
*Correspondence: Shalini K. Vinod, U2hhbGluaS5WaW5vZEBoZWFsdGgubnN3Lmdvdi5hdQ==
Disclaimer: All claims expressed in this article are solely those of the authors and do not necessarily represent those of their affiliated organizations, or those of the publisher, the editors and the reviewers. Any product that may be evaluated in this article or claim that may be made by its manufacturer is not guaranteed or endorsed by the publisher.
Research integrity at Frontiers
Learn more about the work of our research integrity team to safeguard the quality of each article we publish.