 Meng Cai
 Han Luo
 Xiao Meng
 Ying Cui
- 1School of Humanities and Social Sciences, Xi’an Jiaotong University, Xi’an, China
- 2School of Journalism and New Media, Xi’an Jiaotong University, Xi’an, China
- 3School of Mechano-Electronic Engineering, Xidian University, Xi’an, China
In the field of social media, the systematic impact that bot users bring to the dissemination of public opinion has been a key concern of the research. To achieve more effective opinion management, it is important to understand how and why behavior differs between bot users and human users. The study compares the differences in behavioral characteristics and diffusion mechanisms between bot users and human users during public opinion dissemination, using public health emergencies as the research target, and further provides specific explanations for the differences. First, the study classified users with bot characteristics and human users by establishing the relevant formulas of user indicator characteristics. Secondly, the study used deep learning methods such as Top2Vec and BERT to extract topics and sentiments, and used social network analysis methods to construct network graphs and compare network attribute features. Finally, the study further compared the differences in information dissemination between posts published by bot users and human users through multi-factor ANOVA. It was found that there were significant differences in behavioral characteristics and diffusion mechanisms between bot users and human users. The findings can help guide the public to pay attention to topic shifting and promote the diffusion of positive emotions in social networks, which in turn can better achieve emergency management of emergencies and the maintenance of online orders.
1 Introduction
With the formation and development of Internet technology, online social networks (OSNs) have also been developed rapidly. And various social media with online social functions have gradually penetrated everyone’s daily life and occupied an important position in interpersonal communication and interaction. With the help of different social media platforms, people share and receive information and interact with each other [1]. The popularity of social media has not only brought about close social ties and easier access to information, but also exposed individuals to massive amounts of fragmented information [2], which puts pressure on their information processing abilities [3]. In recent years, public and scientific discussions about the Internet and social media have begun to focus on the possible negative effects of social media. Social media is often seen as a nexus for spreading misinformation, fake news, and hate speech during the breaking of major events [4]. The negative effects of social media make online users vulnerable to irrational or malicious users. Web users may ignore or avoid information or even reduce the use of social media platforms in several ways [5]. On the other hand, social bots often play an important role in the mass dissemination of misinformation. Users are easily misled by misinformation, which further intensifies group pressure and negative emotions and may escalate the situation, which may lead to mass incidents [6].
Social bots active in social media, manipulated by automated algorithms and driven by human interests and purposes, have attracted considerable attention from researchers in recent years. Social bots create a large amount of social media content and occupy an important role in online communication and interaction. For example, Pew Research Center examined about 1.2 million tweets linked to the most popular news and current affairs sites on Twitter and found that 66% of the tweets were likely shared by bot accounts [7]. From the perspective of social media accounts, related studies have also found that between 9 and 15% of social accounts on Twitter are manipulated by bots [8]. In other social media, social bots have similarly high activity. For example, Facebook has also shown that about 100,000 bots interact in this social media every month [9]. The large number of bots that populate social media, interacting with human users in the media environment and using them to spread news and information, is an important factor influencing the dissemination of information in social networks.
Social bots are also active in various types of emergencies. When emergencies occur, social media becomes an important channel for public communication and exchange. The public uses social media to seek information about events, share opinion strategies, and gain emotional support [10]. However, the problems caused by social bots and related rumors, and fake news cannot be ignored [11]. During breaking events, social bots imitate human users and deliver false news and fake information, and even carry out malicious activities such as spreading conspiracies and publishing hate speech, which in turn disrupt the normal network order and network ecology and cause network users to form negative emotions such as panic, causing great hindrance and difficulties in network governance [12]. Meanwhile, social bots can create false popularity [13] and make the complex social media environment more uncertain through group pressure and network contagion. Therefore, it is necessary to study social bots to compare the differences in information dissemination between bots and human users in emergent events, and thus contribute to the maintenance of online order.
In this paper, we explore the systematic impact of social bots on the social media environment and compare the differential impact brought by social bots and human users. Social media researchers have explored the information diffusion and human-computer interaction behaviors involving bots in various event scenarios. Bot detection techniques and recognition methods have been iterated to support and inform the classification of social bots and human users [14]. After distinguishing social bots and human users, we conducted a correlation analysis for the emergent event-related dataset. First, we conducted text analysis on the contents of posts under emergencies and compared whether bot users and human users differed in behavioral characteristics during the dissemination of information. Second, we used social network analysis methods to construct the propagation network of posts in social networks, and further compared the attributes and features in the networks constructed by social bots and human users. Finally, we further explored the effects of text features on information dissemination behavior using multi-factor ANOVA and compared the differences in the effects between bot users and human users. Because the group behavior of social bots is uncertain and difficult to measure and control accurately through experiments and questionnaires, this study will verify the differential influence mechanism between social bots and human users through individual user behavior data in real social media scenarios.
The structure of the remaining part of the article is shown below. In the second section, we review the related research on social bots and introduce the concept, characteristics, and influence of social bots. In the third section, we introduce the research methodology and operationalization of this paper, including topic modeling, sentiment analysis, and social network analysis methods used. In the fourth section, we conduct a comparative analysis of social bots and human users, and present our findings. In the fifth section, we present the discussion and conclusions of this paper, and present the shortcomings of the current study, as well as the outlook for future research.
2 Related Work
2.1 Concept and Behavioral Characteristics of Social Bots
Social bots are computer algorithms in social media that automatically generate content and interact with humans in an attempt to mimic and possibly change them (15). As code-built computer programs, social bots manipulate social accounts, post tweets in social media, and enable interactive communication with other social media users with the help of artificial intelligence and other technologies [15]. As the popularity of social media has increased, programs controlling the social bot to mimic human behavior have been able to grow in social media platforms [16]. With different penetration strategies, social bots form interactions in human users to influence or even change their behavior [17]. At the same time, related studies have found a tendency for humans to extend real-life psychological dynamics to artificial entities [18]. For example, one researcher analyzed the ability of humans to distinguish between political social bots and humans on Twitter and found that users with disagreement were often assessed as more bot-like than users with the agreement [19]. It has also been found that the overall engagement of users’ social networks predicts interactions and responses with social bots, the number of friends and followers predicts whether users will interact with bots [20]. This also confirms the existence of different clusters of bots in the interactive network of Twitter, that a significant proportion of users are systematically exposed to bot-generated content and interact with bots, and that the symbiotic dynamics between human and bot users are presented on social media [21].
The behavioral characteristics of social bots are manifested in three main aspects. First, one of the most obvious behavioral characteristics is the imitation of human behavior by social bots. In social media, social bots imitate human users to retweet and collect information, and establish false interactions through the number of followers and fans, thus achieving misleading human users and influencing the behavior of other users [22]. Related studies have also found that social bots can post relevant content based on the recognition of popular discourse keywords and thus achieve mimicry of human behavior [17]. And this imitation behavior is also reflected in the public opinion of unexpected events. When an unexpected event occurs, a large number of social bots imitate real users and occupy an important position in public opinion after the event [23]. Second, social bots play an important role in the process of information dissemination. Social bots achieve the amplification of opinions or information and promote the diffusion of information by repeatedly copying and forwarding relevant information on a large scale [24]. In the case of emergencies, social bots may either release a large amount of false information and rumors to increase the public’s negative emotions and form a negative effect in information diffusion [25], or they may awaken the public’s risk awareness by releasing event-related information to play a positive effect in information diffusion [26]. Finally, important behavioral characteristics of social bots are also reflected in the interaction process with human users. In social media platforms, social bots interact and engage with human users not only in their daily lives, but also in the discussion of topics and emotional support [27, 28]. The interpersonal communication capabilities of social bots can even increase the social presence of human users more than human-to-human interactions and activities [29]. However, interaction with social bots may also mislead human behavior and even cause negative problems such as privacy leakage [30].
2.2 Social Bots and Public Opinion Research
Social bots also play an important role in public opinion analysis. Usually, related studies define the propaganda or communication method using technical means such as social bots as computational propaganda [31]. Compared with traditional information dissemination methods, information under computational propaganda achieves a larger scale and scope through a more covert, precise and automated form [32]. And with the support and help of algorithms such as social bots and botnets, computational propaganda facilitates the spread of fake news and misinformation in social media. At the same time, the interactive nature of social networks and the automaticity of account creation and management allow computational propaganda to customize different social bots to personalize the propaganda approach to users and form new forms of public opinion [33]. In addition to public opinion applications for calculating propaganda, social bots can also play a role in analyzing users’ opinions and network structures. For example, neutral bot users are deployed on social media platforms to investigate users’ political biases [34]. Meanwhile, the endogenous structure of filter bubbles in social networks can be further explored by analyzing the text content received by bots on social media [35].
In the public opinion caused by emergencies, social bots play an important role in generating fake traffic, guiding opinions, and establishing fake social relationships. For example, in an analysis targeting social security events, it was found that social bots amplify the impact of emergencies and human users contribute to the dissemination of bot-generated content. Also, studies have found that social bots influence human behavior by promoting the spread of disinformation in social media through diverse information strategies such as sharing and retweeting [36]. In the analysis of natural disasters, it was found that social bot users were able to form larger, more discrete, and hierarchical communication networks than human users. At the same time, this allows for more rapid reposting and diffusion of false news and ambiguous information spread by social bots on social media [37]. Similarly, in the analysis of public health events, social bots influence opinion trends based on a certain viewpoint by automatically posting a large number of messages, which in turn influence human behavior. At the same time, the retweeting and sharing behavior of social bots makes human users who hold the same opinion more obstinate and difficult to accept information under a different point of view [38]. In summary, social bots may generate a large amount of false information and promote the spread of false information, distort normal human behavior and destabilize the social order in emergencies [39]. Therefore, comparing the behavioral differences and diffusion mechanisms between social bots and human users in the context of emergencies can make a proper contribution to the emergency management of emergencies.
2.3 Impact of Social Bots
Social bots mimic human behavior to occupy an important role in public opinion research and amplify their influence through social networks, which in turn change human opinions and behaviors. First, as previously described, social bots spread false news and rumors on social media through computational propaganda and other means, and further amplify the impact of false news and information [40]. For example, social bots were discovered to facilitate the rapid spread of disinformation through geographic disguise, interaction with influential users, etc. [41]. Second, social bots are often thought to manipulate and control social media opinion, an effect that has been extensively validated in the political sphere [42]. For example, during the 2016 US elections, some candidates used automated accounts or bots to increase their social media following and followers [43]. During the 2016 municipal elections in Rio de Janeiro, Twitter bots fabricated different supporter identities to match potential voters, making collective identities and views more homogenous [44]. It has also been argued that the degree of influence of bots depends on whether the bots provide information that is consistent with human a priori, and that the participation of Twitter bots has the potential to increase the polarization of politics, among others [45]. Finally, social bots can have an impact on public perception. Based on computational propaganda, social bots are able to automate the tailoring of information content to different users and thus distort public perceptions. For example, social bots are more likely to post hashtags about smoking cessation and new products than non-bots, causing the public to form relevant impressions [46]. Another example is the higher percentage of social bots posting a large number of posts indicating that marijuana can alleviate health concerns, which in turn has an impact on the public’s preconceptions [47].
However, some studies have also concluded that the impact of social bots is not significant, for example, one study found no signs of collective political strategies and minimal influence of identified social bots during the 2017 German state elections [48]. Another study has shown through an experiment of social bots intervening in political discussions on Twitter that bots had little impact on the discussion network and analyzed the role of capital [49]. Some researchers have pointed out that although the high level of intelligence of chatbots has been demonstrated and assumed to be the same for social bots, the observed level of intelligence achieved by social bots is limited [50]. In this paper, however, we will further verify the impact of social bots on information dissemination by studying public opinion during emergencies and compare in-depth the differences between the impact of social bots and human users on information dissemination.
3 Research Methodology
In this paper, we took the public opinion triggered by the epidemic event in X city, China, on Sina Weibo as our data source for the study of emergencies. First, the study classified users into two types of users, bot users and human users, based on user characteristics and content characteristics. Secondly, the text data was divided into different topic categories and sentiment categories, and the differences in behavioral characteristics between bot users and human users were compared. Also, the study further compared the differences in diffusion characteristics between posts made by bot users and human users using social network analysis methods. Finally, a multi-factor ANOVA was used to further investigate the differences in information dissemination between posts made by bot users and human users. Based on the comparison of the differences in behavioral characteristics and diffusion characteristics between bot users and human users, the study can make some contributions to the identification of bot users and emergency management of public opinion in emergencies.
3.1 Identification of Social Bots
As bot users who can publish and promote information dissemination on their own and interact with other users, social bots have been widely distributed on various social media platforms and play an important role in the dissemination of public opinion in emergencies [51]. Therefore, it is particularly important to identify bot users in social media and then compare the behavioral characteristics of bot users and human users in social networks and enable better public opinion management. For the identification of bot users on social media, research teams in different countries and regions have conducted studies by adopting different methods and detection tools, different criteria and thresholds, but the methods and criteria have not been unified [52]. Considering the data properties of social media, machine learning-based recognition methods and classification by purely metric features have been adopted by most social scientists in the identification of bot users [53, 54]. Machine learning algorithms first need to be trained based on obtaining classification labels with bot users and human users to improve the accuracy of user identification. After the training and testing of the implemented algorithms, feature-based algorithms are used to classify bot users and human users in the data. However, the highly dynamic nature of users on social media, the variability of their behavior, and the accuracy of the recognition features tend to make the method somewhat questionable [55]. Some rules-based metric approaches have been proposed, for example, one study treated users who post 50 tweets a day as highly automated, and users with bots in their account descriptions or hashtags as self-disclosure bots [53]. This single indicator approach is easy to interpret but tends to be oversimplified.
Existing studies have pointed out that social bot recognition is not an exact science, and different recognition methods will produce very different results [52], which will lead to difficult dialogue between the results obtained by different recognition algorithms. Moreover, the black box principle presented in the algorithmic tools represented by Botometer makes it difficult to know the specific details of the variables and the process of calculating the resultant scores. However, existing research on the characteristics of the bot has reached some consensus, for example, such as the total number of tweets and release frequency (bot show the continuous activity and too many tweets), forward than the proportion of the original tweet (bot forwarding content far more often than generating new tweets), pay attention to the fans and the proportion of (bots usually focus on the more and less number of fans) [39]. Therefore, the object of this study is “suspected” social bot users with bot characteristics, and a rule-based social bot recognition method is proposed.
In the process of identifying users with bot characteristics using user indicator features, the ratio of the number of followers and the number of fans of a user is one of the commonly used measures in the study [39]. Compared to normal users, social bots tend to follow a large number of normal users to gain benefits or to increase their influence [56]. Therefore, social bots are usually characterized by a high number of followers and a low number of fans. This result has also been confirmed in other studies that users with high follower counts are less likely to be bots [57]. Also, due to the ability of social bots to automate the posting of information, bot users tend to retweet and post a large number of tweets in social media to create their active status and use this to increase their influence on social media [58]. Therefore, the study implements the classification of bot users and regular users based on the number of followers and fans combined with the number of posts made by the users. The classification criteria are shown in Eq. 1.
Where,
Direct observations of the data help to understand which users the metric classifies as bots. Figure 1 shows some examples of the identification, where (a) and (b) were randomly selected from users with high bot scores, and (c) and (d) were randomly selected from users with low scores. User (a) followed 3,178 users and had no followers. He posted 203,530 posts and did not post any original posts. It’s highlighted that when we looked at the account, the user (a) was banned for violating community rules. User (b) is similar to the user (a), with a high number of followers and almost no fans. She posted 31,466 posts. Most microblogs of hers were reposted from a few fixed accounts. They are thought to be suspected forwarding bots. User (c) has 126 followers but does not follow any users. It is more likely that she is a human account because she has some original content and exposes her selfies in her microblogs. User (d) is unlikely to be a bot, as it is an authenticated user in the campus content domain.
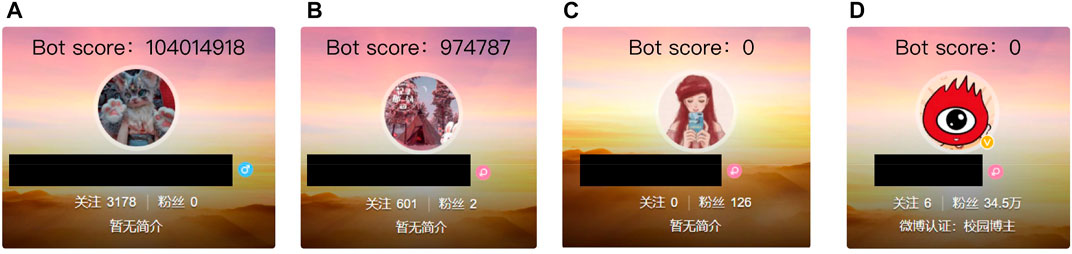
FIGURE 1. Examples of bot score.
3.2 Topic Modeling
In the field of natural language processing, topic modeling is used to analyze the semantic structure and topics of different text contents to achieve the classification of large-scale texts. Therefore, topic modeling is often used with the social media domain to extract meaningful information from social media data [59]. When an unexpected event occurs, the public expresses a large number of views and opinions with the help of social media to form an event-related public opinion. With the help of topic analysis, research can further analyze the evolution trend of public opinion and achieve more effective public opinion governance [60]. Among them, in the field of topic modeling, the LDA model and PLSA model have been widely used and are among the most commonly used topic modeling methods [61, 62]. However, compared with traditional models such as LDA, the topics discovered by Top2Vec have more advantages in terms of information quantity and representativeness, and they do not need to set the appropriate number of topics in advance, which can realize the automated querying of topics. Moreover, compared with traditional methods represented by LDA, the deep learning model represented by Top2Vec has better performance in the interpretability and applicability of topic modeling. Therefore, to achieve a more accurate topic classification of text, the study uses the newly proposed Top2Vec method for modeling text topics [63]. This method has shown better results in topic classification based on social media data [64].
As a distributed representation of the topic vector model, the Top2Vec model is obtained by computing the dense regions of the document vectors. The dense region is the region formed by the aggregation of similar documents. The number of topics into which the text is divided is determined by the number of dense regions in the semantic space. By calculating the centroids, i.e., the arithmetic mean of all document vectors in each dense region, we can obtain the topic vector, which is represented as the most representative average document in the region. After obtaining the topic vector, the study searches for a word vector that is closer to the topic vector to represent the topic formed by that dense region with the help of semantic embedding. The semantic similarity is represented by the distance between the word vectors [63].
Based on the Top2Vec model, the study used the following steps to achieve the classification of text topics. First, the study used the BERT model to learn the jointly embedded document vectors and word vectors. Based on the Transformer language model, BERT achieved the extraction of text features and the fusion of contextual semantics through an encoder-decoder structure [65]. Secondly, to find dense clusters of documents in the dimensionality reduction space more efficiently and accurately, the study used UMAP, a dimensionality reduction method based on the manifold learning technique [66]. The method consists of two main parts: graph construction and layout optimization. Among them, the former is represented by Eqs 2–4. As in Eq. 2, the similarity of high-dimensional data points in the model is calculated based on the exponential probability distribution. Where
After the construction of the high-dimensional graph was completed, UMAP further optimized the layout of the low-dimensional simulation graph to make the low-dimensional simulation graph and the high-dimensional graph as similar as possible. Among them, Eq. 5 represents the modeling distance of the low-dimensional based on the probability distribution similar to the Student t-distribution. Where, constants
Afterward, the model used HDBSCAN, a hierarchical density-based spatial clustering method to find dense regions of document vectors, by which the calculation of topic vectors is achieved [69]. The calculation formula is shown in Eq. 7. Where the mutual reachability distance is expressed by
3.3 Emotion Modeling
As one of the most dominant areas in natural language processing, sentiment analysis is widely used in the analysis of social media and online opinion. When an emergency event occurs, emergency managers can learn the emotional dynamics of most users and the emotional impact of user interactions through web analytics [72]. Traditional approaches to sentiment classification, such as support vector machines, require extensive feature engineering efforts and are often time-consuming and resource-intensive [73]. With the development of deep learning techniques, neural network models have proliferated and have shown better results in terms of accuracy and recognition efficiency. Among them, BERT (Bidirectional Encoder Representations from Transformers) has demonstrated better results in several tasks including sentence-level sentiment classification and is widely used in the field of sentiment analysis [74]. In this paper, we construct a sentiment classifier based on the BERT model to achieve the recognition of the sentiment embedded in social media data.
The main framework of the BERT model as an embedding layer consists of a multilayer transformer structure. Compared to traditional CNN and RNN networks, the BERT model can solve the long-term dependency problem common in existing models based on the ability to convert the distance between two words at any position to 1 [75]. Meanwhile, the BERT model is a multi-task model, which consists of two self-supervised tasks, MLM (Masked Language Model) and NSP (Next Sentence Prediction), in the pre-training phase. In the MLM task, 15% of the input data will be randomly Masked, while in the training process, after identifying the Mask-related words, 80% of the data will be replaced with Mask, 10% with other words, and 10% will remain in the original state. In the NSP task, two randomly selected consecutive sentences will be fed into the model, and the model will determine the relationship between the two sentences, i.e., whether they match the corresponding contextual relationship. After completing the pre-training model, the study only needs to fine-tune the model parameters to adopt the model for various tasks in the field of natural language processing [65]. Among them, the structure of the BERT model is shown in Figure 2.
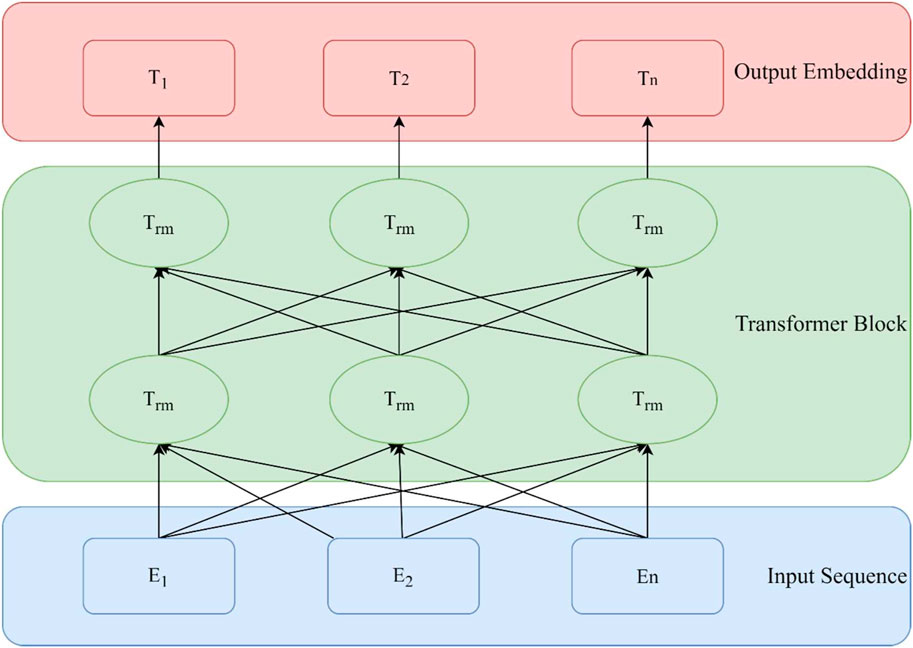
FIGURE 2. BERT model structure.
In our study, we used the BERT model to implement the computation of sequence embedding and to prevent overfitting and regularization by adjusting the dropout parameters during the training phase of the model. Finally, the softmax classification layer is used to classify the sentiment labels. The activation function of the softmax layer is calculated as follows. Where the number of output nodes, i.e., the number of categories to be classified, is denoted by
To train a sentiment classification model suitable for this research context, we fine-tune the BERT model using the dataset of Internet users’ sentiment during the epidemic released by Beijing Municipal Government Data Resources (data.beijing.gov.cn). The dataset contains 100,000 sentiment-tagged tweets about COVID-19 from 1 January 2020, to 20 February 2020. The emotion tagging is divided into three categories, respectively is 1 (positive), 0 (neutral), and −1 (negative). By fine-tuning the BERT model, the accuracy of the model on the test set was 0.74, the recall rate was 0.73, and the F1 value was 0.69. The performance of the emotion classification model meets the needs of this study. Causing the regional epidemic data used in this study may be simpler than the training data, we randomly selected and manually coded 100 microblogs from the research data for verification. The prediction accuracy was 0.83, the recall rate was 0.80, and the F1 value was 0.82. In previous studies, the accuracy of the three-category emotion classification model was about 0.80 [77] In this paper, the purpose of establishing the emotion classification model was not to optimize the model but to apply it. This emotion classification model can accurately predict the sentiment of most microblogs, which meets the needs of this study.
3.4 Social Network Analysis Methods
As an effective method to study group relations, social structure and interaction behavior, social network analysis (SNA) has been applied in many research fields [78]. In addition, social network analysis methods often construct network maps by presenting the relationships between actors to achieve visualization. In the visual network atlas, actors are often described as nodes, and the relationships between actors are defined as edges with goals. With the help of the network atlas, we can observe the status difference of nodes in social networks, namely important actors and isolated actors. At the same time, research can also understand the structural differences of groups with different attributes in the network [79]. In this paper, based on the social media data under emergencies, the spread graph of information published by different user attributes in social networks was studied and drawn, and the difference in the spread of information published by bot users and human users was compared.
In addition, several network attributes were selected to further compare the differences in the diffusion characteristics of information published by bot users and human users. First, average-degree centrality was selected to measure the number of direct connections between users and other users in social networks. The calculation formula of degree centrality is shown in Eq. 9; [80]. Where
4 Results
4.1 Data Collection and Preprocessing
To compare the behavior differences between bot users and human users in public opinion caused by emergencies, the COVID-19 outbreak in X city of China was selected as the research object. On the one hand, the public health emergency broke out in December 2021 and ended in January 2022, reflecting the latest trends in public opinion. On the other hand, to prevent the further spread of the epidemic, X city with a population of ten million took lockdown measures due to this event, which had a huge influence on all levels of society and has rich public opinion data. Therefore, the study selected the public data of the epidemic events in X city as the data source, and obtained relevant data from Sina Weibo (one of the largest social media platforms in China) by limiting time and searching keywords. Based on the advanced keyword search function of Weibo, the study takes “epidemic situation in X city” as the search keyword, and captures relevant microblog data from 13 December 2021, to 1 January 2022. In addition, after obtaining the relevant data, a series of methods such as filtering invalid information, word segmentation, and removing stop words were used to preprocess the data. Finally, 237,342 valid posts were obtained.
4.2 Behavioral Differences in Topic Types
In this study, the Top2Vec model was used to cluster topics under the public opinion of emergencies. To achieve better classification results, topics were divided into 10 categories. The clustering results of topics are shown in Table 1. As can be seen from Table 1, the public opinions caused by public health emergencies selected by the research mainly fall into four categories. For example, topics 2 and 7 reflected the public’s prayers and wishes for an end to the epidemic. Topics 3 and 9 reflected the response to COVID-19 at all levels of society during the outbreak. Topics 4, 8, and 10 reflected the problems and negative impacts of COVID-19 management. Topics 5 and 6 reflected the content of events during the epidemic and the public response to the epidemic information. Topic 1 was about the posts forwarded by the public during the COVID-19 outbreak, which only contained emoticons and words without substance. The results also proved that in the transmission process of emergencies, the number of forwarded microblogs without substance was the largest, which constituted a forwarding network in the process of emergencies and promoted the spread of all kinds of event-related information in social networks.

TABLE 1. Topic classification of information published by bot users and human users.
In addition, Table 1 also reflects the distribution of bot and human users on various topics. Table 1 shows that posts made by bot users account for about 10% of all posts, ranging from 9 to 15%, which is consistent with existing studies (8). At the same time, the differences between posts posted by bot users and human users were explored by the Chi-square test, and the results showed that there were significant differences in topic distribution between bot users and human users (p < 0.001). Among them, the posts published by bot users were mainly distributed on topics 1, 4, 6, and 7. Firstly, the study found that the majority of posts were forwarded by bot users on Weibo. Considering that topic 1 was mostly forwarded without substance, this may be consistent with the ability of bot users to automatically publish information. Secondly, posts published by bot users also had more distribution in topic 4 and topic 7. Combined with the text, this may be due to the high impact of topics four and seven, which have received wide public attention during the COVID-19 pandemic. Bot users posted relevant information on such topics to increase their influence. Finally, Bot users also posted a lot of content related to topic six. Topic 6 was a controversial topic during the COVID-19 pandemic, which could arouse all kinds of emotions of the public. It was easier for bot users to get attention and interaction from other users if they posted posts related to this topic. The posts that human users were concerned about mainly focus on topics 1, 3, 4, and 8, mainly involving social response to the epidemic, problems in the process of governance, and the impact of the epidemic. Compared with human users, bot users tended to post more controversial and influential topics. Posts published by human users covered a wider range of content, and paid more attention to the governance and response of emergencies and their impact on life.
4.3 Behavioral Differences in Sentiment Types
In this study, the BERT model was used to analyze the sentiment of text data, and then the differences in the sentiments of posts made by bot users and human users were compared. Based on the obtained data, the study tested the sentiments of posts published by different users by the Chi-square test, and the results showed that there were significant differences in the sentiments of posts published by bot users and human users (p < 0.001). At the same time, as shown in Figure 3, the sentiment distribution map of posts published by different users was also drawn. Among them, the user’s gender is the public information of personal data. User types such as government, celebrities, and media are authenticated by Weibo with identifiable marks to distinguish them. All the relevant information is public, and the crawler is used to obtain the data.
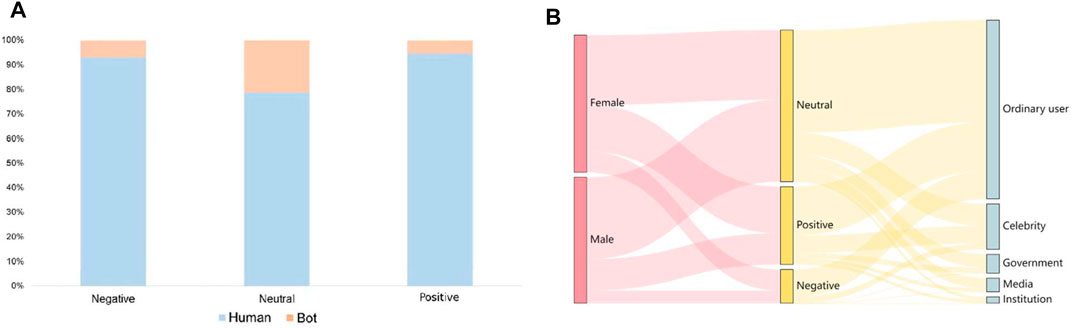
FIGURE 3. Sentiment distribution of bot users and human users. (A) Sentiment distribution of posts published by bot users and human users. Sentiment types are represented on the horizontal axis, while the vertical axis shows the percentage distribution of the number of posts by bot users and human users in different sentiments. (B) Sentiment distribution of user gender and user types. The distribution of gender, sentiment, and user type is shown on three vertical axes.
As can be seen from Figure 2A, among the distribution of sentiments, neutral sentiment is distributed in large numbers among bot users and human users. Combined with text materials, the public sentiment caused by public health emergencies, including media users, celebrities, and institutional users, tended to release factual information with neutral sentiment. Relevant information would also be forwarded by different users to achieve information diffusion, and relevant content is also reflected in Figure 2B. Meanwhile, Figure 2B also reflects that in the distribution of neutral sentiment, the proportion of male users (65.09%) is higher than that of female users (50.74%). A higher percentage of female users posted emotional posts during the public health emergency.
Secondly, it can be seen from Figure 2A that the number of posts containing positive sentiment of both bot users and human users is more than that of posts containing negative sentiment. This finding was also validated for user gender and user types. As shown in Figure 2B, for both male users (24.82% > 10.09%) and female (33.99% > 15.27%), the number of posts containing positive sentiment was much larger than that of posts containing negative sentiment. At the same time, Figure 2B also reflects that ordinary users (27.33% > 15.40%), celebrity (38.14% > 13.06%), government (28.47% > 0.39%), media (46.83% > 1.01%), and institution (24.46% > 0.41%), the number of posts containing positive sentiment is more than the number of posts containing negative sentiment. Especially, the difference was more pronounced among authoritative users such as government, media, and institution.
In addition, there were differences with human users. Among the posts made by bot users, the number of posts containing positive sentiment was close to that containing negative sentiment. It was because bot users aimed to increase their influence, and sentiments were not the primary prerequisite for posting information. But that doesn’t mean we don’t need to be wary of social bots. Of course, the positive information released by social bots can help regulate group emotions and maintain the stability of network order. However, taking the public health emergency as an example, the number of posts containing negative sentiment published by bot users on social media was close to that of posts containing positive sentiment. By publishing posts containing negative sentiment, bot users can guide the negative sentiment of the public, bringing challenges to public opinion management under emergencies. For human users, the number of posts containing positive sentiment was far greater than that of posts containing negative sentiment. Relevant findings are also consistent with existing studies, that is, when an emergency occurs, the public is more inclined to publish and forward posts containing positive sentiment, to encourage themselves and comfort others [83].
4.4 Social Networking and Diffusion Trend
Based on the multi-stage forwarding data obtained under the public health emergency, the social network analysis method was used to draw the communication map of public opinion information in social networks, to further compare the diffusion trend of information published by bot users and human users in social networks. First of all, the study drew the degree distribution of bot users and human users in social networks, to more intuitively compare the role of bot users and human users in information diffusion. The degree distribution is shown in Figure 4. Figure 4A shows the degree distribution of all users. It was found that in the information diffusion network caused by emergencies, the degree centrality of most users was very low, and more users existed as information recipients. Only by a small number of users with a high degree, and as an important medium for information sharing. Figure 4B,C respectively show the degree distribution of human users and bot users. The study found that both human users and bot users have the characteristic of opposite direction in degree distribution and frequency. The difference was that the number of bot users was smaller and the degree distribution was sparser.
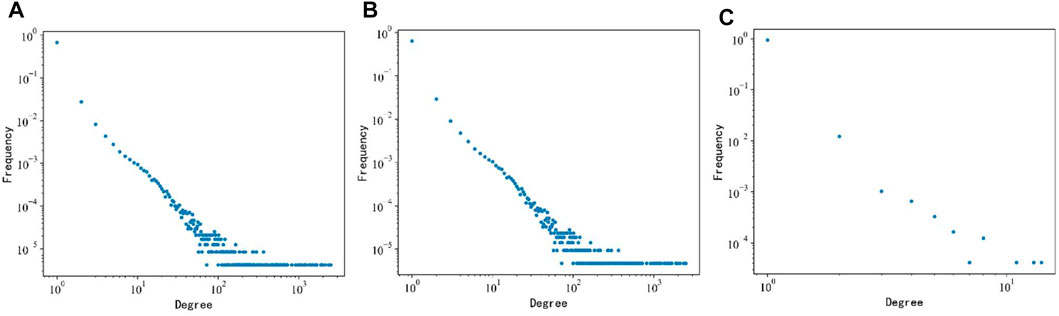
FIGURE 4. Degree distribution in social networks. In the figure, the horizontal axis is the degree centrality, and the vertical axis is the number of node users on the same degree distribution. (A) Degree distribution of all users. (B) Degree distribution of human users. (C) Degree distribution of bot users.
Considering the excessive number of nodes, this study conducted filtering according to degree centrality to build a communication map in social networks. The communication map is shown in Figure 5. When the degree centrality of screening is low, the number of core nodes is large, and it is difficult to draw a visual network map. However, when the degree centrality is high, the number of core nodes is small, which makes it difficult to present the integrity of the social network. Therefore, combined with the distribution of degree centrality in social networks, the study has made several attempts to develop appropriate screening criteria to maximize the completeness of network graphs. At the same time, considering the robustness of the research results, we draw the whole network graphs when the degree centrality is greater than or equal to 5 and greater than or equal to 7 respectively, to show the diffusion trend of information in social networks more comprehensively. The node size was measured by the PageRank index.
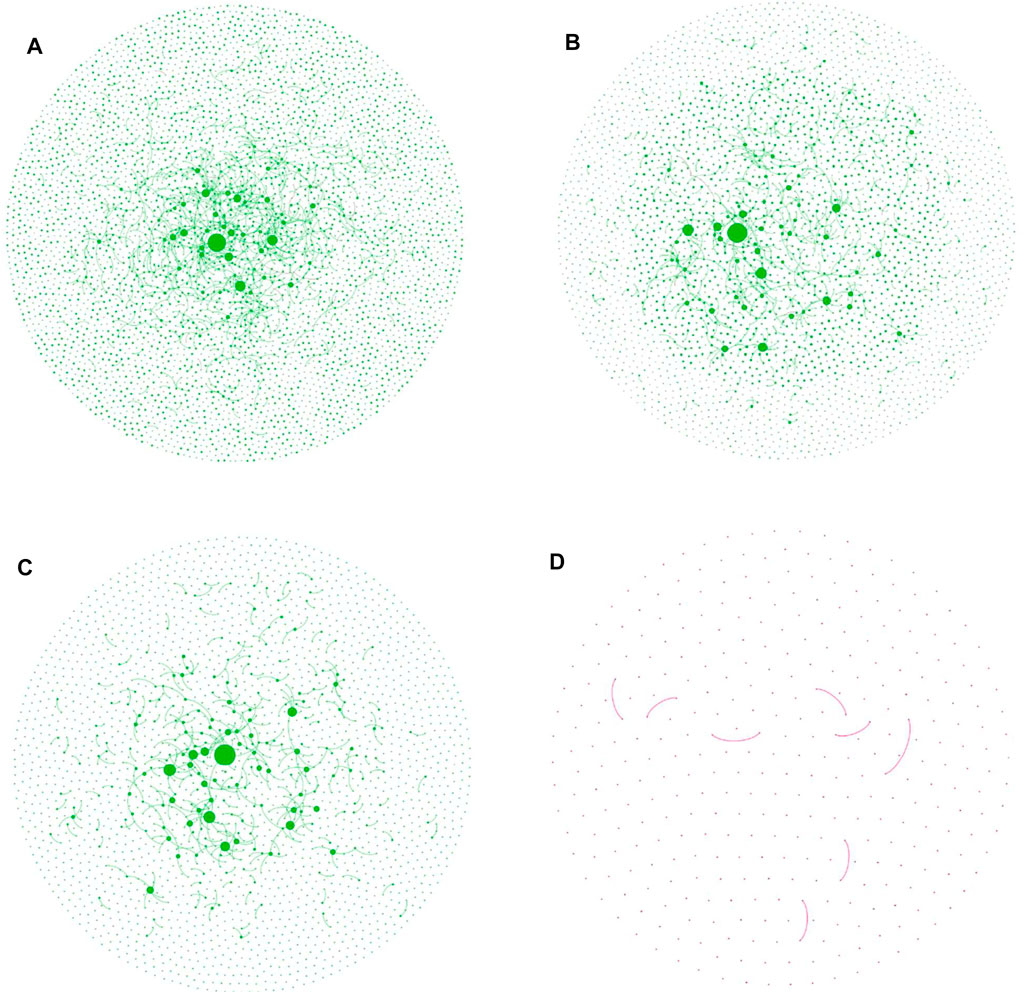
FIGURE 5. Information diffusion in social networks. (A) Full network graph. The network graph consists of bot users and human users, and the screening criterion is degree centrality greater than or equal to 5. (B) Full network graph. Degree centrality is greater than or equal to 7. (C) Human network graph. The network diagram is made up only of human users, and the degree centrality is greater than or equal to 10. (D) Bot network graph. The network diagram is made up only of bot users, and the degree centrality is greater than or equal to 2.
As shown in Figures 5A,B, it is found that in the communication network of information in social networks, most nodes with high centrality are human users, while bot users are few. This finding indicated that although bot users played an important role on social media and promoted the spread and diffusion of information, information published by human users still dominated the spread of public opinion caused by emergencies. Figure 5C,D respectively show the network graphs composed only by human users or bot users in the process of public opinion dissemination. The results showed that in the process of information diffusion, the forwarding network formed between human users had a higher focus, while the forwarding network formed by bot users was more discrete.
In addition, we further compared whether there were differences in network attributes between human users and bot users in communication networks. The results are shown in Table 2. Degree centrality reflected the number of direct connections between user nodes in the network. The independent sample t-test was used to test the degree centrality of human users and bot users. The results showed that there were significant differences in degree centrality between bot users and human users (p < 0.001). It can be seen from Table 2 that the average degree centrality of human users is greater than that of bot users. As a result, human users were more connected to other users in social networks. Betweenness centrality reflected the ability of users to control resources in social networks. The independent sample t-test was used to test the betweenness centrality of bot users and human users, and the results showed that there were significant differences in the betweenness centrality of bot users and human users (p < 0.001). It can be seen from Table 2 that the average betweenness centrality of human users is higher than that of bot users, and human users have a stronger ability to control resources in social networks. PageRank Index was different from the Index of centrality, indicating the user’s position in the entire network (82). The independent sample t-test was used to test the PageRank Index of bot users and human users, and the results showed that there were significant differences in PageRank Index between bot users and human users (p < 0.001). As can be seen from Table 2, the PageRank Index of human users in social networks is larger than that of bot users, with higher deviation and more discrete distribution.
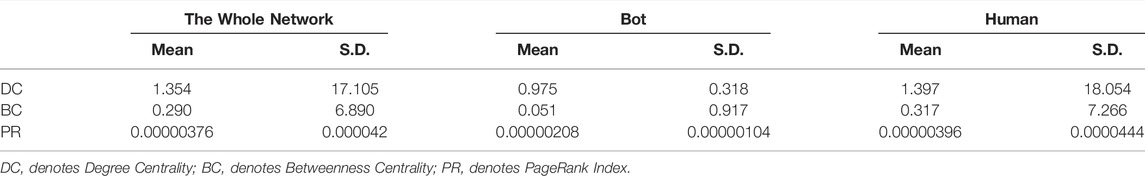
TABLE 2. Network dissemination differences of information published by bot users and human users.
4.5 Difference Analysis of Social Interaction
To analyze whether there were differences in information transmission between posts published by bot users and human users, the research not only analyzed the content published by social media users, but also further compared the differences in the number of forwarding, comments and likes between posts published by bot users and human users. The analysis results are shown in Table 3. First, the study found that posts by human users in social networks had a higher average number of likes, comments, and forwarding than posts by bot users. A single post published by a human user received 20.134 likes, 3.221 comments, and 1.668 forwarding on average, while a single post by a social bot received 0.188 likes, 0.079 comments, and 0.036 forwarding on average. This also reflected that compared with the likes and comments, the diffusion of forwarding was a more in-depth participation behavior, so the number was smaller. Compared with the information released by human beings, the information released by bots was more difficult to spread in the network. Therefore, although bot users occupy an important position in the dissemination of public opinion under emergencies and have a significant impact on the diffusion of information, human users are always a major role in opinion analysis.
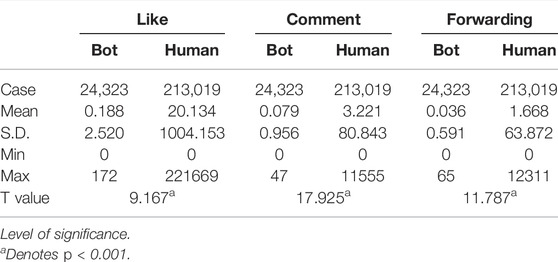
TABLE 3. Social interaction differences between the posts published by bot users and human users.
Secondly, the independent sample t-test was used to compare the differences in social interactions between bot users and human users. The results showed that there were significant differences in social interactions between bot users and human users. The research results also proved that in the process of public opinion dissemination, the bot users on social media play the role of followers and disseminators rather than manufacturers, to promote the further diffusion of information. In addition, although the t-test results showed that the bot users in the role of network public opinion, the influence of the bot was not the only obstacle to its behavior patterns, also was limited by a variety of factors, such as user types, number of fans. As a result, the difference in information transmission ability between bot users and human users needs to be tested through further analysis.
To further explore the influence of bot users and human users on the spread of information in social networks, this study used multivariate analysis of variance to compare the difference in the number of posts published by bot users and human users based on controlling a series of variables. The analysis results are shown in Table 4. Among them, variables such as user gender, user types and the number of fans had a significant impact on information transmission, which need to be included in the model analysis to reduce the impact of confounding factors and improve the accuracy of the analysis. The results of model 1 showed that the topic type (F = 14.73, p < 0.001), bot users or human users (F = 9.74, p < 0.01), and the interaction terms (F = 2.05, p < 0.05) all had significant influence on information transmission. The results of model 2 showed that the sentiment type (F = 49.68, p < 0.001), bot users or human users (F = 42.75, p < 0.001), and the interaction terms (F = 3.67, p < 0.05) also had significant influence on information transmission. The results confirmed the difference in the spread of posts by bots and human users in social networks.
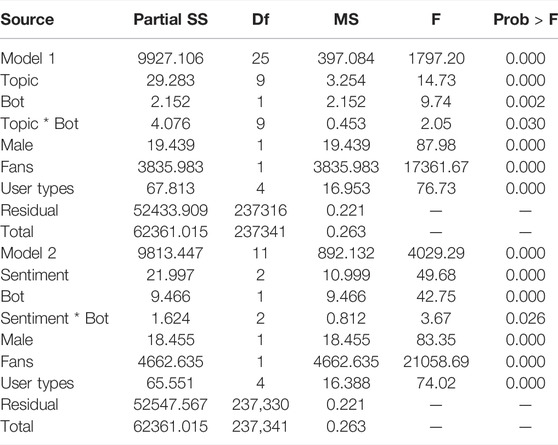
TABLE 4. Influence of bot users and human users on information diffusion in social networks.
Dependent variable is the logarithm of the forwarding number plus one; Bot variable is a binary variable, with 0 representing human users and 1 representing bot users; Among the control variables, the male variable is a dichotomous variable, with 0 representing female and 1 representing male. Fans variable is the logarithm of the original variable plus one. User types variable is a multi-classification variable, representing ordinary users, celebrities, governments, institutions and enterprises, and media respectively.
In addition, the moderating effect map was drawn to analyze the spread and distribution of information in social networks when the users are bot users and human users respectively, to further compare the specific differences in the spread of posts published by bot users and human users. The results of the moderating effect are shown in Figure 4. Relevant findings were different from t-test results, which further confirmed the importance of variables such as user gender, user types, and the number of fans in the process of information dissemination.
Among them, Figure 6A shows the difference in the spread of posts under different topics by bot users and human users on social media. The results showed that posts by bot users had more obvious advantages in implication topics 1, 2, 4, 7, and 9. Combined with text materials, the messages of blessing and controversy posted by bot users were more likely to be forwarded by other users. It was because relevant information can more easily arouse public emotions, attract public attention and interaction. In addition, controversial topics were more likely to cause confrontation between users and can improve the influence of the topic itself. Information published by human users with topics 3 and 5 had a more obvious advantage in communication. Combined with text materials, governance information and factual information under the epidemic situation posted by human users were more likely to be forwarded by other users in social networks. It was mainly because when it came to factual and governance-related information, the public was more likely to trust and forward the information published by authoritative users such as government agencies and news media. In topics 6, 8, and 10, posts published by bot users and human users were similar in the spread of social networks, with little difference. The results confirmed that bot users were better at attracting public attention and increasing their influence by publishing posts on specific topics. When facing the network public opinion caused by emergencies, the bot users are associated with specific topic information, to control the negative impact of bot users and stimulate the positive impact, which can further guide and dredge the network public opinion.
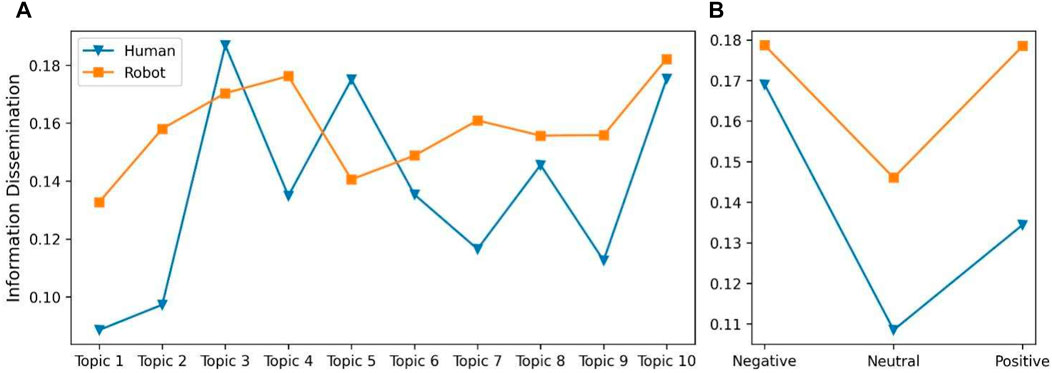
FIGURE 6. Distribution of posts published by bot users and human users in social networks. (A) Dissemination of information under topic types. The horizontal axis represents different topic types, and the vertical axis represents the dissemination of information posted by bot users and human users in social networks. (B) Dissemination of information under sentiment types. The horizontal axis represents emotion type and the vertical axis represents information transmission trend.
Figure 6B shows the spread differences of posts containing different sentiments published by bot users and human users in social networks. The results showed that posts with different sentiments from bot users were more easily spread on social media than those from human users. Especially, the difference was more pronounced for posts with positive sentiments. The finding confirmed that bot users in social networks had high emotional mobilization. Even though the number of bot users was less than that of human users in the process of public opinion dissemination caused by emergencies, bot users were more likely to mobilize public emotions and create a collective emotional atmosphere, making public opinion management of emergencies more difficult to manage.
5 Discussion and Conclusion
In this paper, the public health emergency was taken as the research object to explore the differential impact of bot users and human users on public opinion dissemination. First, based on the existing research, we used the user feature to achieve the classification of users with bot characteristics and normal users. Secondly, the study compared the differences in behavioral characteristics between bot users and human users in social networks and further explained the results of differentiation. Finally, the study further explored whether there were differences in the diffusion mechanism of posts published by bot users and human users in social networks in the spread of public opinion under the COVID-19 pandemic, as well as the specific embodiment of the differences.
Before comparing the differences in behavioral characteristics, the research firstly used the deep learning method represented by Top2Vec and BERT to extract information attributes such as topic and sentiment of posts. Second, the study compared the differences in the topic content of posts published by bot users and human users. The study found that bot users tended to use high-impact topics and controversial words to increase their influence in social networks. Human users tended to be broader and more focused on governance efforts and the impact of emergencies during the COVID-19 pandemic. Finally, the study also compared the emotional distribution of posts published by bot users and human users. The study found that both bot users and human users were more likely to post positive sentiment during the outbreak of public health emergencies. And this finding was even more pronounced with human users. Relevant findings can help emergency management personnel guide public discussion topics, alleviate negative public sentiment, and better realize emergency management of emergencies.
In the comparison of diffusion mechanism, the study firstly drew the diffusion graph of information published by bot users and human users in social networks by combining the social network analysis method. It was found that although social bot users played an important role in information diffusion, human users in social networks still played a dominant role in information dissemination. Moreover, social networks based on human users were more aggregative than networks formed by more discrete bot users. Secondly, the research used degree centrality, betweenness centrality, and PageRank index to further compare the differences in network attributes between bot users and human users in the same information transmission network. It was found that there were significant differences between bot users and human users in network attributes. Human users had a stronger ability to directly contact and control resources, but they were more discrete in the distribution of the PageRank index and had a higher bias. Finally, the study compared the differences in social interaction between posts published by bot users and human users and further explored the influence of bot users and human users on information diffusion in social networks. The results confirmed that there were significant differences in the impact of bot users and human users on information transmission. On the one hand, the study found that bot users had a high influence on specific topics, and by posting specific topics, they had a greater influence on information dissemination than human users. On the other hand, the research also found that bot users had higher emotional mobilization, and the posts containing sentiments published by bot users were more likely to be forwarded by other users than human users, promoting the further dissemination of information. In particular, the difference between bot users and human users was more obvious in the transmission process of posts containing positive emotional information. Relevant findings have proved the diffusion mechanism of posts published by bot users and human users in social networks during emergencies, which was more conducive to the processing of false information and rumors. In addition, it can guide the diffusion of positive sentiment in social networks, reduce the network mass incidents caused by negative public sentiment, and better realize the maintenance of network order and the management of emergencies.
Compared with existing studies on social media behaviors, the contributions of our study are mainly as follows. First, the study not only obtained the event information but also obtained the user’s personal information according to the user tags in the event. Based on the characteristics of users’ attributes, we distinguished bot users from human users and explored the relationship between user attributes and information transmission. Secondly, we compared the behavioral characteristics and diffusion mechanism of bot users and human users from the cognitive dimension and emotional dimension. Specifically, we used the latest deep learning model to identify different topics and sentiments from text content and used the network analysis method to compare the differences in network characteristics between bot users and human users. Compared with the research on social media behavior from a certain aspect, our methods are more diverse and can analyze the behavior differences between bot users and human users in a more comprehensive way. Finally, existing studies are more descriptive than causal in analyzing social media behaviors. Based on the text features extracted from the deep learning model, this study further compared the differences in information transmission between posts published by bot users and human users through a multivariate analysis of variance. These findings can more comprehensively explain the differences between bot users and human users on social media behaviors, which is also a better supplement to social media behavior research.
This paper compared the differences in behavior characteristics and diffusion mechanism between bot users and human users in the context of emergencies, but there are still some deficiencies in the research. First, the black box problem in machine learning makes it difficult for us to understand the specific processing process, which requires us to continuously adopt more effective methods to improve the accuracy of variable classification. Second, the limitations of social media data make it difficult to obtain more specific data on web users, such as educational background and occupational category. In future research, we expect to achieve more control variables to reduce the influence of confounding factors. Finally, it is still difficult to determine whether the differences in behavioral characteristics and diffusion mechanisms between bot users and human users also exist in other types of emergencies. It is also the direction of our further research.
Data Availability Statement
The raw data supporting the conclusions of this article will be made available by the authors, without undue reservation.
Author Contributions
MC and HL conceived the study and designed the research framework. HL and XM designed the research method and conducted relevant analysis, MC, HL, XM, and YC wrote the article. All authors have read and agreed to the published version of the manuscript.
Funding
This research was funded by the National Natural Science Foundation of China under Grant No. 71501153, the Innovation Capability Support Project of Shaanxi Province of China under Grant No. 2021KRM135, the Research Fund of Grand Theory and Practical Problem in Philosophy and Social Science of Shaanxi Province of China under Grant No. 2021ND0221, and the Research Fund of the Education Department of Shaanxi Province of China under Grant No. 20JG020.
Conflict of Interest
The authors declare that the research was conducted in the absence of any commercial or financial relationships that could be construed as a potential conflict of interest.
Publisher’s Note
All claims expressed in this article are solely those of the authors and do not necessarily represent those of their affiliated organizations, or those of the publisher, the editors and the reviewers. Any product that may be evaluated in this article, or claim that may be made by its manufacturer, is not guaranteed or endorsed by the publisher.
References
1. Zhang Z, Gupta BB. Social Media Security and Trustworthiness: Overview and New Direction. Future Generation Comput Syst (2018) 86:914–25. doi:10.1016/j.future.2016.10.007
2. Bennett WL, Iyengar S. A New Era of Minimal Effects? the Changing Foundations of Political Communication. J Commun (2008) 58(4):707–31. doi:10.1111/j.1460-2466.2008.00410.x
3. Sasaki Y, Kawai D, Kitamura S. Unfriend or Ignore Tweets?: A Time Series Analysis on Japanese Twitter Users Suffering from Information Overload. Comput Hum Behav (2016) 64:914–22. doi:10.1016/j.chb.2016.07.059
4. Bastick Z. Would You Notice if Fake News Changed Your Behavior? an Experiment on the Unconscious Effects of Disinformation. Comput Hum Behav (2021) 116:106633. doi:10.1016/j.chb.2020.106633
5. Maier C, Laumer S, Eckhardt A, Weitzel T. When Social Networking Turns to Social Overload: Explaining the Stress, Emotional Exhaustion, and Quitting Behavior from Social Network Sites'users. In: Proceedings of the 20th European Conference on Information Systems; June 2012; Barcelona, Spain (2012). p. 71.
6. Wang W, Chen X, Jiang S, Wang H, Yin M, Wang P. Exploring the Construction and Infiltration Strategies of Social Bots in Sina Microblog. Sci Rep (2020) 10(1):1–19. doi:10.1038/s41598-020-76814-8
7. Wojcik S, Messing S, Smith A, Rainie L, Hitlin P. Bots in the Twittersphere (2018). [cited 2022 10 Feb]. Available at: http://www.pewinternet.org/2018/04/09/bots-in-the-twittersphere/. Accessed February 10, 2022.
8. Varol O, Ferrara E, Davis C, Menczer F, Flammini A. Online Human-Bot Interactions: Detection, Estimation, and Characterization. Proc Int AAAI Conf web Soc media (2017) 11(1):280–9. doi:10.48550/arXiv.1703.03107
9. Daniel F, Cappiello C, Benatallah B. Bots Acting like Humans: Understanding and Preventing Harm. IEEE Internet Comput (2019) 23(2):40–9. doi:10.1109/MIC.2019.2893137
10. Tang L, Bie B, Zhi D. Tweeting about Measles during Stages of an Outbreak: A Semantic Network Approach to the Framing of an Emerging Infectious Disease. Am J Infect Control (2018) 46(12):1375–80. doi:10.1016/j.ajic.2018.05.019
11. Reuter C, Kaufhold M-A, Steinfort R. Rumors, Fake News and Social Bots in Conflicts and Emergencies: Towards a Model for Believability in Social Media. In: Proceedings of the 14th ISCRAM Conference; May 2017; Albi, France (2017). p. 583–91.
12. Howard PN, Kollanyi B, Bradshaw S, Neudert L-M. Social Media, News and Political Information during the Us Election: Was Polarizing Content Concentrated in Swing States? arXiv (2018). arXiv preprint arXiv:180203573. doi:10.48550/arXiv.1802.03573
13. Boichak O, Hemsley J, Jackson S, Tromble R, Tanupabrungsun S. Not the Bots You Are Looking for: Patterns and Effects of Orchestrated Interventions in the Us and German Elections. Int J Commun (2021) 15:26.
14. Sayyadiharikandeh M, Varol O, Yang K-C, Flammini A, Menczer F. Detection of Novel Social Bots by Ensembles of Specialized Classifiers. In: Proceedings of the 29th ACM International Conference on Information & Knowledge Management; October 19 - 23, 2020; Ireland (2020). p. 2725–32. doi:10.1145/3340531.3412698
15. Ferrara E, Varol O, Davis C, Menczer F, Flammini A. The Rise of Social Bots. Commun ACM (2016) 59(7):96–104. doi:10.1145/2818717
16. Appling DS, Briscoe EJ. The Perception of Social Bots by Human and Machine. In: Proceedings of the Thirtieth International Flairs Conference; May 2017; Marco Island, Florida (2017). p. 20–5.
17. Freitas C, Benevenuto F, Ghosh S, Veloso A. Reverse Engineering Socialbot Infiltration Strategies in Twitter. In: Proceedings of the 2015 IEEE/ACM International Conference on Advances in Social Networks Analysis and Mining (ASONAM); August 2015; Paris, France (2015). p. 25–32. doi:10.1145/2808797.2809292
18. Russo PA, Duradoni M, Guazzini A. How Self-Perceived Reputation Affects Fairness towards Humans and Artificial Intelligence. Comput Hum Behav (2021) 124:106920. doi:10.1016/j.chb.2021.106920
19. Wischnewski M, Bernemann R, Ngo T, Krämer N. Disagree? You Must Be a Bot! How Beliefs Shape Twitter Profile Perceptions. In: Proceedings of the 2021 CHI Conference on Human Factors in Computing Systems; May 2021; Yokohama Japan (2021). p. 1–11. doi:10.1145/3411764.3445109
20. Wald R, Khoshgoftaar TM, Napolitano A, Sumner C. Which Users Reply to and Interact with Twitter Social Bots? In: Proceedings of the 2013 IEEE 25th International Conference on Tools with Artificial Intelligence; November 2013; Herndon, VA, USA (2013). p. 135–44. doi:10.1109/ICTAI.2013.30
21. Mendoza M, Tesconi M, Cresci S. Bots in Social and Interaction Networks. ACM Trans Inf Syst (2021) 39(1):1–32. doi:10.1145/3419369
22. Cresci S, Di Pietro R, Petrocchi M, Spognardi A, Tesconi M. Fame for Sale: Efficient Detection of Fake Twitter Followers. Decis Support Syst (2015) 80:56–71. doi:10.1016/j.dss.2015.09.003
23. Brachten F, Mirbabaie M, Stieglitz S, Berger O, Bludau S, Schrickel K. Threat or Opportunity?-Examining Social Bots in Social Media Crisis Communication. arXiv (2018). arXiv preprint arXiv:181009159. doi:10.48550/arXiv.1810.09159
24. Schäfer F, Evert S, Heinrich P. Japan's 2014 General Election: Political Bots, Right-Wing Internet Activism, and Prime Minister Shinzō Abe's Hidden Nationalist Agenda. Big data (2017) 5(4):294–309. doi:10.1089/big.2017.0049
25. Stella M, Ferrara E, De Domenico M. Bots Increase Exposure to Negative and Inflammatory Content in Online Social Systems. Proc Natl Acad Sci U.S.A (2018) 115(49):12435–40. doi:10.1073/pnas.1803470115
26. Al-Rawi A, Shukla V. Bots as Active News Promoters: A Digital Analysis of Covid-19 Tweets. Information (2020) 11(10):461. doi:10.3390/info11100461
27. Anzalone SM, Boucenna S, Ivaldi S, Chetouani M. Evaluating the Engagement with Social Robots. Int J Soc Robotics (2015) 7(4):465–78. doi:10.1007/s12369-015-0298-7
28. Kirby R, Forlizzi J, Simmons R. Affective Social Robots. Robotics Autonomous Syst (2010) 58(3):322–32. doi:10.1016/j.robot.2009.09.015
29. Edwards A, Edwards C, Westerman D, Spence PR. Initial Expectations, Interactions, and beyond with Social Robots. Comput Hum Behav (2019) 90:308–14. doi:10.1016/j.chb.2018.08.042
30. Boshmaf Y, Muslukhov I, Beznosov K, Ripeanu M. The Socialbot Network. In: Proceedings of the 27th annual computer security applications conference; December 2011; Orlando Florida USA (2011). p. 93–102. doi:10.1145/2076732.2076746
31. Bolsover G, Howard P. Computational Propaganda and Political Big Data: Moving toward a More Critical Research Agenda. Big Data (2017) 5:273–6. Mary Ann Liebert, Inc. 140 Huguenot Street, 3rd Floor New Rochelle, NY 10801 USA. doi:10.1089/big.2017.29024.cpr
32. Da San Martino G, Cresci S, Barrón-Cedeño A, Yu S, Di Pietro R, Nakov P. A Survey on Computational Propaganda Detection. arXiv (2020). arXiv preprint arXiv:200708024. doi:10.48550/arXiv.2007.08024
33. Woolley SC, Howard PN. Computational Propaganda: Political Parties, Politicians, and Political Manipulation on Social Media. Oxford, United Kingdom: Oxford University Press (2018).
34. Chen W, Pacheco D, Yang K-C, Menczer F. Neutral Bots Probe Political Bias on Social Media. Nat Commun (2021) 12(1):1–10. doi:10.1038/s41467-021-25738-6
35. Min Y, Jiang T, Jin C, Li Q, Jin X. Endogenetic Structure of Filter Bubble in Social Networks. R Soc Open Sci (2019) 6(11):190868. doi:10.1098/rsos.190868
36. Kitzie VL, Mohammadi E, Karami A. "Life Never Matters in the DEMOCRATS MIND": Examining Strategies of Retweeted Social Bots during a Mass Shooting Event. Proc Assoc Info Sci Tech (2018) 55(1):254–63. doi:10.1002/pra2.2018.14505501028
37. Khaund T, Al-Khateeb S, Tokdemir S, Agarwal N. Analyzing Social Bots and Their Coordination during Natural Disasters. In: International Conference on Social Computing, Behavioral-Cultural Modeling and Prediction and Behavior Representation in Modeling and Simulation; July 2018; Washington DC, USA (2018). p. 207–12. doi:10.1007/978-3-319-93372-6_23
38. Yuan X, Schuchard RJ, Crooks AT. Examining Emergent Communities and Social Bots within the Polarized Online Vaccination Debate in Twitter. Soc Media + Soc (2019) 5(3):205630511986546. doi:10.1177/2056305119865465
39. Ferrara E. Disinformation and Social Bot Operations in the Run up to the 2017 French Presidential Election. First Monday (2017) 22(8). arXiv preprint arXiv:170700086. doi:10.5210/fm.v22i8.8005
40. Lazer DMJ, Baum MA, Benkler Y, Berinsky AJ, Greenhill KM, Menczer F, et al. The Science of Fake News. Science (2018) 359(6380):1094–6. doi:10.1126/science.aao2998
41. Shao C, Ciampaglia GL, Varol O, Yang K-C, Flammini A, Menczer F. The Spread of Low-Credibility Content by Social Bots. Nat Commun (2018) 9(1):1–9. doi:10.1038/s41467-018-06930-7
42. Bessi A, Ferrara E. Social Bots Distort the 2016 Us Presidential Election Online Discussion. First Monday (2016) 21(11). Available at SSRN 2982233. doi:10.5210/fm.v21i11.7090
43. Boichak O, Jackson S, Hemsley J, Tanupabrungsun S. Automated Diffusion? Bots and Their Influence during the 2016 U.S. Presidential Election. In: Proceedings of the International conference on information; December 2018; San Francisco Marriott Marquis (2018). p. 17–26. doi:10.1007/978-3-319-78105-1_3
44. Santini RM, Salles D, Tucci G. Comparative Approaches to Mis/Disinformation| when Machine Behavior Targets Future Voters: The Use of Social Bots to Test Narratives for Political Campaigns in Brazil. Int J Commun (2021) 15:24.
45. Gorodnichenko Y, Pham T, Talavera O. Social media, Sentiment and Public Opinions: Evidence from #Brexit and #USElection. Eur Econ Rev (2021) 136:103772. doi:10.1016/j.euroecorev.2021.103772
46. Allem J-P, Ferrara E, Uppu SP, Cruz TB, Unger JB. E-cigarette Surveillance with Social Media Data: Social Bots, Emerging Topics, and Trends. JMIR Public Health Surveill (2017) 3(4):e98. doi:10.2196/publichealth.8641
47. Allem J-P, Escobedo P, Dharmapuri L. Cannabis Surveillance with Twitter Data: Emerging Topics and Social Bots. Am J Public Health (2020) 110(3):357–62. doi:10.2105/AJPH.2019.305461
48. Brachten F, Stieglitz S, Hofeditz L, Kloppenborg K, Reimann A. Strategies and Influence of Social Bots in a 2017 German State Election-A Case Study on Twitter. arXiv (2017). arXiv preprint arXiv:171007562. doi:10.48550/arXiv.1710.07562
49. Murthy D, Powell AB, Tinati R, Anstead N, Carr L, Halford SJ, et al. Automation, Algorithms, and Politics| Bots and Political Influence: A Sociotechnical Investigation of Social Network Capital. Int J Commun (2016) 10:20.
50. Assenmacher D, Clever L, Frischlich L, Quandt T, Trautmann H, Grimme C. Demystifying Social Bots: On the Intelligence of Automated Social Media Actors. Soc Media + Soc (2020) 6(3):205630512093926. doi:10.1177/2056305120939264
51. Forelle M, Howard PN, Monroy-Hernández A, Savage S. Political Bots and the Manipulation of Public Opinion in Venezuela. SSRN Electron J (2015). Available at SSRN 2635800. doi:10.2139/ssrn.2635800
52. Martini F, Samula P, Keller TR, Klinger U. Bot, or Not? Comparing Three Methods for Detecting Social Bots in Five Political Discourses. Big Data Soc (2021) 8(2):205395172110335. doi:10.1177/20539517211033566
53. Howard PN, Kollanyi B. Bots,# Strongerin, and# Brexit: Computational Propaganda during the Uk-Eu Referendum. SSRN Electron J (2016). Available at SSRN 2798311. doi:10.2139/ssrn.2798311
54. Davis CA, Varol O, Ferrara E, Flammini A, Menczer F. BotOrNot. In: Proceedings of the 25th international conference companion on world wide web; April 2016; Montréal Québec Canada (2016). p. 273–4. doi:10.1145/2872518.2889302
55. Grimme C, Assenmacher D, Adam L. Changing Perspectives: Is it Sufficient to Detect Social Bots? In: Proceedings of the International conference on social computing and social media; July, 2018; Copenhagen Denmark (2018). p. 445–61. doi:10.1007/978-3-319-91521-0_32
56. Mowbray M. The Twittering Machine. In: Proceedings of the 6th International Conference on Web Information Systems and Technologies; April 7-10, 2010; Valencia, Spain (2010). p. 299–304.
57. Haustein S, Bowman TD, Holmberg K, Tsou A, Sugimoto CR, Larivière V. Tweets as Impact Indicators: Examining the Implications of Automated "bot" Accounts on Twitter. J Assn Inf Sci Tec (2016) 67(1):232–8. doi:10.1002/asi.23456
58. Wu J, Zhan Q, Liu Y. A Zombie Fans Recognition Model for Microblog Combining Text Sentiment Analysis. Comput Eng (2020) 46(6):288–95. doi:10.19678/j.issn.1000-3428.0055232
59. Stieglitz S, Mirbabaie M, Ross B, Neuberger C. Social media Analytics - Challenges in Topic Discovery, Data Collection, and Data Preparation. Int J Inf Manag (2018) 39:156–68. doi:10.1016/j.ijinfomgt.2017.12.002
60. An L, Zhou W, Ou M, Li G, Yu C, Wang X. Measuring and Profiling the Topical Influence and Sentiment Contagion of Public Event Stakeholders. Int J Inf Manage (2021) 58:102327. doi:10.1016/j.ijinfomgt.2021.102327
61. Hofmann T. Probabilistic Latent Semantic Indexing. In: Proceedings of the 22nd annual international ACM SIGIR conference on Research and development in information retrieval; August 15 - 19, 1999; Berkeley California USA (1999). p. 50–7. doi:10.1145/312624.312649
62. Blei DM, Ng AY, Jordan MI. Latent Dirichlet Allocation. J machine Learn Res (2003) 3:993–1022. doi:10.1162/jmlr.2003.3.4-5.993
63. Angelov D. Top2vec: Distributed Representations of Topics. arXiv (2020). arXiv preprint arXiv:200809470. doi:10.48550/arXiv.2008.09470
64. Ghasiya P, Okamura K. Investigating Covid-19 News across Four Nations: A Topic Modeling and Sentiment Analysis Approach. IEEE Access (2021) 9:36645–56. doi:10.1109/ACCESS.2021.3062875
65. Devlin J, Chang M-W, Lee K, Toutanova K. Bert: Pre-training of Deep Bidirectional Transformers for Language Understanding. arXiv (2018). arXiv preprint arXiv:181004805. doi:10.48550/arXiv.1810.04805
66. McInnes L, Healy J, Melville J. Umap: Uniform Manifold Approximation and Projection for Dimension Reduction. arXiv (2018). arXiv preprint arXiv:180203426. doi:10.48550/arXiv.1802.03426
67. Allaoui M, Kherfi ML, Cheriet A. Considerably Improving Clustering Algorithms Using Umap Dimensionality Reduction Technique: A Comparative Study. Int Conf Image Signal Process (2020), 12119:317–25. doi:10.1007/978-3-030-51935-3_34
68. Ko H-K, Jo J, Seo J. Progressive Uniform Manifold Approximation and Projection. EuroVis (Short Papers) (2020) 133–7. doi:10.2312/evs.20201061
69. McInnes L, Healy J. Accelerated Hierarchical Density Based Clustering. In: Proceedings of the 2017 IEEE International Conference on Data Mining Workshops (ICDMW); November 2017; New Orleans, LA, USA (2017). p. 33–42. doi:10.1109/ICDMW.2017.12
70. Cui X, Quan Z, Chen X, Zhang Z, Zhou J, Liu X, et al. Gpr-Based Automatic Identification of Root Zones of Influence Using Hdbscan. Remote Sensing (2021) 13(6):1227. doi:10.3390/rs13061227
71. Wang L, Chen P, Chen L, Mou J. Ship Ais Trajectory Clustering: An Hdbscan-Based Approach. Jmse (2021) 9(6):566. doi:10.3390/jmse9060566
72. Neppalli VK, Caragea C, Squicciarini A, Tapia A, Stehle S. Sentiment Analysis during Hurricane Sandy in Emergency Response. Int J Disaster Risk reduction (2017) 21:213–22. doi:10.1016/j.ijdrr.2016.12.011
73. Kiritchenko S, Zhu X, Cherry C, Mohammad S. Nrc-Canada-2014: Detecting Aspects and Sentiment in Customer Reviews. In: Proceedings of the 8th international workshop on semantic evaluation (SemEval 2014); August 2014; Dublin, Ireland (2014). p. 437–42. doi:10.3115/v1/s14-2076
74. Gao Z, Feng A, Song X, Wu X. Target-Dependent Sentiment Classification with Bert. IEEE Access (2019) 7:154290–9. doi:10.1109/ACCESS.2019.2946594
75. Vaswani A, Shazeer N, Parmar N, Uszkoreit J, Jones L, Gomez AN, et al. Attention Is All You Need. Adv Neural Inf Process Syst (2017) 30:5998–6008.
76. Munikar M, Shakya S, Shrestha A. Fine-grained Sentiment Classification Using Bert. Artif Intelligence Transforming Business Soc (Aitb) (20192019) 1:1–5. doi:10.1109/AITB48515.2019.8947435
77. Kim SY, Ganesan K, Dickens P, Panda S. Public Sentiment toward Solar Energy-Opinion Mining of Twitter Using a Transformer-Based Language Model. Sustainability (2021) 13(5):2673. doi:10.3390/su13052673
78. Saqr M, Alamro A. The Role of Social Network Analysis as a Learning Analytics Tool in Online Problem Based Learning. BMC Med Educ (2019) 19(1):1–11. doi:10.1186/s12909-019-1599-6
79. Borgatti SP, Mehra A, Brass DJ, Labianca G. Network Analysis in the Social Sciences. science (2009) 323(5916):892–5. doi:10.1126/science.1165821
80. Zhang J, Luo Y. Degree Centrality, Betweenness Centrality, and Closeness Centrality in Social Network. In: Proceedings of the 2017 2nd International Conference on Modelling, Simulation and Applied Mathematics (MSAM2017); March 2017; Bangkok, Thailand (2017). p. 300–3. doi:10.2991/msam-17.2017.68
81. Easley D, Kleinberg J. Networks, Crowds, and Markets: Reasoning about a Highly Connected World. Cambridge, United Kingdom: Cambridge University Press (2010).
82. Yang Z, Song J, Gao S, Wang H, Du Y, Lin Q. Contact Network Analysis of Covid-19 in Tourist Areas--Based on 333 Confirmed Cases in China. Plos one (2021) 16(12):e0261335. doi:10.1371/journal.pone.0261335
Keywords: social networks, bot users, behavioral characteristics, diffusion mechanism, comparative analysis
Citation: Cai M, Luo H, Meng X and Cui Y (2022) Differences in Behavioral Characteristics and Diffusion Mechanisms: A Comparative Analysis Based on Social Bots and Human Users. Front. Phys. 10:875574. doi: 10.3389/fphy.2022.875574
Received: 14 February 2022; Accepted: 04 April 2022;
Published: 25 April 2022.
Edited by:
Jian Gao, Northwestern University, United StatesReviewed by:
Yong Min, Zhejiang University of Technology, ChinaMuhua Zheng, Jiangsu University, China
Bo Chen, Argonne National Laboratory (DOE), United States
Copyright © 2022 Cai, Luo, Meng and Cui. This is an open-access article distributed under the terms of the Creative Commons Attribution License (CC BY). The use, distribution or reproduction in other forums is permitted, provided the original author(s) and the copyright owner(s) are credited and that the original publication in this journal is cited, in accordance with accepted academic practice. No use, distribution or reproduction is permitted which does not comply with these terms.
*Correspondence: Meng Cai, bWVuZ2NhaUBtYWlsLnhqdHUuZWR1LmNu