- School of Electric Power, Civil Engineering and Architecture, Shanxi University, Taiyuan, China
Atmospheric-pressure surface dielectric barrier discharge (SDBD) has drawn significant attention, and the influence on the SDBD characteristics of surface dielectric barrier materials has been widely studied. In this work, a two-dimensional self-consistent fluid model is built to investigate the effect of barrier material characteristics on SDBD by introducing a linear permittivity distribution. It is demonstrated that a dielectric barrier with graded permittivity can affect the SDBD by changing the electric field distribution near the surface and speeding up the propagation of the streamer. The graded permittivity along the layer of the dielectric barrier plays a significant role in improving the dynamic characteristics of the SDBD.
Introduction
Under conditions of low temperature, non-equilibrium, and atmospheric pressure, dielectric barrier discharge (DBD) shows great advantages in many applications, such as materials processing, environmental remediation, and flow control [1]. DBD has the advantage of generating stable and uniform plasma, helping to avoid the transition to a high temperature arc with a constricted channel [2]. The production of oxidizing species in the DBD application of activating water for sanification such as hydrogen peroxide and ozone is efficient, giving the plasma antiseptic properties [3]. It is found that the externally enforced electric potential is able to generate a drift of the heavy species and electrons, leading to a charge density distribution which in turn creates distortions of the electric potential distribution in the bulk of the plasma [4]. Compared with the DBD, the SDBD is more efficient than the parallel plate volume DBD in the intended application of fluid dynamic actuation [5]. The discharge propagates on the surface of the dielectric barrier, which is exposed to the ambient gas. During propagation, reactive species are formed; in which ions play the dominant role in flow control, such as controlling laminar to turbulent flow transitions [6–8]. As for the influence of parameters, SDBDs with positive and negative polarity have been investigated [9–11]. Several kinds of SDBDs with different geometries and voltage polarities of multi-electrodes have been studied to investigate the discharge dynamical characteristics [12]. For all voltage pulses, the discharge has a channeled structure, and the discharge length decreases with increased epsilon value [13]. The idea of using FGM for electric field optimization was proposed, and it was proved that the introduction of FGM could alleviate the local electric field concentration [14]. Considering the rapid development of 3D print technology, a non-linear functionally graded material (FGM) as a dielectric barrier may become a reality, creating a space-varying electric field on the dielectric surface [15]. The discharge becomes more intense [16, 17] and the surface charge density is much higher [18] with greater permittivity introduced into the dielectric. However, the issues of discharge uniformity and plasma propagation parameters have not received much attention in SDBD with functionally graded material. The use of graded permittivity material may provide a new way to control the SDBD plasma parameters. In this work, the influence mechanism of the graded permittivity dielectric barrier on SDBD is investigated in the light of both surface and space species accumulation. The spatiotemporal distributions of electron density and electric field are studied as streamers propagate along the dielectric surface. The aerodynamic characteristics are investigated and compared in permittivity to uniform and graded distributions as well.
Computational Model
Simulation Model and Governing Equations
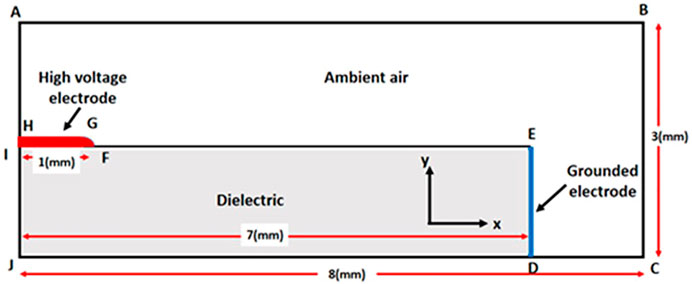
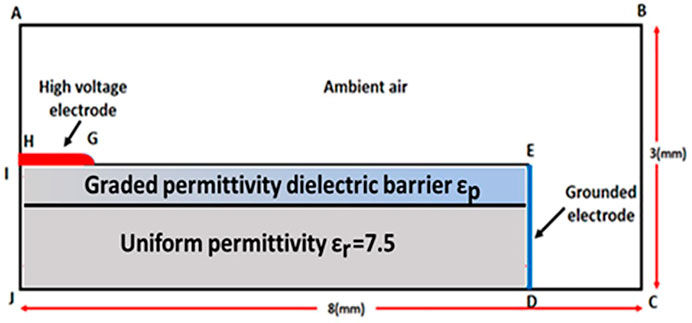
The surface dielectric barrier discharge in this work is simplified as a two-dimensional (2D) model, as depicted in Figure 1. The simulation domain is 8 mm (length) × 3 mm (height) in Cartesian x–y coordinates. The length of the ambient air and dielectric barrier are 8 and 7 mm, respectively. The thickness of the gas gap is 1.5 mm above the dielectric barrier and 3 mm above the rest. The grounded electrode was placed on the right side of the dielectric barrier, and the single exposed electrode with a high voltage is on the upper left surface of the dielectric barrier. The barrier dielectric is given a space-varying permittivity
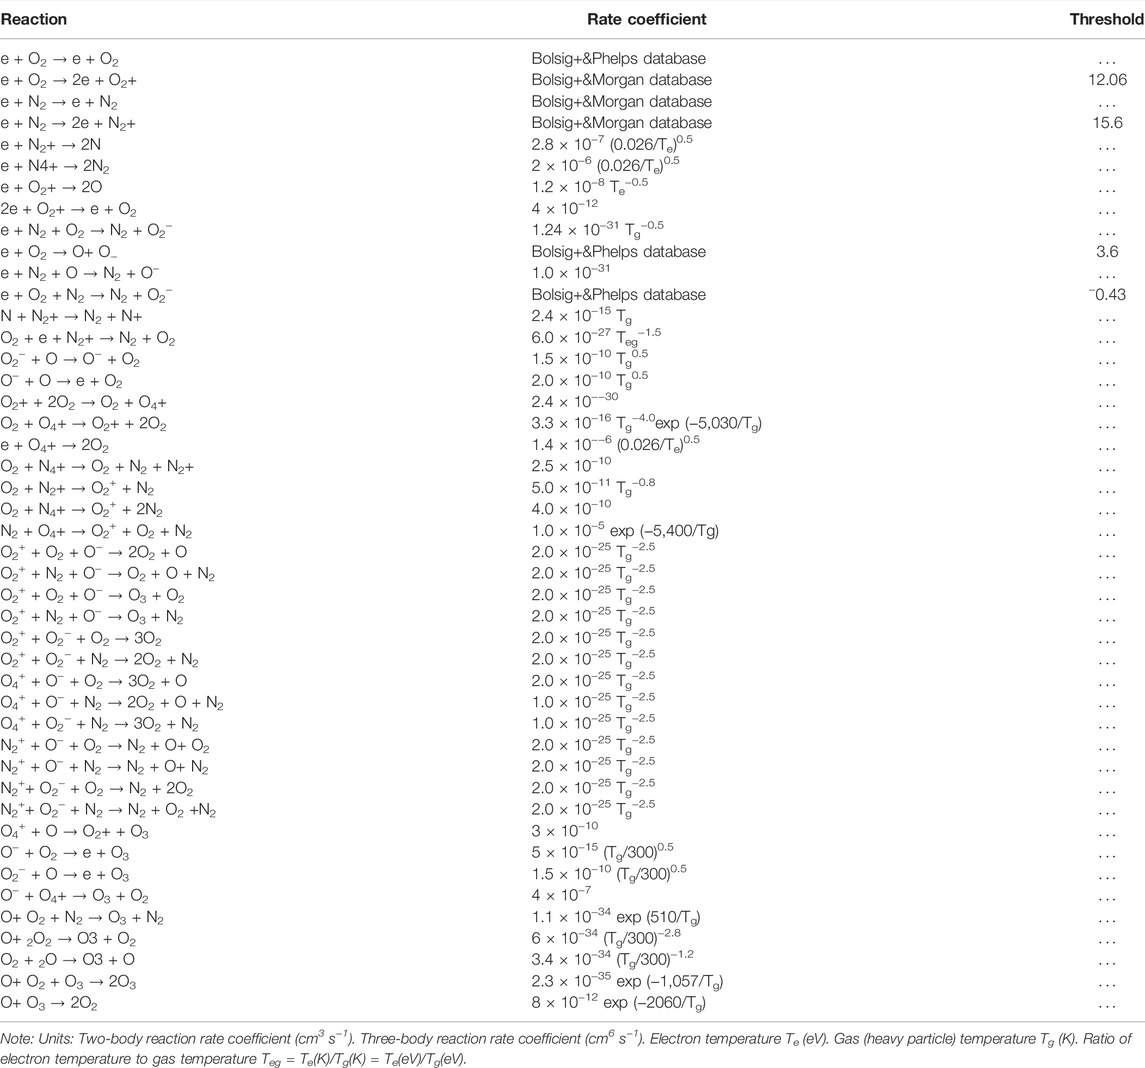
In the equations above, E is the electric field vector, µ is mobility, D is the diffusion coefficient, and Sj is the source of species of species j (j = e, −, +), which can be derived from the chemical reactions. The working gas is simplified as 80% N2 and 20% O2. The species and reactions in the model are given in Table 1. The rate coefficients of electron impact reactions are obtained by solving Boltzmann’s equation using BOLSIG+1. Cross sections are taken from the Morgan, TRINITI, and Phelps databases2–4. What’s more, the local field approximation is applied when calculating parameters, and the electron mean energy and electron transport coefficient are given as a function of reduced electric field. Transport coefficients for ions and neutrals were estimated following Ref. [19].
The electric potential is found by:
where,
where n is the unit vector perpendicular to the dielectric surface,
Graded Dielectric Permittivity and Boundaries
In a uniform electric field, the initial charged particle density is uniformly distributed. In a non-uniform distorted electric field, it is generally considered that the initial charged particle density obeys a Gaussian distribution. For the non-uniform field discharge of needle plate structure, it is often assumed that the initial charged particles (electrons and positive ions) follow the Gaussian distribution and that the negative ion density is zero [20–22]. The initial electron distribution is given by:
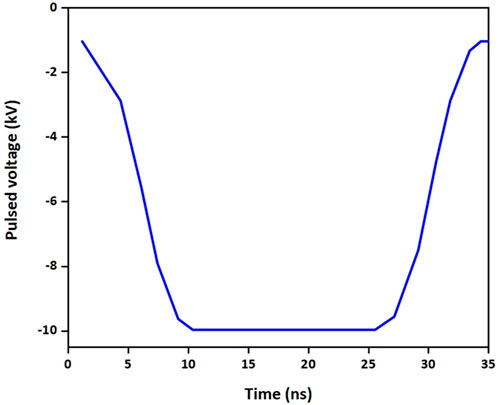
where Nmax = 1016 m−3, (x0, y0) = (0, 2 mm), σ = 62.5 µm. (x0, y0) are the spatial coordinates of the needle electrode head. The negative voltage applied is shown in Figure 2.
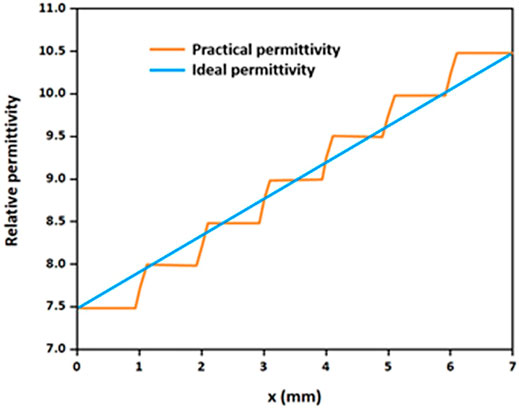
Considering the technical process and reliability of graded material in 3D printing, several dielectric permittivity distributions are proposed in the present work, as a function of x along the length of the dielectric barrier direction, as shown in Figure 3. Both ideal permittivity and practical permittivity distributions are depicted as in Figure 3, and the approximated function of ideal permittivity is
Boundary conditions are given in Table 2.
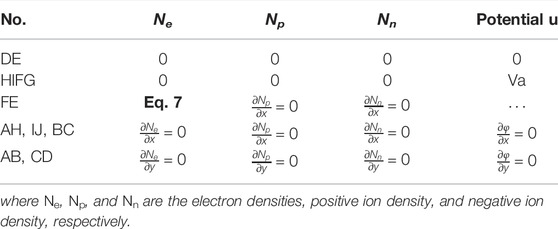
TABLE 2. Boundary conditions on potential
Results and Discussion
Species Density Distribution and Electric Field
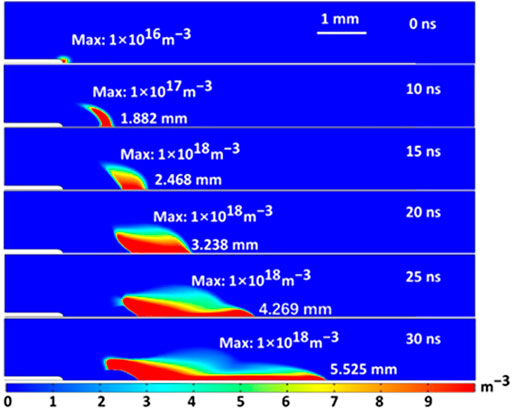
The spatial distribution of electron density with dielectric barrier permittivity
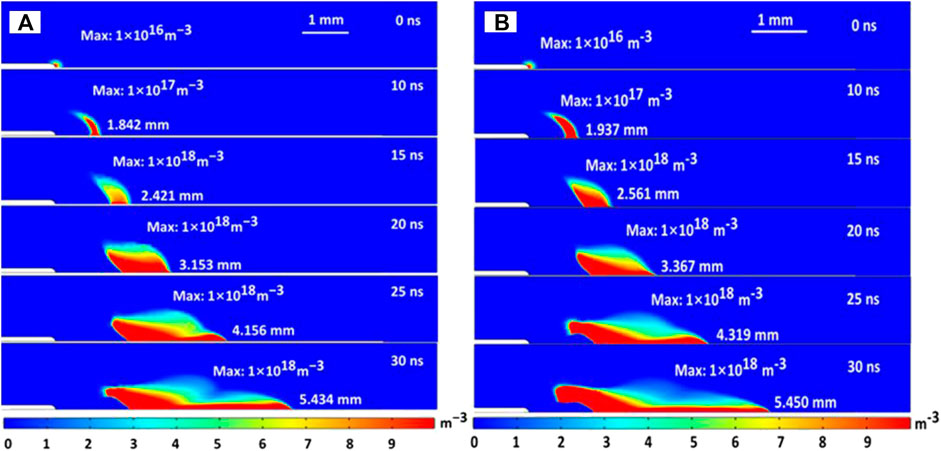
FIGURE 4. The spatial distribution of electron density with dielectric barrier εr =7.5 (A) and εp (B).
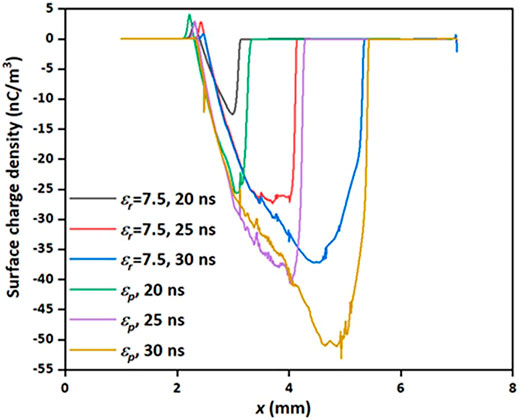
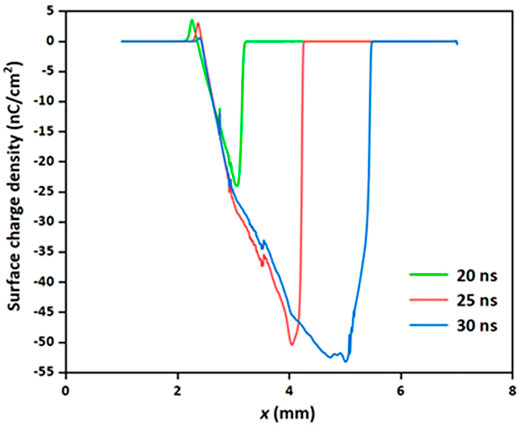
Figure 6 shows the spatial distribution of surface charge density with uniform and graded permittivity. The charge density along the dielectric barrier has a wider distribution range under the condition of graded permittivity. The
What’s more, surface charge density increases with the graded permittivity, which is inflected by the length along the dielectric. With the development of discharge, the streamer slides over the surface of the dielectric barrier, driven by the increasing electric field caused by the graded permittivity in the form of step-rise. The graded permittivity applied in this case, as presented, is more obviously in a changing electric field. The tiny adjustment by the graded permittivity dielectric barrier may result in continuously extended discharge propagation and more surface charge density (Figure 6).
To understand the influence of graded permittivity on some reactive molecules, the spatiotemporal evolution of
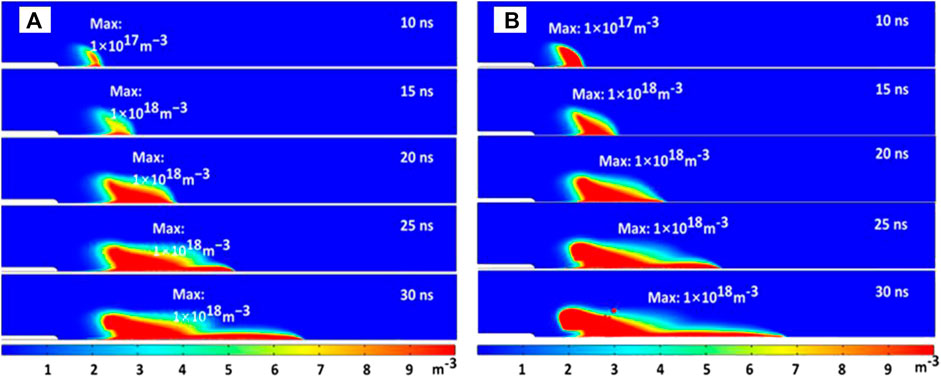
FIGURE 8. The spatiotemporal evolution of N4+ density with uniform permittivity (A) and graded permittivity (B) dielectric barrier.
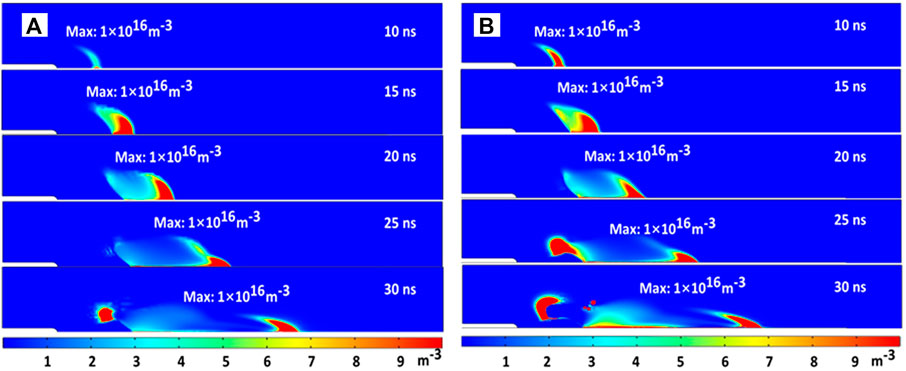
FIGURE 9. The spatiotemporal evolution of N2+ density with uniform permittivity (A) and graded permittivity (B) dielectric barrier.
The higher density and producing rates of
Contours of Momentum Sources (Body Force) With Uniform Permittivity and Graded Permittivity
As for the aerodynamic applications, the momentum source due to the charged particles’ collisions with neutral gas molecules (body force) is given by [10]
where
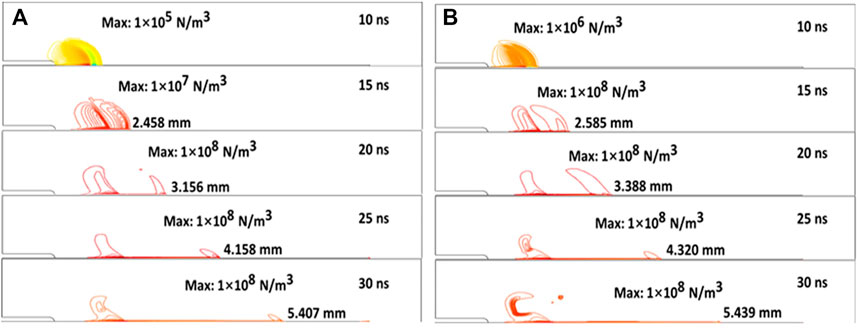
FIGURE 10. Contours of momentum source with dielectric barrier of uniform permittivity (A) and graded permittivity (B).
The numbers on the right side of the contours are the x-coordinates of the streamer head, as shown in Figure 10. It is obvious from Figure 10B that the contours cover a wider range on the dielectric surface and propagate at a faster speed. The graded permittivity introduced in the model shows an intense and speeded-up momentum exchange between charged ions, electrons, and neural molecules in the ambient air. Local vortex caused by body force is considered to be the possible way of cooling down of the temperature and a kind of diffusion effect to the streamer propagation. The longer propagation of vortex means that, with the same negative voltage pulse applied, the flow-field control along the dielectric surface seems to be more efficient. The “ionization wind” will slide faster and generate more thrust force on the surface of the functionally graded material dielectric barrier.
The Influence of Thickness on Graded Permittivity Dielectric Layer
The 2-D model of different dielectric barrier layer thickness is shown in Figure 11, in order to investigate the influence of thickness of linear permittivity dielectric layer on SDBD, the thickness of graded permittivity dielectric barrier is reduced to 0.5 mm, and the rest of the dielectric barrier is in the uniform permittivity
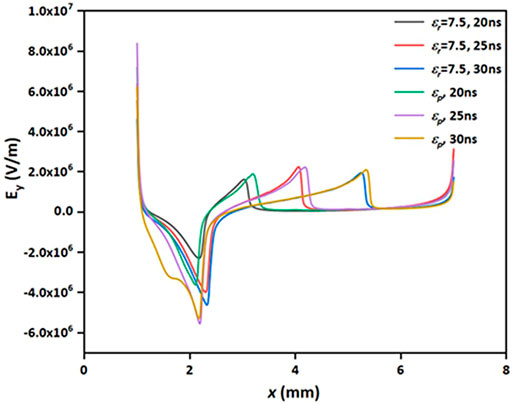
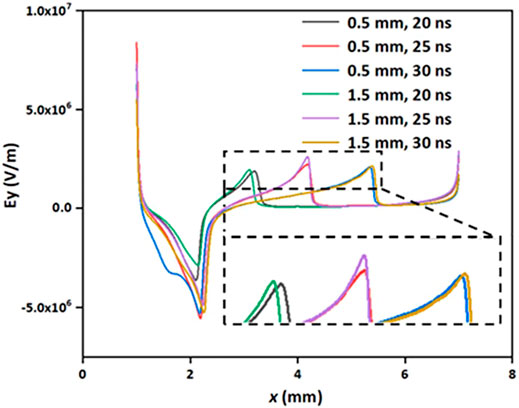
The number on the right side of the streamer head is the x coordinate of it. Figure 12 depicts the spatial distribution of electron density with a layer of thin thickness. Compared with Figure 4B, it depicts a shorter distance of propagation in Figure 12, but somewhat at 30 ns (falloff of the negative voltage pulse), in the similar position of the streamer head. But the reversal of electron density distribution pointing at the high voltage electrode is suppressed, which can be seen in Figure 12. As indicated in Figure 5B, the graded permittivity dielectric affects the streamer propagation by enhancing the electric field distribution, and it mainly takes place along the surface of the dielectric barrier. As a consequence, with the same voltage applied, the electric field would not be dramatically changed in the
Conclusion
In this work, a 2-D model was developed to study surface dielectric barrier discharge with functionally graded material under the condition of a single negative nanosecond voltage pulse being applied.
1) The dielectric layer with graded permittivity can influence SDBD characteristics by enhancing the electric field
2) The propagation of streamer has a longer distance in step-rise graded permittivity dielectric barrier of all thickness of the layer, compared with that in uniform constant permittivity. The distribution of electrons and reactive species tends to be a wider range on the surface, which can provide a better application experience for the catalyst industry.
3) The contours of the momentum source are studied, and it predicts a more complex structure in the head of the streamer with a graded permittivity dielectric barrier surface and faster propagation. The direction of body force seems to point oppositely to the surface. It is enhanced in the propagation direction compared with the reported results for the positive voltage in the literature.
Data Availability Statement
The original contributions presented in the study are included in the article/Supplementary Material, further inquiries can be directed to the corresponding author.
Author Contributions
ZZ contributed to the simulation model building, manuscript writing, and data collection.
Conflict of Interest
The author declares that the research was conducted in the absence of any commercial or financial relationships that could be construed as a potential conflict of interest.
Publisher’s Note
All claims expressed in this article are solely those of the authors and do not necessarily represent those of their affiliated organizations, or those of the publisher, the editors, and the reviewers. Any product that may be evaluated in this article, or claim that may be made by its manufacturer, is not guaranteed or endorsed by the publisher.
Footnotes
1See http://www.bolsig.laplace.univ-tlse.fr/ for information about Bolsig+.
2See http://www.lxcat.net for Morgan database.
3See http://www.lxcat.net for TRINITI database.
4See http://www.lxcat.net for the Phelps database.
References
1. Adamovich I, Baalrud SD, Bogaerts A, Bruggeman PJ, Cappelli M, Colombo V, et al. The 2017 Plasma Roadmap: Low Temperature Plasma Science and Technology. J Phys D: Appl Phys (2017) 50(32):323001. doi:10.1088/1361-6463/aa76f5
2. Zhang J, Wang Y, Wang D, Economou DJ. Numerical Simulation of Streamer Evolution in Surface Dielectric Barrier Discharge with Electrode-Array. J Appl Phys (2020) 128(9):093301. doi:10.1063/5.0013594
3. Colonna G, Pintassilgo CD, Pegoraro F, Cristofolini A, Popoli A, Neretti G, et al. Theoretical and Experimental Aspects of Non-equilibrium Plasmas in Different Regimes: Fundamentals and Selected Applications. Eur Phys J D (2021) 75(6):183. doi:10.1140/epjd/s10053-021-00186-5
4. Cristofolini A, Popoli A. A Multi-Stage Approach for DBD Modelling. J Phys Conf Ser (2019) 1243(1):012012. doi:10.1088/1742-6596/1243/1/012012
5. Abdelaziz AA, Ishijima T, Seto T, Osawa N, Wedaa H, Otani Y. Characterization of Surface Dielectric Barrier Discharge Influenced by Intermediate Frequency for Ozone Production. Plasma Sourc Sci. Technol. (2016) 25(3):035012. doi:10.1088/0963-0252/25/3/035012
6. Likhanskii AV, Shneider MN, Macheret SO, Miles RB. Modeling of Dielectric Barrier Discharge Plasma Actuator in Air. J Appl Phys (2008) 103(5):053305. doi:10.1063/1.2837890
7. Boeuf JP, Pitchford LC. Electrohydrodynamic Force and Aerodynamic Flow Acceleration in Surface Dielectric Barrier Discharge. J Appl Phys (2005) 97(10):103307. doi:10.1063/1.1901841
8. Likhanskii AV, Shneider MN, Macheret SO, Miles RB. Modeling of Dielectric Barrier Discharge Plasma Actuators Driven by Repetitive Nanosecond Pulses. Phys Plasmas (2007) 14(7):073501. doi:10.1063/1.2744227
9. Soloviev VR, Krivtsov VM, Shcherbanev SA, Starikovskaia SM. Evolution of Nanosecond Surface Dielectric Barrier Discharge for Negative Polarity of a Voltage Pulse. Plasma Sourc Sci Tech (2017) 26(1):014001. doi:10.1088/1361-6595/aae63e
10. Soloviev VR, Krivtsov VM. Surface Barrier Discharge Modelling for Aerodynamic Applications. J Phys D: Appl Phys (2009) 42:125208. doi:10.1088/0022-3727/42/12/125208
11. Babaeva NY, Tereshonok DV, Naidis GV. Fluid and Hybrid Modeling of Nanosecond Surface Discharges: Effect of Polarity and Secondary Electrons Emission. Plasma Sourc Sci. Technol. (2016) 25(4):044008. doi:10.1088/0963-0252/25/4/044008
12. Zhang J, Wang Y, Wang D. Modeling of Surface Dielectric Barrier Discharge with Multi-Electrode at Atmospheric Pressure. IEEE Trans Plasma Sci (2021) 49(10):3059–69. doi:10.1109/tps.2021.3108814
13. Sokolova MV, Voevodin VV, Malakhov JI, Aleksandrov NL, Anokhin EM, Soloviev VR. Barrier Properties Influence on the Surface Dielectric Barrier Discharge Driven by Single Voltage Pulses of Different Duration. J Phys D: Appl Phys (2019) 52(32):324001. doi:10.1088/1361-6463/ab20ef
14. Watanabe S, Hayashi N, Takeuchi H, Uchida Y, Dykes D, Touchard G, et al. Electrical Applications of Titanium-Based FGMs Manufactured by Progressive Lamination. In: Proceedings of the IEEE 6th International Conference on Conduction and Breakdown in Solid Dielectrics; 22-25 June 1998; Vasteras, Sweden (1998). p. 539–42.
15. Zhang G-J, Su G-Q, Song B-P, Mu H-B. Pulsed Flashover across a Solid Dielectric in Vacuum. IEEE Trans Dielect Electr Insul (2018) 25(6):2321–39. doi:10.1109/tdei.2018.007133
16. Golubovskii YB, Maiorov VA, Li P, Lindmayer M. Effect of the Barrier Material in a Townsend Barrier Discharge in Nitrogen at Atmospheric Pressure. J Phys D: Appl Phys (2006) 39(8):1574–83. doi:10.1088/0022-3727/39/8/016
17. Li R, Tang Q, Yin S, Sato T. Investigation of Dielectric Barrier Discharge Dependence on Permittivity of Barrier Materials. Appl Phys Lett (2007) 90(13):131502. doi:10.1063/1.2716848
18. Tschiersch R, Nemschokmichal S, Bogaczyk M, Meichsner J. Surface Charge Measurements on Different Dielectrics in Diffuse and Filamentary Barrier Discharges. J Phys D: Appl Phys (2017) 50(10):105207. doi:10.1088/1361-6463/aa5605
19. Murakami T, Niemi K, Gans T, O' Connell D, Graham WG. Chemical Kinetics and Reactive Species in Atmospheric Pressure Helium–Oxygen Plasmas with Humid-Air Impurities. Plasma Sourc Sci Tech (2013) 22(1):015003. doi:10.1088/0963-0252/22/4/045010
20. Morrow R, Lowke JJ. Streamer Propagation in Air. J Phys D: Appl Phys (1997) 30(4):614–27. doi:10.1088/0022-3727/30/4/017
21. Woo Seok Kang WS, Jin Myung Park J, Yongho Kim Y, Sang Hee Hong S. Numerical Study on Influences of Barrier Arrangements on Dielectric Barrier Discharge Characteristics. IEEE Trans Plasma Sci (2003) 31(4):504–10. doi:10.1109/tps.2003.815469
22. Tran TN, Golosnoy IO, Lewin PL, Georghiou GE. Numerical Modelling of Negative Discharges in Air with Experimental Validation. J Phys D: Appl Phys (2011) 44(1):015203. doi:10.1088/0022-3727/44/1/015203
23. Cheng H, Fan J, Zhang Y, Liu D, Ostrikov K. Nanosecond Pulse Plasma Dry Reforming of Natural Gas. Catal Today (2020) 351:103–12. doi:10.1016/j.cattod.2018.11.026
Keywords: surface dielectric barrier discharge, graded permittivity, propagation speed, mode transition, dynamics
Citation: Zhang Z (2022) Numerical Simulation of Surface Dielectric Barrier Discharge With Functionally Graded Material. Front. Phys. 10:874887. doi: 10.3389/fphy.2022.874887
Received: 13 February 2022; Accepted: 21 March 2022;
Published: 28 April 2022.
Edited by:
Antonio D’Angola, University of Basilicata, ItalyReviewed by:
Andrea Cristofolini, University of Bologna, ItalyNatalia Babaeva, Joint Institute for High Temperatures (RAS), Russia
Copyright © 2022 Zhang. This is an open-access article distributed under the terms of the Creative Commons Attribution License (CC BY). The use, distribution or reproduction in other forums is permitted, provided the original author(s) and the copyright owner(s) are credited and that the original publication in this journal is cited, in accordance with accepted academic practice. No use, distribution or reproduction is permitted which does not comply with these terms.
*Correspondence: Zelin Zhang, MjAyMDIzNTA0MDQ0QGVtYWlsLnN4dS5lZHUuY24=
 Zelin Zhang