
95% of researchers rate our articles as excellent or good
Learn more about the work of our research integrity team to safeguard the quality of each article we publish.
Find out more
ORIGINAL RESEARCH article
Front. Phys. , 13 June 2022
Sec. Optics and Photonics
Volume 10 - 2022 | https://doi.org/10.3389/fphy.2022.865421
This article is part of the Research Topic Biophotonics for cancer diagnostics and treatment View all 5 articles
 Guo-Sheng Lin1
 Shih-Cheng Tu1Chong-Ian Mok1Tsan-Hsueh Huang1
 Chi-Hau Chen2
 Lin-Hung Wei2,3
 Kung-Bin Sung1,4,5*
Fluorescence spectroscopy has been demonstrated to non-invasively detect changes related to precursors of epithelial cancers, which include decreased fluorescence emission from collagen crosslinks in the connective tissue and increased fluorescence emission from reduced nicotinamide adenine dinucleotide (NADH) in the epithelial tissue. We implemented two-layer forward Monte Carlo models to predict diffuse reflectance and fluorescence intensities at the surface of cervical mucosa given tissue absorption, scattering, and fluorescence properties. The absorption and scattering coefficients of the upper epithelial layer and underlying connective tissue, as well as the epithelial thickness, were estimated from diffuse reflectance spectra using iterative curve fitting. The estimated parameters were used by the fluorescence forward model to obtain quantities needed to relate the intrinsic fluorescence of tissue fluorophores to measured fluorescence intensity. The emission spectra of tissue fluorophores were modeled by skew normal functions, and together with the efficiency of the fluorophores were extracted by fitting the modeled fluorescence spectra to measured spectra using the genetic algorithm. Compared to conventional one-layer forward models, the proposed two-layer models showed significantly smaller errors both in tissue properties estimated from simulated spectra, and in spectral errors of fitting to in-vivo data. Results of a preliminary in-vivo study showed that in seven of eight subjects with histopathologically confirmed dysplasia, the NADH-to-collagen intrinsic fluorescence ratio estimated from the biopsied site was at least two times greater than that estimated from the normal site on the same subject. The ability to more accurately estimate layer-specific intrinsic fluorescence from cervical mucosa could aid the detection of precancers in the cervix as well as other sites including oral and esophageal mucosae.
Fluorescence spectroscopy of in-vivo tissue involves excitation of tissue autofluorescence with ultraviolet to visible light, collection of fluoresce photons at multiple wavelengths from the tissue surface, and analysis of the acquired spectra. It is considered safe if the excitation photon energy and power density are under the maximum permissible exposure value. Results of many in-vivo studies showed differences in the intensity and/or shape of fluorescence emission from mucosa in more accessible organ sites such as in the digestive tract and urogenital system, which may provide useful information for the early detection of epithelial cancers or their precursors [1, 2]. Non-invasively evaluating the possibility of tissue progressing into cancer in the near future is crucial to lowering mortality and improving quality of life for those at high risk because lesions at this precancerous stage are mostly curable.
Major fluorophores in the mucosa that are related to cancerization include reduced nicotinamide adenine dinucleotide (NADH) and flavin adenine dinucleotide (FAD) found predominately in mitochondria of cells, and the structural protein collagen in the lamina propria [3, 4]. The former two are involved in the metabolism of cells. During cancerization epithelial cells increase their metabolism which is correlated with increased NADH and decreased FAD fluorescence levels. The fluorescent collagen crosslinks are degraded and the collagen fluorescence intensity decreases with the progression from normal tissue to precancers [4, 5]. The mucosa at many organ sites is lined with a single layer of epithelial cells, and thus, collagen fluorescence dominates the measured fluorescence intensity from these sites. On the other hand, for mucosa lined with stratified squamous epithelium containing multiple layers of epithelial cells, which include the uterine cervix, oral mucosa and esophagus, the contribution of epithelial fluorophores (i.e., NADH and FAD) to the fluorescence intensity measured at the tissue surface is comparable to that of collagen in the underlying connective tissue. To exploit non-invasive detection of fluorescence spectra as a potential biomarker for precancers in these organ sites, it is desirable to estimate fluorescence emissions originating from the epithelium and the lamina propria separately.
Since the aforementioned fluorophores are embedded within the tissue, fluorescence intensity detected at the tissue surface is inevitably influenced by tissue scattering and absorption properties. To extract the intrinsic fluorescence emission of the fluorophores in tissue, various methods have been proposed and demonstrated (see review article [6]). The main idea is using diffuse reflectance spectra measured with the same apparatus as that used to measure the fluorescence spectra to model and then remove the influences of tissue elastic scattering and absorption properties on the propagations of excitation and fluorescence emission photons in tissue. Many studies have proposed such correction methods based on diffusion approximation of photon propagation in tissue [7], a photon migration model of light propagation in tissue to relate the fluorescence emission to diffuse reflectance [8, 9] or diffusion approximation combined with Beer-Lambert law to account for the attenuation due to photons passing through an upper epithelial layer (10). These methods have been applied to estimating the intrinsic fluorescence emission from in-vivo measurements of mucosa in the esophagus [3], oral cavity [9], uterine cervix [3, 11, 12], and non-melanoma skin cancers [13].
Monte Carlo (MC) simulations of fluorescence excitation and emission processes [14] has the advantage of being flexible and versatile because they can accommodate geometric specifications of any experimental arrangement and tissue heterogeneity. The main drawback of the MC method is the long computational time. Various methods have been proposed to enhance the efficiency of MC simulations for fluorescence such as reverse-emission simulation where one simulation is performed to obtain both excitation and emission processes [15], scaling of photon pathlengths to extend simulation results for one set of scattering and absorption coefficients into other combinations [16]. To extract the intrinsic fluorescence of tissue fluorophores a library or look-up table of parameters related to the photon propagation in tissue is built from pre-simulated results and used to find the best match between the modeled and measured spectra [17, 18]. These methods have been applied to estimate the intensity of NADH fluorescence emission from in-vivo measurements on mice [19], intrinsic fluorescence spectra from surgically removed breast tissue [20], and relative concentrations of a fluorescence dye injected into mice in vivo [19]. In the latter two studies a MC-based iterative curve fitting method has been used to estimate the tissue absorption and scattering coefficients from diffuse reflectance spectra measured with the same fiber-optic apparatus as measuring the fluorescence spectra [21].
Despite extensive phantom validations and numerous in-vivo studies, most of the published papers have implemented methods for extracting intrinsic fluorescence of tissue fluorophores from single-layer or semi-infinite homogeneous tissue models. Since both the structure and chemical composition of the epithelial tissue are different from those of the lamina propria, the scattering and absorption coefficients, respectively, are different between the two types of tissues [22]. These simplified single-layer models may lead to significant errors when they are applied to extracting intrinsic fluorescence from mucosa covered with a stratified squamous epithelial layer that is typically 0.2–0.6 mm thick, because the influence of the epithelial tissue on the detected diffuse reflectance and fluorescence spectra cannot be ignored. A two-layer cervical mucosa tissue model has been proposed by Weber et al. to quantify tissue scattering and absorption coefficients, and concentrations of typical fluorophores from reflectance and fluorescence spectra [11]. The proposed adjoint inverse method has several limitations including the assumption of a fixed epithelial thickness, limited ranges of tissue optical properties tested for validation, and modeling and fitting reflectance spectra with an approximated one-layer diffusion-based model. However, it has been shown that using a simplified single-layer tissue model to fit simulated diffuse reflectance spectra of a multi-layer skin model resulted in significantly larger errors in estimated hemoglobin concentration and oxygen saturation (Figure 8 in [23]). On the other hand, the influence of the single-layer assumption on the accuracy of quantifying the intrinsic fluorescence from mucosa covered with stratified squamous epithelium has not been elucidated.
In this study we aimed to quantify intrinsic fluorescence of layer-specific fluorophores in cervical mucosa from diffuse reflectance spectra and fluorescence spectra measured using the same fiber optic probe. We implemented two-layer MC models of the cervical mucosa for diffuse reflectance and fluorescence spectroscopies, respectively. The optical properties of an upper epithelial layer and underlying lamina propria, as well as the thickness of the epithelium, were estimated from diffuse reflectance spectra using iterative curve fitting [24] accelerated by forward artificial neural network (ANN) models that replaced the original MC forward simulations [25]. The extracted optical properties and epithelial thickness were input into the fluorescence MC model to obtain necessary quantities to relate the intrinsic fluorescence of tissue fluorophores to fluorescence intensity measured at the tissue surface. Intrinsic fluorescence including the spectral shape and efficiency of fluorescence emission for layer-specific fluorophores in the cervical mucosa were estimated by fitting measured fluorescence spectra using the genetic algorithm. A flowchart is shown in Figure 1 to summarize the procedure. The performance of the implemented two-layer intrinsic fluorescence extraction method [26, 27] was evaluated by simulated spectra and compared to results of applying the conventional one-layer assumption for diffuse reflectance and fluorescence spectroscopies. Finally, the proposed method was applied to extracting intrinsic fluorescence of layer-specific fluorophores in vivo from the cervical mucosa of human subjects undergoing colposcopy examination.
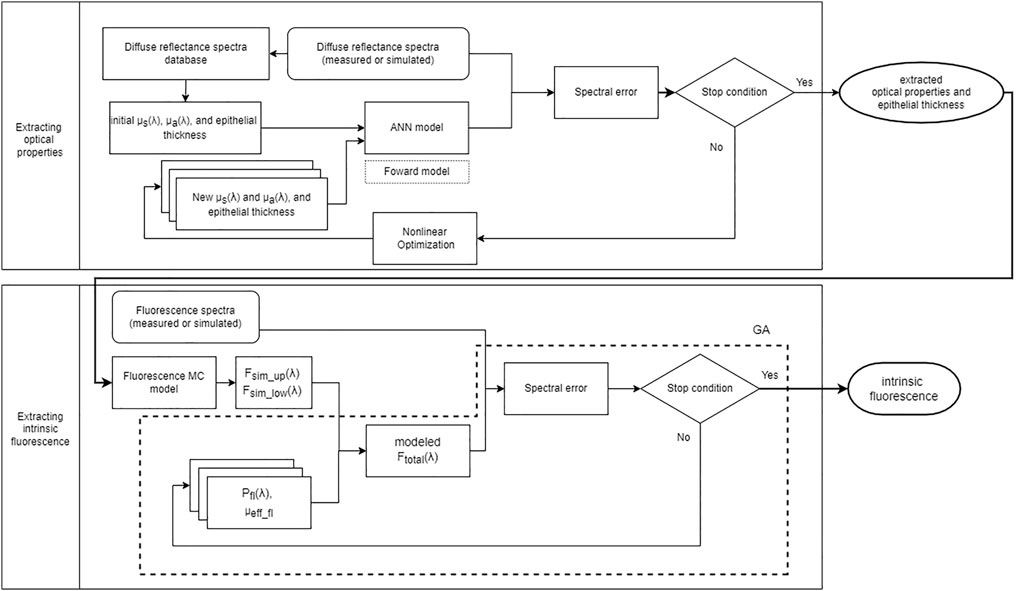
FIGURE 1. Flowchart of the proposed method to extract intrinsic fluorescence. The upper half shows iterative curve fitting to estimate μa(λ), μs(λ) and epithelial thickness of the two-layer cervical mucosa model based on ANN forward models trained with MC simulations. The lower half shows the process to model fluorescence spectra and estimate the efficiency and spectral shape of intrinsic fluorescence using the genetic algorithm (GA).
We constructed a movable system to collect diffuse reflectance and fluorescence spectra from the surface of the uterine cervix in vivo via optical fibers. Multiple source-to-detector separations (SDSs) were used to help the measurement of optical properties at different depths. Since the epithelial layer is thin (less than 0.6 mm) we used fibers with a small diameter of about 0.22 mm to achieve short SDSs and enhance sensitivity to the epithelial tissue and lamina propria in cervical mucosa. A schematic diagram of the system is shown in Figure 2A. A broadband light-emitting diode (Bluloop, Ocean Optics, Inc.) provided the source for diffuse reflectance and an ultraviolet light-emitting diode (M365L2, Thorlabs Inc.) with a central wavelength of 365 nm was used for exciting fluorescence. Three fluorophores considered in this study are collagen crosslinks, NADH, and FAD. The absorption around 365 nm is roughly 50 and 30% of the corresponding maximum values for NADH and FAD, respectively. Collagen crosslinks have broad absorption spectra in the ultraviolet wavelengths. Two mechanical shutters were used to alternate between white light and ultraviolet light illumination. Light paths of the two sources were combined by a dichroic beam splitter and focused into a source fiber (Figure 2B). The source fiber was bundled with six detection fibers and enclosed in a stainless-steel tube with an outer diameter of 6 mm and a length of 21 cm to make a hand-held probe. All the fibers have a nominal core diameter of 0.2 mm and numerical aperture of 0.26. The last 2 cm of the tip of the probe touching the tissue surface was enclosed in a plastic tube to allow slight tilting of the tip so that the fibers’ axes were perpendicular to the tissue surface. The end face of the seven fibers were level and fixed by epoxy to form a line (Figures 2C,D). Three detection fibers were on one side of the source fiber with SDS equal to 0.22, 0.41, and 0.61 mm, respectively. The other three detection fibers were on the other side of the source fiber with SDS equal to 0.215, 0.45, 0.73 mm, respectively (Figures 2D,E). The other end of the six detection fibers were arranged in a line with a dummy fiber between two adjacent detection fibers and epoxied into a rectangular acrylic block (Figure 2B). The end face of the detection fibers was imaged onto the entrance slit of an imaging spectrograph (SP-2150i, Princeton Instruments) and spectra were acquired by a complementary metal-oxide-semiconductor camera (GS3-U3-23S6M-C, Point Grey). A long-pass filter with a cutoff wavelength of 400 nm was placed before the entrance slit to block the excitation light from the ultraviolet source during the measurement of fluorescence spectra. Fluorescence spectra were measured and analyzed in the wavelength range of 408–650 nm, which covers expected emission spectra of collagen crosslinks, NADH, and FAD in the ranges of 380–470 nm, 400–520 nm, and 500–600 nm, respectively. The optical components plus a computer, a monitor, and an isolation transformer were enclosed in a three-rack utility cart (Figure 2F).
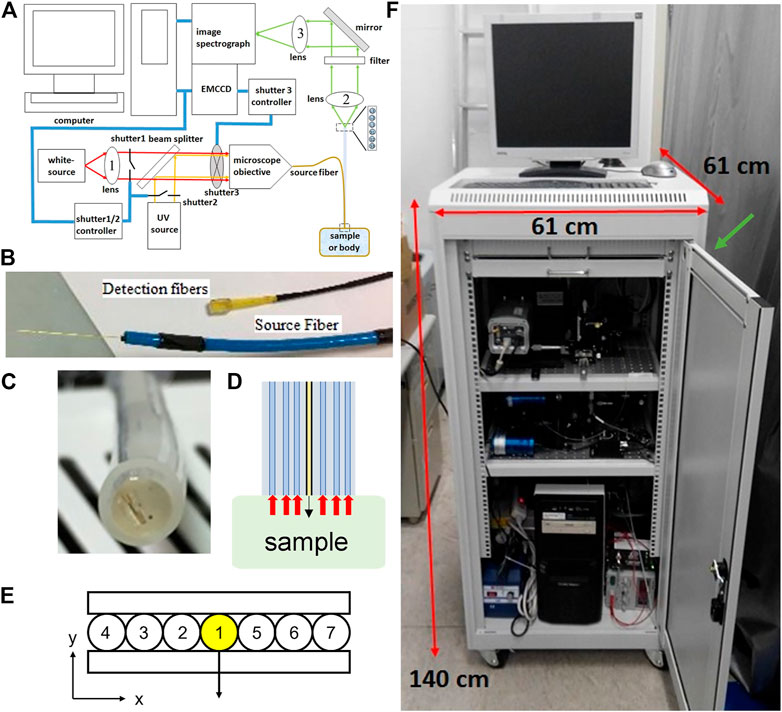
FIGURE 2. (A) A schematic diagram of the spectroscopy system used (B) A photograph of the source fiber and detection fibers at the system end (C) A photograph of the end surface of the probe at the tissue/sample end (D) The probe side view interacts with the sample (E) A schematic diagram showing the arrangement of a source fiber (#1), three detection fibers (#2-#4) with SDS of 0.22, 0.41, and 0.61 mm respectively to the left of the source fiber, and another three detection fibers (#5-#7) with SDS of 0.215, 0.45, 0.73 mm respectively to the right of the source fiber (F) A photograph of the custom-built movable spectroscopy system. A green arrow indicates the location where the probes come out of the cart.
We implemented a two-layer tissue model using MC simulations accelerated by graphics processing units (GPUs) [28]. The modified code has been verified by good matches between our results and those obtained with the original code using the same optical properties, and is available at https://github.com/kaoben2731/MCML_GPU. The upper layer representing the epithelial layer had a thickness between 0.1 and 0.6 mm. The lower layer was assumed semi-infinite in thickness. All optical properties were assumed to be uniform within each layer. The absorption coefficients (μa) were expressed as functions of wavelength depending on absorbing substances in the corresponding tissue. In the epithelial layer the absorption is mainly due to proteins and nucleotides. We set μa(λ) of the epithelial layer to be fixed according to values experimentally measured from epithelial cells [29]. The μa(λ) of the lamina propria was assumed to be
where MWHb is the average molecular weight of hemoglobin, CHb is the concentration (g/L) and St O 2 is the oxygen saturation of hemoglobin in tissue, εoxyHb(λ) and εHb(λ) are molar extinction coefficients of oxyhemoglobin and deoxyhemoglobin respectively [30], CCol is the volume fraction of collagen in tissue, and μa_Col(λ) is the absorption coefficient of 100% collagen [31]. The scattering coefficient (μs) of bulk tissue has been typically expressed and measured in terms of the reduced or transport scattering coefficient (μs’) which is related to μs by
where A is related to the density or strength of scattering objects and K is related to the structure and size of the scattering objects in tissue. Using the wavelength dependences of μa(λ) and μs′(λ) enables the analysis of broadband spectra with a fixed number of unknown parameters, and enhances the robustness of fitting [32]. The refractive index of both epithelial and lamina propria layers was assumed to be 1.4. The scattering phase function of the epithelial layer was adopted from [33] which estimated the scattering phase function of cervical nuclei by finite-difference time-domain simulations. The anisotropy factor corresponding to this scattering phase function was 0.94. Our own investigations using finite-difference time-domain simulations found a similar scattering phase function from epithelial cells [34]. For the lower layer the conventional Henyey-Greenstein phase function was used with g = 0.885 [35].
The spatially resolved diffuse reflectance that could be measured by the system described in Section 2.1 was modeled by modifying multi-layered MC code implemented to run with GPUs [28]. Initial location and direction of photon packets were randomly sampled from the area of the source fiber and the angular range corresponding to the fiber numerical aperture, respectively. When photon packets reached tissue surface after going through scattering and absorption events in tissue, they were detected if the radial location was within the radial range of a detection fiber, and the exit direction was within the acceptance angle of the fibers. To further improve the speed of the forward MC model which obtained diffuse reflectance given μa_up, μa_low, μs_up, μs_low, and Th, we trained artificial neural networks (ANNs) according to [25]. A separate ANN model was trained for each detection fiber since the spatially resolved reflectance varies substantially across the used SDSs. We used MC simulations to generate 45,000 sets of reflectance data with randomly chosen values of the five parameters. Ranges for μa_up, μa_low, μs_up, μs_low, and Th are 0.16–5 cm−1, 0.05–117 cm−1, 13–990 cm−1, 13–820 cm−1, and 0.09–0.62 mm, respectively. The ranges were determined using direct MC simulations in iterative curve fitting of selected in-vivo diffuse reflectance spectra which presented the highest or lowest intensity among the acquired spectra. We used Neural Network Toolbox in Matlab® (The MathWorks, Inc.) to train fully connected networks with two hidden layers, each consisting of 150 neurons. The pre-simulated reflectance data were split into 70, 15, and 15% for training, validation, and testing.
Unknown parameters to be extracted from diffuse reflectance spectra included one set of A and K for each layer, CHb, StO2, and the thickness of the upper layer (Th). Iterative curve fitting was used to find the set of unknown parameters that resulted in the smallest root-mean-square error between modeled spectra and measured spectra [24]. A nonlinear least square solver, fmincon, provided in Matlab® was used because it allowed setting constraints on A and K values so that the corresponding μs_up and μs_low were within the ranges set for building the ANN models. The parameter K for the upper and lower layer was constrained to be within 0.2–1.8 and 0.3–1.8, respectively. In addition, CHb, St O 2, and Th were restricted within the ranges of 0.4–6.0 g/L, 50%–100%, and 0.1–0.6 mm, respectively. The ranges of μs′(λ) searched in the iterative curve fitting are illustrated in Figure 3. Since iterative curve fitting results highly depend on initial values of target parameters, we generated a database of diffuse reflectance spectra using uniformly sampled values of the target parameters. Each set of target spectra, simulated (Section 2.4) or experimentally measured, was compared to the database to select five sets of target parameters that resulted in the smallest spectral errors. Iterative curve fitting was performed five times using the five sets of parameters from the database as initial values. The fitting results with the smallest root-mean-square spectral error was taken as the extracted optical parameters.
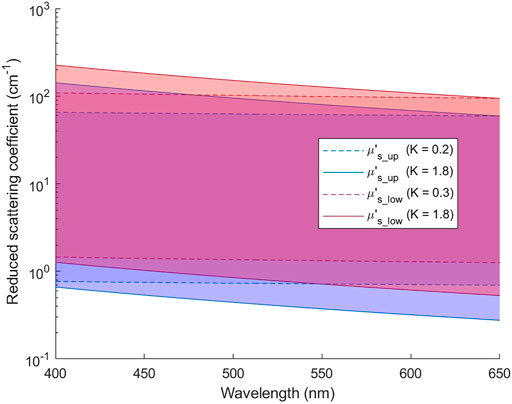
FIGURE 3. Ranges of μs′(λ) for the upper and lower layers that are covered in the iterative curve fitting of reflectance spectra.
The fluorescence process involves the excitation of a fluorophore to a higher electronic energy state by an excitation photon, and the subsequent emission of a fluorescence photon where the probability of emission is called quantum yield. When fluorophores in tissue are concerned, the propagation of both the excitation photon and the emitted photon is typically treated with the radiative transport theory for quantitative analysis [36]. Here the numerical modeling method, MC simulations, of radiative transport is adopted for its accuracy and versatility over the diffusion approximation. Since the property of a fluorophore, or the intrinsic fluorescence, is independent of the surrounding tissue or the hardware arrangement, it can be separated from the parts that describe the propagations of excitation and emitted photons in tissue [16, 17]. If the geometry and the scattering and absorption coefficients of the tissue are known, one can perform MC simulations to model the fluorescence spectrum that can be detected by a given detector setup. Then, the intrinsic fluorescence of tissue fluorophores can be determined by fitting the modeled fluorescence spectrum to the experimentally measured spectrum, which is typically referred to as an inverse problem.
The fluorescence MC simulations were performed using a custom-written program that utilized GPUs for acceleration. The code is available on GitHub (https://github.com/md703/MCF_GPU). The in-house developed code was verified by performing simulations using optical coefficients listed in Table 1 and Table 2 in [15]. The errors were less than 1.3%. We used the absorption coefficient (μa) and scattering coefficient (μs) for the excitation wavelength, λx, to track the random walk of a fixed-weight excitation photon in tissue. If the photon was absorbed, we assumed that a fluorescence photon with an initial weight of one was emitted isotropically from the site of absorption and started tracking the random walk of the emitted photon using μa and μs for the emission wavelength λm. To reduce the variance of simulations, the weight of the emitted photon was attenuated by a factor of μs/(μs+μa) at each scattering event and terminated by the Russian-roulette technique. The weight of an emitted photon reaching a detector within its acceptance angle was recorded. The sum of all detected photon weights was divided by the total number of launched excitation photons to get the simulated fluorescence signal, Fsim. The tracking of emitted fluorescence photons was repeated for each emission wavelength in the range of interest to produce a spectrum Fsim (λm). The total number of launched excitation photons was 108, which resulted in a coefficient of variation about 1.5% over five repeated simulations with 108 photons each.
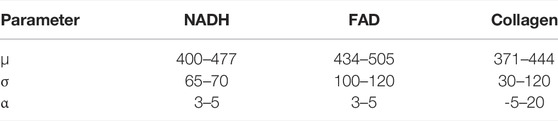
TABLE 1. Ranges of parameters used in the skew normal functions to produce fluorescence emission spectrum.
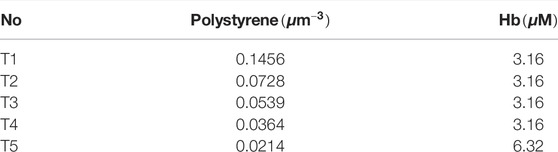
TABLE 2. Concentrations of the materials to construct calibration phantoms for reflectance.
The fluorescence MC simulation results (Fsim) can be related to the experimentally detected fluorescence spectrum at the tissue surface as
where μa_fl and μa_all denote μa of a fluorophore and the tissue respectively, ϕfl is a scaler representing the quantum yield, and Pfl (λm) is a probability distribution function representing the shape of the emission spectrum of the fluorophore. Since only one light source was used to excite the tissue fluorophores, we assumed a constant excitation wavelength in the simulations, and thus λx was omitted from Fsim and Fmeas. To improve the simulation efficiency, a fluorescence photon was initiated every time an excitation photon was absorbed in tissue. In actual experiments, however, only a fraction of the absorbed excitation photons was absorbed by a fluorophore, and only a fraction of the absorbed photons was converted into fluorescence emission (i.e., quantum yield) by the fluorophore. Therefore, factors were added to Eq. [3] to account for these discrepancies. The intrinsic fluorescence as expressed in Eq. [3] comprises two parts: the strength or intensity of the emission, and the shape of the emission spectrum. The former is a scaler consisting of two parameters that can be combined into one parameter, namely fluorescence efficiency [10].
since μa and the quantum yield of the fluorophore in tissue cannot be quantified individually from the measured fluorescence intensity.
For multi-layer tissue models such as the two-layer cervical mucosa model described here, contributions of layer-specific fluorophores to the detected fluorescence at the tissue surface can be expressed as
by combining Eqs. [3, 4] while taking NADH in the upper layer and collagen in the lower layer as examples. Fsim_up and Fsim_low is the simulated fluorescence signal originated from the absorption of excitation photons in the upper and lower layer, respectively; μa_up and μa_low are the tissue absorption coefficients of the upper and lower layer, respectively. Finally, the total fluorescence intensity measured at the tissue surface is obtained by summing contributions from all of the major tissue fluorophores
where FFAD represents the contribution of FAD in the epithelial layer.
Major fluorophores considered in this study included NADH and FAD in the upper layer and collagen crosslinks in the lower layer. The shape and peak wavelength of intrinsic fluorescence spectra of NADH in tissue have been shown to be different from those measured on purified molecules in vitro [3, 10, 37, 38]. In addition, the major source of fluorescence in the lamina propria, collagen crosslinks, have been shown to have various spectral characteristics depending on its specific conformation [3, 4, 10, 37, 39]. To encompass variations in fluorescence emission spectra in tissue environment we used the skew normal distribution to model the shape of intrinsic fluorescence spectra [40]
where ϕ(·) is the standard normal probability density function, μ is the mean, σ is the standard deviation, α is a shape parameter, and Φ(·) is the cumulative distribution function of ϕ(·). When α is positive the function is right skewed and resembles typical fluorescence emission spectra. Ranges of the parameters used are listed in Table 1. To give an idea of the spectral shape used to model fluorescence emission spectra, Figures 4A,B show the skew normal functions with each of the three parameters (μ, σ, α) set at its upper or lower bound for modeling NADH and FAD, respectively. Finally, the sum of the skew normal functions within the wavelength range of 408–650 nm was normalized to one to produce the probability distribution function Pfl (λm) introduced in Eq. [3].
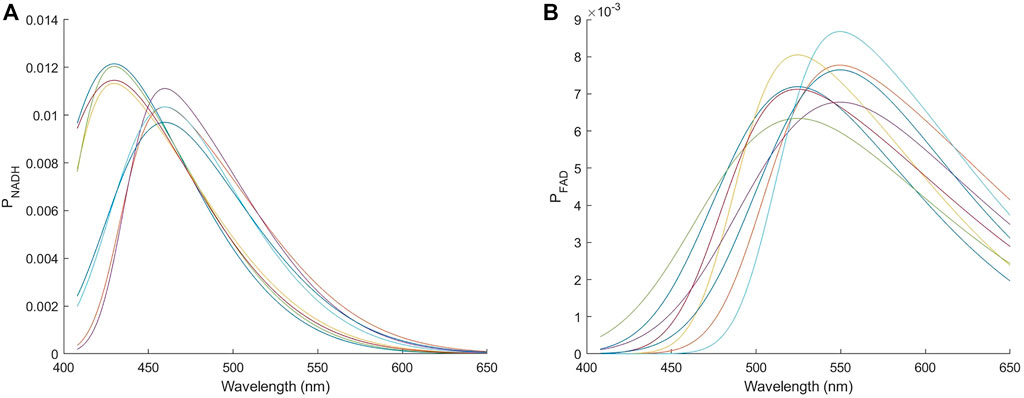
FIGURE 4. Skew normal distributions used to model the emission spectrum of (A) NADH and (B) FAD. The eight curves in each panel correspond to each of the three parameters (μ, σ, α) being set to either the upper or the lower bound.
To extract the intrinsic fluorescence of layer-specific fluorophores, unknown parameters to be determined included the fluorescence efficiency (Εfl) and the three parameters (μ, σ, α) defining the shape of fluorescence spectrum for each fluorophore. We adopted the genetic algorithm to minimize the error between modeled and measured fluorescence spectra at three SDSs due to its ability to find a global minimum and efficiency for a larger number of unknowns than those extracted from diffuse reflectance spectra. We used the genetic algorithm tool provided by Matlab® with a population size of 5,000 and 150 maximum generations.
The proposed method to extract tissue layer-specific intrinsic fluorescence was validated with simulated spectra with noise levels similar to actual experiments. Since the two sets of detection fibers have similar SDSs the theoretical investigations were only conducted using detection fibers #2-#4 (SDS equal to 0.22, 0.41, and 0.61 mm respectively). Two numerical investigations were performed: [1] evaluating the accuracy of extracted fluorescence efficiency and spectral shape of three major fluorophores described in Eq. [7], and [2] comparison with a single-layer tissue model on the accuracy of estimating tissue parameters, intrinsic fluorescence, and fluorescence contribution ratio between NADH and collagen. In the first investigation we randomly chose 100 sets of parameters to generate diffuse reflectance spectra and fluorescence spectra using MC simulations. The corresponding μa(λ) and μs(λ) were within the ranges used for building ANN diffuse reflectance models (Section 2.2.2). Ranges of the intrinsic fluorescence efficiency were 0.1–2, 0.018–0.2, and 0.1–2 cm−1 for NADH, FAD, and collagen, respectively. Noise levels were estimated from measurements on tissue mimicking phantoms with signal intensities similar to in-vivo tissue. Random noise with a normal distribution and standard deviations of 2, 1.5, and 1% with respect to the simulated intensity was added to simulated spectra for SDS equal to 0.22, 0.41, and 0.61 mm, respectively.
The purpose of the second investigation was to determine whether using the proposed two-layer model provides more accurate estimation of intrinsic fluorescence relevant to the detection of precancers in cervical mucosa than conventional single-layer models. Previous studies have shown increased NADH and decreased collagen fluorescence in precancerous lesions of the cervix [4, 41]. Since existing research has assumed homogeneous distributions of fluorophores, as a benchmark we applied single-layer forward DRS and fluorescence models in iterative curve fitting and genetic algorithm respectively to extract the intrinsic fluorescence from diffuse reflectance and fluorescence spectra simulated using two-layer tissue models. To compare performance between two-layer and one-layer tissue models, the ratio of NADH to collagen fluorescence intensity contribution was used as a quantitative indicator to represent tissue intrinsic fluorescence relevant to detection of precancers.
In the single-layer forward DRS model, unknown parameters to be determined included one set of A and K, CHb, StO2, and anisotropy factor g. The μa(λ) of the tissue was calculated using Eq. [1], which was the same as the lower layer in the two-layer model since the epithelial layer was relatively thin and transparent. The Henyey-Greestein scattering phase function was used in MC simulations and the anisotropy factor was used as an additional unknown parameter to improve the fit to simulated spectra generated by two-layer tissue models. ANN models were trained to replace forward DRS MC simulations as described in Section 2.2.2. Ranges of input parameters μa, μs, and g were 0.01–120 cm−1, 30–1,290 cm−1, and 0.7–0.99 respectively. In the single-layer fluorescence model the two fluorophores NADH and collagen were assumed to be uniformly distributed. That is, the same Fsim (λm) and tissue μa (λx) were used for both fluorophores in Eqs. [5, 6].
The spectral response of any spectroscopy system is not uniform and needs to be corrected for quantitative analysis of measured spectra. In addition, MC simulation results are expressed as the fraction of detected photon energy out of total injected photon energy, which are both difficult to measure directly.
For calibration of diffuse reflectance spectra, we prepared liquid tissue mimicking phantoms with polystyrene microspheres (0.5 μm Polybead®, Polysciences Inc.) as the scattering source and hemoglobin (H0267, Sigma Aldrich Inc.) to provide absorption spectral features similar to mucosa. The scattering coefficient μs(λ) and phase function of the phantoms were calculated based on Mie theory. The absorption coefficient μa(λ) of hemoglobin solution before mixing with microspheres was measured using a commercial ultraviolet-visible spectrophotometer. Concentrations of the materials to construct the phantoms are listed in Table 2. The μa(λ), μs(λ), and scattering phase function were input into the implemented DRS MC software to obtain diffuse reflectance spectra. The phantoms were measured with the constructed spectroscopy system and a linear calibration equation between the measured and modeled reflectance was obtained using least squares regression for each combination of wavelength and SDS [42, 43].
A similar procedure was used to calibrate experimentally measured fluorescence spectra. We prepared aqueous phantoms with the same types of polystyrene microspheres and hemoglobin as in DRS phantoms, and fluorescent dyes fluorescein (F6377, Sigma-Aldrich Inc.) and stilbene (Stilbene 420, Exciton Inc.). Concentrations of the materials are summarized in Table 3. Fluorescence spectra were simulated by the implemented fluorescence MC code, and linear calibration factors were obtained for each combination of wavelength and SDS.
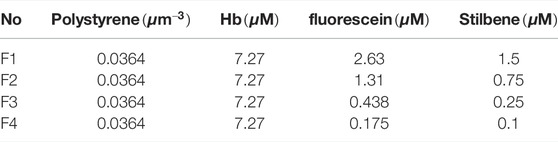
TABLE 3. Concentrations of materials to construct calibration phantoms for fluorescence.
Previously, the spectroscopy system, calibration procedure, and fluorescence MC simulation code have been verified by measuring a set of homogeneous liquid phantoms and comparing the calibrated fluorescence spectra to modeled spectra. Another set of homogeneous liquid phantoms containing two fluorophores with known emission spectra and concentrations has been measured to validate the proposed method’s ability to quantify fluorophore efficiency via iterative curve fitting of diffuse reflectance spectra to estimate μa(λ) and μs(λ), running fluorescence MC simulations with the estimated μa(λ) and μs(λ), and calculating fluorophore efficiencies of the two fluorophores using least squares regression of Eq. [3], assuming that Pfl (λm) and ϕfl are known. Details of the phantom validation experiments are in the Supplementary Material.
A clinical study was conducted at National Taiwan University Hospital to measure diffuse reflectance and fluorescence spectra from subjects enrolling in colposcopy examination. The study was approved by a Research Ethics Committee of National Taiwan University Hospital, and informed consent was obtained by all participants. During regular colposcopy examination the attending physician (CC) applied acetic acid to the cervix and inspected the appearance of the mucosa. A tissue site suspicious of dysplasia was measured by gently placing the fabricated probe on the tissue surface with a pressure of about 6 kPa. Another location appearing normal to the physician was measured as a control. The measured reflectance intensity under the probe pressure of 6 kPa was estimated to increase by about 6% compared to when no pressure was applied. Three diffuse reflectance spectra and three fluorescence spectra were measured from each location. Spectra measured from the same location were averaged after outlier, if any, was removed. The suspicious tissue site was biopsied and sent for histopathological examination as a routine procedure.
Both the ANN models to calculate diffuse reflectance for one-layer and two-layer tissue models showed errors less than 2% as compared to MC simulated values. Since this level of deviation to MC simulations was comparable to the random noise in experimental data, the ANN forward models were considered sufficiently accurate. The results of fitting the 100 sets of simulated reflectance spectra showed root-mean-square spectral errors of 1.9 and 1.7% for the one-layer and two-layer tissue model, respectively. The spectral errors were no more than the deviation of ANN-predicted reflectance to MC simulated values. Therefore, we conclude that the iterative curve fitting was successful and did not introduce additional errors. Finally, the errors of estimated μs′_up(λ), μs′_low(λ), CHb, StO2, and Th using the two-layer model were 8.1, 5.0, 13.3, 2.4, and 6.6%, respectively. The errors of estimated μs′(λ), CHb, and StO2 using the one-layer model were 3.4,10.9, and 3.4%, respectively. These results are close to errors reported in a previous simulation study [24], which verifies the implementation of the models to accurately extract two-layer tissue optical parameters and the upper layer thickness from spatially-resolved reflectance spectra.
In the results of extracting intrinsic fluorescence from the 100 sets of simulated fluorescence spectra, the mean errors in extracted fluorescence efficiency were 19, 114, and 32% for NADH, FAD, and collagen respectively for the two-layer model. The accuracy of extracting the shape of intrinsic fluorescence spectrum Pfl(λ) was evaluated by calculating the Pearson correlation coefficient between the fitting result and the one chosen to generate the simulated target spectra. The resultant correlation coefficients were 0.98, 0.91, and 0.96 for NADH, FAD, and collagen respectively. The errors in extracted FAD fluorescence efficiency were relatively high due to a much smaller fraction (7 ± 5%) of FAD efficiency to the total fluorescence efficiency than the other two fluorophores. For cases with FAD’s fraction above 5% the mean and standard deviation of absolute percent errors in FAD’s fluorescence efficiency reduced significantly to 27 ± 21%.
Figure 5 compares the errors of extracted tissue optical parameters by the one-layer and two-layer inverse models from 37 sets of target spectra simulated using the two-layer tissue model. The preset tissue optical parameters to generate the target simulated spectra were taken from results of fitting in-vivo spectra described in Section 3.2. This was to provide spectra that were actually measured from cervical mucosa in vivo. The results show that the one-layer inverse model produced much larger errors than the two-layer model in all parameters. In the results of the one-layer model, the extracted μs′(λ) had a root-mean-square error of 40.1% as compared to the target μs′_up(λ), and a root-mean-square error of 23.8% as compared to the target μs′_low(λ). The μs′(λ) extracted by the one-layer forward model was closer to the target μs′_low(λ). This is expected because the upper layer was thin and the detected reflectance spectra were more sensitive to the lower layer. It should be noted that CHb extracted by the one-layer model were always underestimated, which was also expected because hemoglobin was assumed to be uniformly distributed in the one-layer model while in actual cervical mucosa it mainly existed in the connective tissue underneath a bloodless epithelial layer.
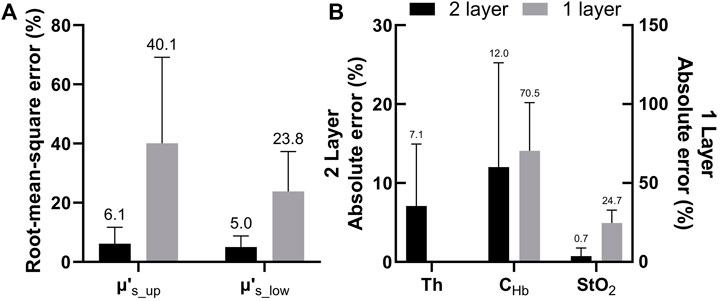
FIGURE 5. (A) Comparison between errors of μs′(λ) estimated by the two-layer and one-layer forward models. The errors were calculated as root-mean-square percentages across the analyzed wavelength range (B) Absolute percent errors of extracted Th and CHb and absolute errors of extracted StO2 obtained by the two-layer forward model. Errors of the latter two parameters estimated by the one-layer forward model are also shown for comparison.
The errors of extracted fluorescence efficiency and the correlation coefficient between extracted and preset fluorescence spectra shape functions are shown in Figures 6A,B, respectively. In particular, the errors in fluorescence efficiency of NADH and collagen estimated by the one-layer model were at least seven times higher than those by the two-layer model. The result indicates that the epithelial layer should be considered in the estimation of the intrinsic fluorescence intensity. On the other hand, the shape of fluorescence spectra, Pfl(λ), extracted by the one-layer model was not too far off. The relatively inaccurate estimation of both fluorescence efficiency and spectra shape of FAD by the two-layer model was due to a relatively low fraction of FAD to the total intrinsic fluorescence efficiency, as described in Section 3.1.1. In nine of the 37 sets of spectra where the FAD fraction was higher than 5%, the correlation coefficient increased drastically to 0.94 in the two-layer results while the one-layer results increased only slightly to 0.86. Similarly, the errors in extracted fluorescence efficiency of FAD by the two-layer model reduced from 51% as shown in Figure 6A to 8.5 ± 6.5%, and errors by the one-layer model increased to 86% when only the nine sets of spectra were considered.
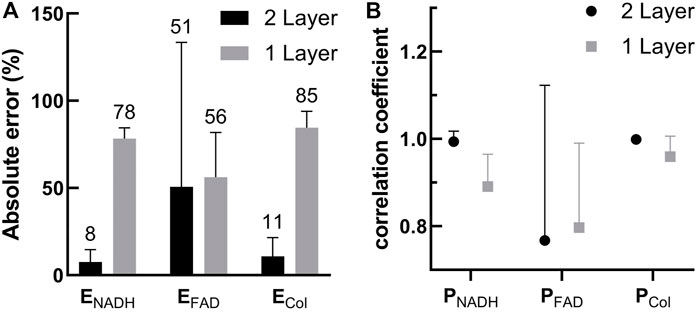
FIGURE 6. (A) Comparison between errors in the fluorescence efficiency of the three fluorophores extracted by the two-layer and one-layer forward models (B) Correlation coefficients between the extracted Pfl(λ) and the Pfl(λ) used to generate the target spectra. Results for the three fluorophores obtained using the two-layer and one-layer forward models are plotted for comparison.
In the second investigation described in Section 2.4, we aimed to analyze the effect of simplifying cervical tissue with a one-layer model on the accuracy of the estimated fluorescence intensity ratios between NADH and collagen, and compare the results to using the two-layer model. To generate test spectra we used MC codes and the same 37 sets of optical parameters derived from in-vivo data to simulate target spectra with the NADH-to-collagen intensity ratio for detection fiber #2 (SDS = 0.22 mm) adjusted to be 0.25 and 1 to represent normal and precancerous cervical mucosa, respectively [44]. The mean and standard deviation of extracted NADH-to-collagen intensity ratio from the simulated reflectance and fluorescence spectra are shown in Figure 7A (simulated intensity ratio = 0.25) and Figure 7B (simulated intensity ratio = 1). Overall, results of the two-layer model had smaller errors and narrower standard deviations than those of the one-layer model. The ground truth values shown in dashed gray lines decrease with SDS because detectors at longer SDSs are more sensitive to collagen in the lower layer. Results of the two-layer model, shown in black circles, also decreased with SDS. The one-layer model, on the other hand, did not show a similar trend since the fluorophores were assumed to be uniformly distributed in the tissue. The mean and standard deviations of absolute errors corresponding to Figures 7A,B are summarized in Figures 7C,D, respectively.
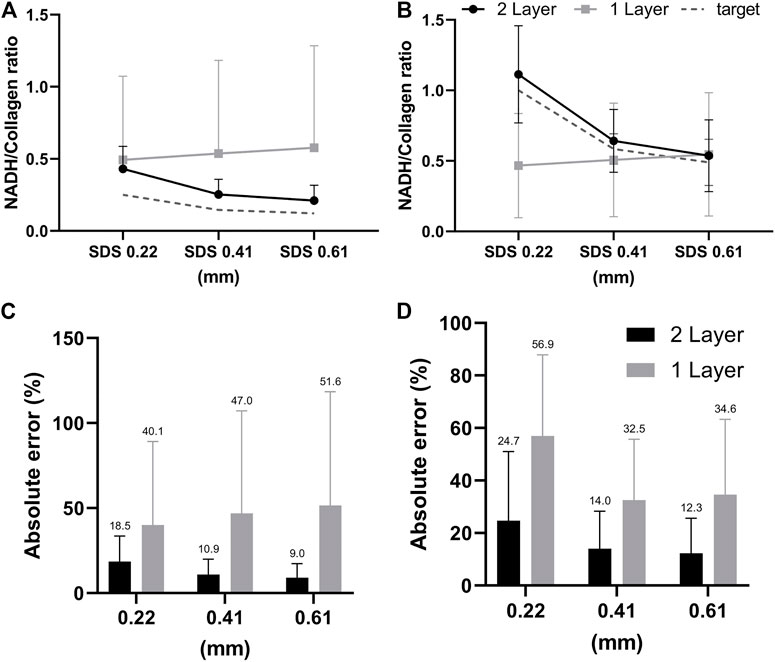
FIGURE 7. (A,B) Comparisons between the two-layer and one-layer models in extracted contribution of collagen to the total detected fluorescence intensity. Gray dashed lines indicate the ground truth values in the simulated target fluorescence spectra which is 80% in (A) and 50% in (B) for SDS = 0.22 mm. Panels (C,D) show the absolute errors in extracted collagen contributions corresponding to panels (A,B), respectively.
Twenty-seven subjects were recruited in this study. No biopsy was taken from four subjects. Acquisition of spectra was not successful on five of the subjects due to system malfunction or mistakes by the operator, and on one subject due to bleeding before probe placement. Spectra from the remaining 17 subjects were analyzed. Good matches between modeled and measured spectra were achieved in both biopsied and normal sites for 12 subjects, and results presented in this paper are from these 12 subjects. For the other five subjects, curve fitting results of diffuse reflectance spectra showed large errors in the spectral bands corresponding to hemoglobin absorption (i.e., 414–423 nm and 530–590 nm). It was suspected that excessive blood in the surface or superficial tissue caused significant mismatch between the modeled and measured spectra. Therefore, spectra from these five subjects were excluded from subsequent analysis. An example of the fitting results is illustrated in Figure 8A for reflectance spectra and Figure 8B for fluorescence spectra. In both spectroscopic data the fitting results by the two-layer forward model showed smaller root-mean-square spectral errors than those by the one-layer forward model. For all spectra included in the analysis, the average spectral error was 10 and 19% in reflectance spectra using the two-layer and one-layer model, respectively. The average spectral error in fluorescence spectra was 14 and 22% using the two-layer and one-layer model, respectively. We performed Student’s t-test and F-test to analyze the spectral errors of fluorescence fitting results between the two-layer and the one-layer forward models. The p-value is less than 0.0001 on Student’s t-test and less than 0.05 on F-test, indicating that the two-layer forward model performed significantly better than the one-layer model to match measured spectra. The diagnostic results based on histopathology for the 12 subjects were two subjects as non-dysplasia, two subjects with inflammation, two subjects with mild cervical intraepithelial neoplasia (CIN1), and six subjects with moderate to severe cervical intraepithelial neoplasia (CIN2 to CIN3). To investigate the potential of the extracted intrinsic fluorescence as a biomarker for cervical precancers, CIN, we calculated the ratio of intrinsic fluorescence efficiency between NADH and collagen (ΕNADH/ΕCol) for each measured site [3]. Due to high inter-subject variations we normalized the ΕNADH/ΕCol calculated from the biopsied site by that calculated from the normal site on the same subject [12]. The results, grouped according to diagnostic results, are shown in Figure 9A. All except one of the CIN sites showed a ratio above 2, and all of the four non-CIN sites showed a ratio below 2. This result agrees with the findings in the literature that cervical precancers are associated with increased NADH and decrease collagen fluorescence. On the other hand, fluorescence efficiency results obtained using the one-layer forward model were processed in the same way. As shown in Figure 9B, most of the CIN sites showed a ratio comparable to those of the non-CIN sites. Therefore, the one-layer results were unable to distinguish subjects with CIN based on the fluorescence efficiency ratio between NADH and collagen. The intrinsic spectral shape of the three fluorophores extracted from in-vivo spectra are shown in Figure 10. Results of the two non-dysplasia sites were combined with all of the normal sites in plotting the spectra. There were small redshifts in the spectra of NADH where the peak wavelength went from 441 nm in normal tissue to 450 nm in CIN tissue. These intrinsic spectral shapes may be used as basis functions or initial guesses for future studies aimed at quantifying intrinsic fluorescence from tissue.
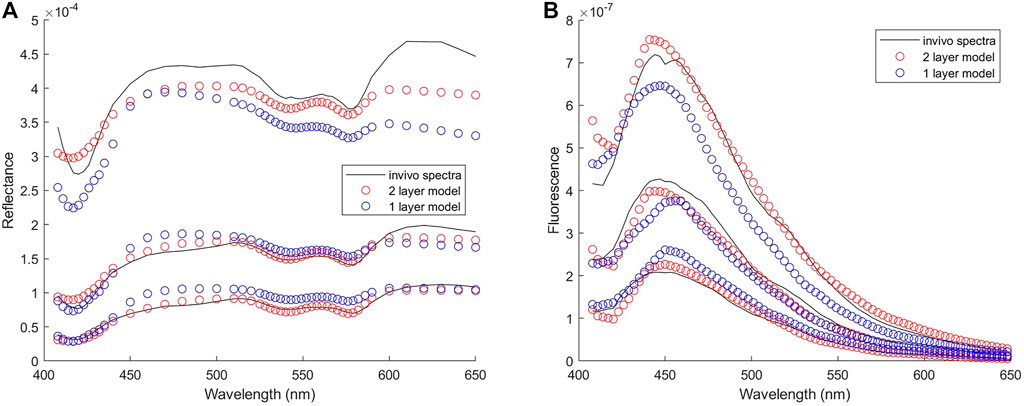
FIGURE 8. Results of fitting one set of in-vivo spectra (A) Reflectance spectra with spectral errors of 7 and 14% in the results of two-layer and one-layer forward model, respectively (B) Fluorescence spectra with spectral errors of 12 and 21% in the results of two-layer and one-layer forward model, respectively. Three spectra from the strongest to the weakest in each group represent the spectrum measured at the SDS of 0.22, 0.41, and 0.61 mm, respectively.
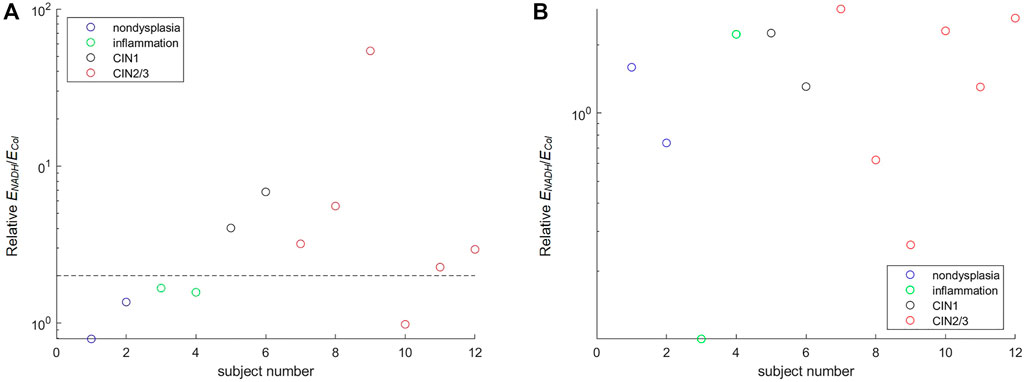
FIGURE 9. Ratio of NADH to collagen fluorescence efficiency extracted from in-vivo spectra. The ratio extracted from the colposcopically suspicious (biopsied) site is normalized by that from the normal site on the same subject (A) The result of the two-layer forward model with a dashed horizontal line drawn at a value of two to separate CIN from non-CIN subjects (B) The result of the one-layer forward model.
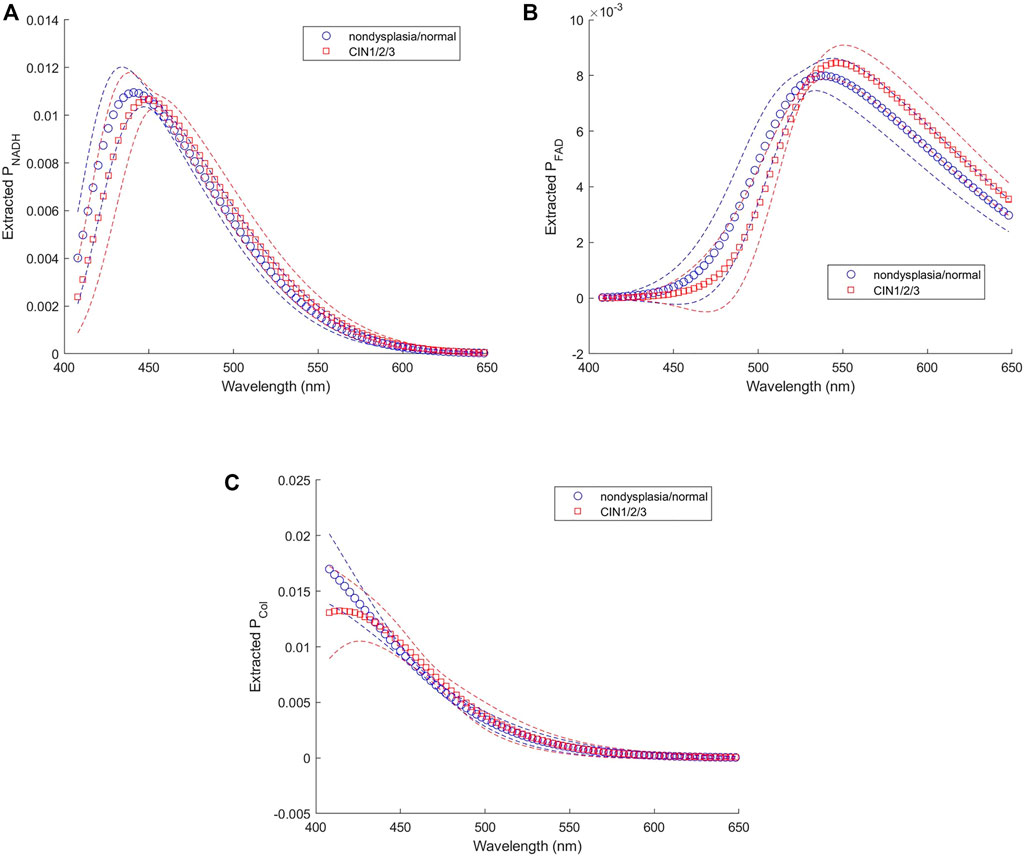
FIGURE 10. Intrinsic fluorescence spectra of (A) NADH, (B) FAD, and (C) collagen extracted from in-vivo data.
Previous studies using MC models to extract intrinsic fluorescence from superficial tissues have built and stored look-up tables to store the absorption distribution of excitation photons and the emission probability distribution, and performed convolution integral once tissue scattering and absorption coefficients are extracted from in-vivo DRS measurements [18, 19]. The two-dimensional convolution integral is time consuming and prevents real-time recovery of intrinsic fluorescence. Great improvements in speed have been achieved by combining effects of the excitation and emission paths into one function using pathlengths [17], or by building a four-dimensional look-up table indexed with scattering and absorption coefficients for both excitation and emission wavelengths [45]. However, these approaches are not suitable to be extended to tissue models with two or more layers due to impractically high computational costs to build, store, and search tables with very high dimensions. We took the direct approach to perform fluorescence MC simulations with the help of GPU’s parallel computing capability. Compared to forward models using look-up tables, our approach does not require interpolation or approximation, and hence, avoids additional errors in the forward model. The time needed to perform fluorescence MC simulations to generate Fsim(λ) consisting of 26 wavelengths was about 5 mins. This time could be readily reduced by three orders of magnitude using ANN models to replace the MC simulations [25].
Using multiple distances between the detector and the source is a useful approach to enhance the sensitivity of spectroscopy techniques to tissue optical properties at various depths [46, 47]. The ability of this spatially-resolved measurement to discriminate fluorescence emission originating from two-layered tissues such as cervical mucosa is demonstrated in Figure 6. As expected, there is an increased collagen contribution to measured fluorescence intensity with increased SDSs. One-layer model does not consider layer-specific fluorophores, that is, NADH and FAD in the upper layer (epithelial tissue), and collagen in the lower layer (supporting connective tissue). Therefore, the relative collagen contribution to the fluorescence intensity measured at the three SDSs remains approximately constant as shown in Figures 7A,B. In addition to larger errors in the extracted fractional contribution of collagen, the fitting results of the one-layer model also show larger spectral errors, indicating a mismatch between the assumed one-layer model to solve the inverse problem and the actual structure from which target spectra are derived. Results of fitting in-vivo fluorescence spectra using one-layer tissue model also show significantly larger spectral errors than using the proposed two-layer mucosal tissue model (Figure 8B). This finding is not surprising and agrees with published studies on the modeling of diffuse reflectance spectra of the skin [23, 48]. Although the proposed two-layer model improves the quantification of layer-specific fluorescence, the actual tissue structure is more heterogeneous and different from the assumption in this study. For example, blood is in vessels and capillaries, not homogeneously distributed in the lamina propria. Probe-based spectroscopy techniques that measure diffusely reflected photons or multiply scattered fluorescence emission photons are limited in spatial resolution. Therefore, the estimated hemoglobin concentration is a bulk average concentration in the tissue region within the “probed volume” under the light source and detectors. Abnormal changes in local tissue regions that are small relative to the probed volume may not be detected.
The feasibility of the proposed method for extracting layer-specific intrinsic fluorescence from cervical mucosa in-vivo was demonstrated by analyzing diffuse reflectance and fluorescence spectra measured from 12 subjects in a pilot clinical study. Results of this study as shown in Figure 9, albeit with a very limited sample size, reveal the same trend of increased NADH and decreased collagen fluorescence which have been reported in previous in-vivo [3] and in-vitro [4, 44] studies. However, the extracted ΕNADH/ΕCol do not increase with the severity of abnormality. The sensitivity of detecting cervical precancers using intrinsic fluorescence alone may not be sufficient. Using an excitation wavelength suitable for FAD can enhance its fluorescence signal which may provide useful diagnostic information [47]. Other optical parameters such as tissue scattering and absorption properties, also shown to correlate with the progression of precancers [2], have been combined with intrinsic fluorescence information in previous in-vivo studies to achieve reasonably good sensitivity and specificity [39, 41]. On the other hand, accurate extraction of intrinsic fluorescence highly depends on the accuracy of tissue parameters extracted from diffuse reflectance spectra. We have noticed that bleeding is not uncommon under the pressure by the probe touching the tissue, and may have resulted in mismatch between modeled reflectance spectra and measured ones around hemoglobin absorption peaks at 414–423 nm and 530–590 nm. Using non-contact illumination and detection may improve the fidelity of spectral measurements. In addition, due to heterogeneity of tissue it is desirable to measure many different sites of the cervix. A non-contact measurement scheme is easier than the contact probe to incorporate a scanning mechanism and achieve mapping of tissue optical parameters over the whole ectocervix. At present, it takes about 11 min to analyze a pair of reflectance and fluorescence spectra. In the future, the time required for extracting tissue optical properties could be accelerated by a fluorescence ANN forward model and optimizing the processing speed. Moreover, spectra captured from scanning a large tissue area could be analyzed simultaneously through parallel operations to further develop this method as an instant diagnostic tool.
The raw data supporting the conclusions of this article will be made available by the authors, without undue reservation.
The studies involving human participants were reviewed and approved by Research Ethics Committee, National Taiwan University Hospital. The patients/participants provided their written informed consent to participate in this study.
G-SL: theoretical validation of the DRS and fluorescence models, implementation of one-layer tissue models and comparison between one-layer and two-layer models, analyzing clinical fluorescence data, writing the manuscript. S-CT: development of the fluorescence model. T-HH: building the instrument and validating it with the calibration process; conducting the clinical study, analyzing clinical DRS data. C-IM: theoretical validation of the fluorescence model. C-HC and L-HW: conducting the clinical study, and interpretation of clinical data. K-BS: planning and allocating resources, experimental design, analysis and interpretation of data, writing the manuscript.
Research reported in this manuscript has been supported by grants from National Taiwan University, National Chung-Shan Institute of Science and Technology, and Ministry of Science and Technology (grant # 108-2221-E-002-075-MY3) in Taiwan.
The authors declare that the research was conducted in the absence of any commercial or financial relationships that could be construed as a potential conflict of interest.
All claims expressed in this article are solely those of the authors and do not necessarily represent those of their affiliated organizations, or those of the publisher, the editors and the reviewers. Any product that may be evaluated in this article, or claim that may be made by its manufacturer, is not guaranteed or endorsed by the publisher.
The Supplementary Material for this article can be found online at: https://www.frontiersin.org/articles/10.3389/fphy.2022.865421/full#supplementary-material
1. Hariri Tabrizi S, Aghamiri SMR, Farzaneh F, Sterenborg HJCM. The Use of Optical Spectroscopy for In Vivo Detection of Cervical Pre-cancer. Lasers Med Sci (2014) 29(2):831–45. doi:10.1007/s10103-013-1288-3
2. Brown JQ, Vishwanath K, Palmer GM, Ramanujam N. Advances in Quantitative UV-Visible Spectroscopy for Clinical and Pre-clinical Application in Cancer. Curr Opin Biotechnol (2009) 20(1):119–31. doi:10.1016/j.copbio.2009.02.004
3. Georgakoudi I, Jacobson BC, Müller MG, Sheets EE, Badizadegan K, Carr-Locke DL, et al. NAD(P)H and Collagen as In Vivo Quantitative Fluorescent Biomarkers of Epithelial Precancerous Changes. Cancer Res (2002) 62(3):682–7.
4. Pavlova I, Sokolov K, Drezek R, Malpica A, Follen M, Richards-Kortum R, et al. Microanatomical and Biochemical Origins of Normal and Precancerous Cervical Autofluorescence Using Laser-Scanning Fluorescence Confocal Microscopy. Photochem Photobiol (2003) 77(5):550–5. doi:10.1562/0031-8655(2003)077<0550:maboon>2.0.co;2
5. Eyre DR, Paz MA, Gallop PM. Cross-Linking in Collagen and Elastin. Annu Rev Biochem (1984) 53(1):717–48. doi:10.1146/annurev.bi.53.070184.003441
6. Bradley RS, Thorniley MS. A Review of Attenuation Correction Techniques for Tissue Fluorescence. J R Soc Interf (2006) 3(6):1–13. doi:10.1098/rsif.2005.0066
7. Zhadin NN, Alfano RR. Correction of the Internal Absorption Effect in Fluorescence Emission and Excitation Spectra from Absorbing and Highly Scattering Media: Theory and Experiment. J Biomed Opt (1998) 3(2):171–86. doi:10.1117/1.429874
8. Zhang Q, Müller MG, Wu J, Feld MS. Turbidity-Free Fluorescence Spectroscopy of Biological Tissue. Opt Lett (2000) 25(19):1451–3. doi:10.1364/ol.25.001451
9. Müller MG, Georgakoudi I, Zhang Q, Wu J, Feld MS. Intrinsic Fluorescence Spectroscopy in Turbid Media: Disentangling Effects of Scattering and Absorption. Appl Opt (2001) 40(25):4633–46. doi:10.1364/ao.40.004633
10. Chang SK, Arifler D, Drezek R, Follen M, Richards-Kortum R. Analytical Model to Describe Fluorescence Spectra of Normal and Preneoplastic Epithelial Tissue: Comparison with Monte Carlo Simulations and Clinical Measurements. J Biomed Opt (2004) 9(3):511–22. doi:10.1117/1.1695559
11. Redden Weber C, Schwarz RA, Atkinson EN, Cox DD, MacAulay C, Follen M, et al. Model-Based Analysis of Reflectance and Fluorescence Spectra for In Vivo Detection of Cervical Dysplasia and Cancer. J Biomed Opt (2008) 13(6):064016. doi:10.1117/1.3013307
12. Mirkovic J, Lau C, McGee S, Crum C, Badizadegan K, Feld M, et al. Detecting High-Grade Squamous Intraepithelial Lesions in the Cervix with Quantitative Spectroscopy and Per-Patient Normalization. Biomed Opt Express (2011) 2(10):2917–25. doi:10.1364/boe.2.002917
13. Rajaram N, Reichenberg JS, Migden MR, Nguyen TH, Tunnell JW. Pilot Clinical Study for Quantitative Spectral Diagnosis of Non-Melanoma Skin Cancer. Lasers Surg Med (2010) 42(10):876–87. doi:10.1002/lsm.21009
14. Crilly RJ, Cheong W-F, Wilson B, Spears JR. Forward-adjoint Fluorescence Model: Monte Carlo Integration and Experimental Validation. Appl Opt (1997) 36(25):6513–9. doi:10.1364/ao.36.006513
15. Swartling J, Pifferi A, Enejder AMK, Andersson-Engels S. Accelerated Monte Carlo Models to Simulate Fluorescence Spectra from Layered Tissues. J Opt Soc Am A (2003) 20(4):714–27. doi:10.1364/josaa.20.000714
16. Avrillier S, Tinet E, Ettori D, Tualle J-M, Gélébart B. Influence of the Emission-Reception Geometry in Laser-Induced Fluorescence Spectra from Turbid media. Appl Opt (1998) 37(13):2781–7. doi:10.1364/ao.37.002781
17. Finlay JC, Foster TH. Recovery of Hemoglobin Oxygen Saturation and Intrinsic Fluorescence with a Forward-Adjoint Model. Appl Opt (2005) 44(10):1917–33. doi:10.1364/ao.44.001917
18. Palmer GM, Ramanujam N. Monte-Carlo-Based Model for the Extraction of Intrinsic Fluorescence from Turbid Media. J Biomed Opt (2008) 13(2):024017. doi:10.1117/1.2907161
19. Liu C, Rajaram N, Vishwanath K, Jiang T, Palmer GM, Ramanujam N. Experimental Validation of an Inverse Fluorescence Monte Carlo Model to Extract Concentrations of Metabolically Relevant Fluorophores from Turbid Phantoms and a Murine Tumor Model. J Biomed Opt (2012) 17(7):077012. doi:10.1117/1.JBO.17.7.077012
20. Zhu C, Palmer GM, Breslin TM, Harter J, Ramanujam N. Diagnosis of Breast Cancer Using Fluorescence and Diffuse Reflectance Spectroscopy: A Monte-Carlo-Model-Based Approach. J Biomed Opt (2008) 13(3):034015. doi:10.1117/1.2931078
21. Palmer GM, Ramanujam N. Monte Carlo-Based Inverse Model for Calculating Tissue Optical Properties Part I: Theory and Validation on Synthetic Phantoms. Appl Opt (2006) 45(5):1062–71. doi:10.1364/ao.45.001062
22. Jacques SL. Optical Properties of Biological Tissues: a Review. Phys Med Biol (2013) 58(11):R37–R61. doi:10.1088/0031-9155/58/11/r37
23. Fredriksson I, Larsson M, Strömberg T. Inverse Monte Carlo Method in a Multilayered Tissue Model for Diffuse Reflectance Spectroscopy. J Biomed Opt (2012) 17(4):047004. doi:10.1117/1.jbo.17.4.047004
24. Sung K-B, Chen H-H. Enhancing the Sensitivity to Scattering Coefficient of the Epithelium in a Two-Layered Tissue Model by Oblique Optical Fibers: Monte Carlo Study. J Biomed Opt (2012) 17(10):107003. doi:10.1117/1.jbo.17.10.107003
25. Tsui S-Y, Wang C-Y, Huang T-H, Sung K-B. Modelling Spatially-Resolved Diffuse Reflectance Spectra of a Multi-Layered Skin Model by Artificial Neural Networks Trained with Monte Carlo Simulations. Biomed Opt Express (2018) 9(4):1531–44. doi:10.1364/BOE.9.001531
26. Lin G-S, Mok CI, Sung K-B. Two-Step Curve Fitting Combined with a Two-Layered Tissue Model to Quantify Intrinsic Fluorescence of Cervical Mucosal Tissue in Vivo. Bellingham, Washington, USA: SPIE 11925 (2021).
27. Mok C-I, Sung K-B. Extracting Autofluorescence Spectral Shape and Intensity from Uterine Cervical Mucosa Using Monte-Carlo Based Two-Layered Tissue Models. Biophotonics Congress: Biomedical Optics 2020 (Translational, Microscopy, OCT, OTS, BRAIN) (2020) Washington, DC: Optical Society of America.
28. Alerstam E, Svensson T, Andersson-Engels S. Parallel Computing with Graphics Processing Units for High-Speed Monte Carlo Simulation of Photon Migration. J Biomed Opt (2008) 13(6):060504. doi:10.1117/1.3041496
29. Qu J, MacAulay C, Lam S, Palcic B. Optical Properties of Normal and Carcinomatous Bronchial Tissue. Appl Opt (1994) 33(31):7397–405. doi:10.1364/ao.33.007397
30. Prahl S. Optical Absorption of Hemoglobin (1999). Available from: https://omlc.org/spectra/hemoglobin/ (Accessed May 12, 2021).
31.C-Y Wang, T-C Kao, Y-F Chen, W-W Su, H-J Shen, and K-B Sung, editors. Validation of an Inverse Fitting Method of Diffuse Reflectance Spectroscopy to Quantify Multi-Layered Skin Optical Properties. Photonics: Multidisciplinary Digital Publishing Institute (2019).
32. Wang Q, Le D, Ramella-Roman J, Pfefer J. Broadband Ultraviolet-Visible Optical Property Measurement in Layered Turbid media. Biomed Opt Express (2012) 3(6):1226–40. doi:10.1364/boe.3.001226
33. Kortun C, Hijazi YR, Arifler D. Combined Monte Carlo and Finite-Difference Time-Domain Modeling for Biophotonic Analysis: Implications on Reflectance-Based Diagnosis of Epithelial Precancer. J Biomed Opt (2008) 13(3):034014. doi:10.1117/1.2939405
34. Su J-W, Hsu W-C, Tjiu J-W, Chiang C-P, Huang C-W, Sung K-B. Investigation of Influences of the Paraformaldehyde Fixation and Paraffin Embedding Removal Process on Refractive Indices and Scattering Properties of Epithelial Cells. J Biomed Opt (2014) 19(7):075007. doi:10.1117/1.jbo.19.7.075007
35. Wang A, Nammalavar V, Drezek R. Targeting Spectral Signatures of Progressively Dysplastic Stratified Epithelia Using Angularly Variable Fiber Geometry in Reflectance Monte Carlo Simulations. J Biomed Opt (2007) 12(4):044012. doi:10.1117/1.2769328
36. Patterson MS, Pogue BW. Mathematical Model for Time-Resolved and Frequency-Domain Fluorescence Spectroscopy in Biological Tissues. Appl Opt (1994) 33(10):1963–74. doi:10.1364/ao.33.001963
37. Pu Y, Wang W, Tang G, Alfano RR. Changes of Collagen and Nicotinamide Adenine Dinucleotide in Human Cancerous and Normal Prostate Tissues Studied Using Native Fluorescence Spectroscopy with Selective Excitation Wavelength. J Biomed Opt (2010) 15(4):047008. doi:10.1117/1.3463479
38. Islam M, Honma M, Nakabayashi T, Kinjo M, Ohta N. Ph Dependence of the Fluorescence Lifetime of Fad in Solution and in Cells. Ijms (2013) 14(1):1952–63. doi:10.3390/ijms14011952
39. Chang SK, Marin N, Follen M, Richards-Kortum R. Model-based Analysis of Clinical Fluorescence Spectroscopy for In Vivo Detection of Cervical Intraepithelial Dysplasia. J Biomed Opt (2006) 11(2):024008. doi:10.1117/1.2187979
40. Tu S-C, Sung K-B. Extracting Fluorescence Efficiency and Emission Spectra of Cervical Tissue. Frontiers in Optics / Laser Science (2018) Washington, DC: Optical Society of America.
41. Georgakoudi I, Sheets EE, Müller MG, Backman V, Crum CP, Badizadegan K, et al. Trimodal Spectroscopy for the Detection and Characterization of Cervical Precancers In Vivo. Am J Obstet Gynecol (2002) 186(3):374–82. doi:10.1067/mob.2002.121075
42. Sung K-B, Shih K-W, Hsu F-W, Hsieh H-P, Chuang M-J, Hsiao Y-H, et al. Accurate Extraction of Optical Properties and Top Layer Thickness of Two-Layered Mucosal Tissue Phantoms from Spatially Resolved Reflectance Spectra. J Biomed Opt (2014) 19(7):077002. doi:10.1117/1.jbo.19.7.077002
43. Hsiao Y-H, Tien G-H, Chuang M-J, Hsu F-W, Hsieh H-P, Sung K-B. Development of a Movable Diffuse Reflectance Spectroscopy System for Clinical Study of Esophageal Precancer. Bellingham, Washington, USA: SPIE 9537 (2015).
44. Drezek R, Sokolov K, Utzinger U, Boiko I, Malpica A, Follen M, et al. Understanding the Contributions of Nadh and Collagen to Cervical Tissue Fluorescence Spectra: Modeling, Measurements, and Implications. J Biomed Opt (2001) 6(4):385–96. Epub 2001/12/01. doi:10.1117/1.1413209
45. Müller M, Hendriks BHW. Recovering Intrinsic Fluorescence by Monte Carlo Modeling. J Biomed Opt (2013) 18(2):027009. doi:10.1117/1.jbo.18.2.027009
46. Zhu C, Liu Q, Ramanujam N. Effect of Fiber Optic Probe Geometry on Depth-Resolved Fluorescence Measurements from Epithelial Tissues: a Monte Carlo Simulation. J Biomed Opt (2003) 8(2):237–47. doi:10.1117/1.1559058
47. Thueler P, Charvet I, Bevilacqua F, St. Ghislain M, Ory G, Marquet P, et al. In Vivo endoscopic Tissue Diagnostics Based on Spectroscopic Absorption, Scattering, and Phase Function Properties. J Biomed Opt (2003) 8(3):495–503. doi:10.1117/1.1578494
48. Hennessy R, Markey MK, Tunnell JW. Impact of One-Layer Assumption on Diffuse Reflectance Spectroscopy of Skin. J Biomed Opt (2015) 20(2):027001. doi:10.1117/1.jbo.20.2.027001
Keywords: intrinsic fluorescence, Monte Carlo method, diffuse reflectance spectroscopy, fluorescence spectroscopy, cervical intraepithelial neoplasia
Citation: Lin G-S, Tu S-C, Mok C-I, Huang T-H, Chen C-H, Wei L-H and Sung K-B (2022) Non-Invasive Quantification of Layer-Specific Intrinsic Fluorescence From Mucosa of the Uterine Cervix Using Monte-Carlo-Based Models. Front. Phys. 10:865421. doi: 10.3389/fphy.2022.865421
Received: 29 January 2022; Accepted: 19 May 2022;
Published: 13 June 2022.
Edited by:
Ankur Gogoi, Jagannath Barooah College, IndiaReviewed by:
Nirmal Mazumder, Manipal Academy of Higher Education, IndiaCopyright © 2022 Lin, Tu, Mok, Huang, Chen, Wei and Sung. This is an open-access article distributed under the terms of the Creative Commons Attribution License (CC BY). The use, distribution or reproduction in other forums is permitted, provided the original author(s) and the copyright owner(s) are credited and that the original publication in this journal is cited, in accordance with accepted academic practice. No use, distribution or reproduction is permitted which does not comply with these terms.
*Correspondence: Kung-Bin Sung, a2JzdW5nQG50dS5lZHUudHc=
Disclaimer: All claims expressed in this article are solely those of the authors and do not necessarily represent those of their affiliated organizations, or those of the publisher, the editors and the reviewers. Any product that may be evaluated in this article or claim that may be made by its manufacturer is not guaranteed or endorsed by the publisher.
Research integrity at Frontiers
Learn more about the work of our research integrity team to safeguard the quality of each article we publish.