 Yong Zhang
 Dongmei Li
 Yi Han3
 Zhen Yang
 Xinmin Guo
 Jianlong Zhang
- 1National Key Laboratory of Science and Technology on Tunable Laser, Harbin Institute of Technology, Harbin, China
- 2Department of Optoelectronic Information Science and Technology, School of Astronautics, Harbin Institute of Technology, Harbin, China
- 3School of Instrument Science and Engineering, Institute of Functional Materials and Acoustooptic Instruments, Harbin Institute of Technology, Harbin, China
The aim of this study was to solve the problem that the existing identification parameters of rotor unmanned aerial vehicles (UAVs) are few and limited by the detection mode, and an identification method for estimating the rotor blade width based on the peak time-shift effect is proposed for the first time. Taking the width of the rotor blade as the parameter to identify the rotor of UAVs, the time-shift effect and its relationship with rotor blade width are verified by theoretical analysis and simulation. The proposed time-shift method has the characteristics of high-precision extraction of rotor width, and its effectiveness is verified by simulation and experiments. The aspect ratio of the rotor is accurately extracted based on the proposed time-shift method under the condition of an unknown pitch angle. Simulation results show that the estimation accuracy of the width and aspect ratio is up to 98 and 98.4%, respectively. The experimental results show that the relative errors of the width and aspect ratio are less than 7 and 4%, respectively. This study provides the theoretical basis and technical support for the high-accuracy identification of rotorcraft UAVs.
Introduction
The rotor blade is the main power component of the rotorcraft, and its rotating motion modulates the Doppler echo generated by the UAV fuselage motion to form micro-Doppler signals [1–3]; therefore, the echo signal contains the size information of the rotor [4–6]. Different types of rotorcraft UAVs have different blade parameter information [7], mainly including blade width and aspect ratio of a rotor blade, which are crucial reference indexes for identifying rotorcraft UAVs [8–10].
At present, there are only three parameters available for rotor UAV identification: rotor blade length [11–13], number of blades [14–16], and number of rotors [17]. The different models of rotor blades reflect different information and can extract different parameters. In a certain establishing model, the whole rotor blade is equivalent to a point target and used to simulate the rotation of the rotor [18–20]. This model can vividly reflect the motion trajectory of rotor blades. Unfortunately, this model is too rough and has a big difference from the actual echo signal. Chen et al. [21] equated rotor blades to linear scatterers. Based on this modeling, the length of the rotor blade, number of blades, and number of the rotor can be extracted. On the contrary, this kind of modeling lacks lot of detailed information [22, 23]. Chen et al. [24] discretized the rotor blade into scattering panel elements with uniform scattering coefficients and equally spaced distribution. The echo of a rotor blade is superimposed by the echo, which is formed by countless scattering surface elements. Jiang et al. [25] verified through this model that the envelope shape in the time–frequency diagram formed by different blade width and blade tip sweep angle is different. Wang et al. [26] confirmed that the greater the rotor blade width, the greater the sub-frequency band. However, the peak phenomenon in the time–frequency diagram was not introduced in detail, ignoring the contribution of rotor blade width to peak time-shift. In addition, the contribution of rotor blade thickness to echo could not be verified, either. Based on the aforementioned research results, it is necessary to establish a new model to verify the influence of various parameters of rotor blades on laser micro-Doppler echo. Based on this model, a new identification parameter of the rotor UAV is extracted. The width and aspect ratio of the rotor blade are urgently required to establish a high-precision identification method that can accurately identify the width and aspect ratio parameters of the UAV blade.
As the parameters of rotorcraft UAV identification based on the laser micro-Doppler effect are few and cannot be accurately identified [27, 28], this study proposed the UAV parameter high-precision identification avenue based on the time-shift method for the first time. By using the high spatial resolution lidar [29–31] and establishing a cuboid geometric model with multiple scattering points, it ensures that the echo signal contains a lot of details of the rotor [32–34]. Based on the proposed time-shift method, the influence of blade width on the micro-Doppler echo signal is studied with the proven correctness by simulation and experiment. The results show that the proposed method can achieve a high recognition rate extraction of rotor width and aspect ratio. The UAV width recognition rate is 98% and its aspect ratio is 98.4% in simulation, while they are 93 and 96% in theoretical verification, which provides the technical support for further recognition of UAVs.
Theoretical Modeling and Analysis of the Single-Blade Rotor
Multipoint Scattering Rotor Echo Modeling
As shown in the small diagram in Figure 1, the light emitted by the lidar shines on the rotating rotor blade target of rotorcraft UAVs and scatters, and the rotating motion of the rotor blade modulates the echo signal and forms the micro-Doppler echo signal. The micro-Doppler echo signal contains geometric structure information such as the length, width, and length–width ratio of the rotor blade target. The rotor blade targets are identified by extracting the information from the micro-Doppler. Assuming that the rotation center of the rotor blade is located at the coordinate origin O,
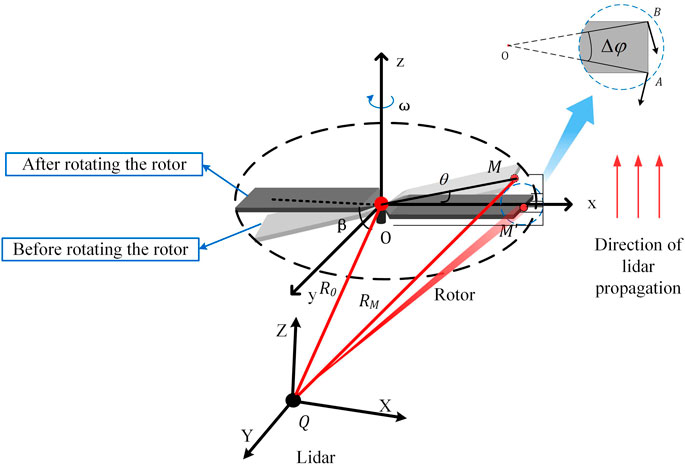
FIGURE 1. Relative position of the rotor and laser line of sight.
The rotor blade is equivalent to a cuboid with a certain thickness, and it has meshed. The points on the meshing are named scattering points to replace the central points of the scattering surface element of the rotor blade. Let the coordinates of scattering points be (xi, yj, and zk), where i, j, and k are integers; the distance between the rotor center O and each scattering point is
where
Contribution of Rotor Width to Echo
The relative position of the rotor and lidar is shown in Figure 1. The distance between the lidar and target rotor is much larger than the length of the rotor L, and the visible laser is a parallel ray (parallel line with an arrow on the right of the Figure 1). To simplify the calculation, the lidar is equivalent to point Q, and the line QO is parallel to the lidar line of sight. The distance between lidar Q and the rotation center O of the rotor blade is R0, and the distance between Q and point M on the top of the rotor blade is RM.
According to Eq. 3, the micro-Doppler frequency-shift generated by scattering points on rotor blades is related to
As shown in the upper right corner of Figure 1, points A and B are the two vertices of the blade, and the width of the rotor blade is AB. The rotor rotates at the same angular velocity. When
However, when the connection between rotor apex A and rotor blade rotating center O is perpendicular to the radar line of sight (OA is perpendicular to the radar line of sight), the micro-Doppler frequency-shift generated by vertex B does not reach the maximum value. When OA rotates
Simulation Analysis of the Echo Signal for the Rotor Blade
As shown in the small diagram in Figure 1, the larger the width of the rotor blade is the bigger the phase
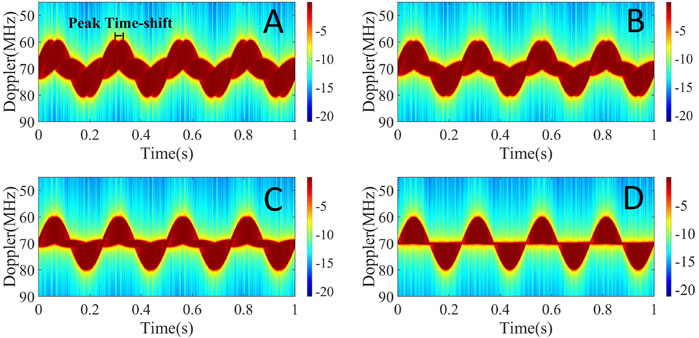
FIGURE 2. Time–frequency diagram of the different rotor widths. Length: width: height (A) 40:30:1. (B) 40:20:1. (C) 40:10:1. (D) 40:1:1.
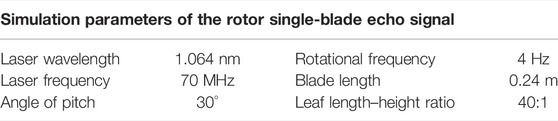
TABLE 1. Echo signal simulation parameters of the rotor single blade.
The laser micro-Doppler echo signal formed by the rotor blade rotation is a time-varying nonstationary signal. Then, the original time–frequency diagram can be obtained. However, the data span ambassador in the original time–frequency map has a large dynamic range using the log compression dynamic range. Meanwhile, the points in the time–frequency map are discrete, and Gaussian smoothing is taken and filtered.
Figure 2 shows that the simulation time–frequency diagram changes periodically and the time spectrum is a visually twisted rope, completing four cycles within a second, which expressed the rotation of the rotor as 4 HZ. As can be seen from Figure 2A, there are two peaks at the peak location in one cycle. In Figure 2A, the physical quantity of abscissa is time, the physical quantity of ordinate is micro-Doppler frequency, and the maximum micro-Doppler frequency shift generated at the peak is 11 MHz. The interval between the two peak values is the time-shift. When the aspect ratio decreases in equal proportion, the time-shift decreases with the decrease of rotor width. As shown in the simulation time–frequency diagram, according to the proportional relation of the aspect ratio, the width of the rotor blade in Figure 2A is the largest, and the corresponding time-shift is larger. When the rotation frequency is the same, the longer it takes for the vertex at one end of the width to reach the peak formed by the other vertex the larger the interval between the two peaks and the bigger the time-shift. The aforementioned simulation verification and analysis show that the time-shift effect does exist and the time-shift method can be used to estimate the width of the rotor blade.
Rotor Size Estimation Based on the Peak Time-Shift Method
It can be seen from the aforementioned section that the echo signal time–frequency diagram will show a peak time-shift due to the influence of rotor width. In this section, the time-shift method will be used for parameter estimation and error analysis of the rotor width and aspect ratio.
Rotor Width Estimation
Assuming that the pitch angle of the rotor is 30°, the rotation frequency f0 = 4 Hz, and the maximum micro-Doppler frequency-shift corresponding to the length of the rotor is
The ratio of length to width of the selected rotors in this study is not less than 3:1, in which the width can be approximated as
The simulation results show that the thickness of the rotor blade has no contribution to the maximum micro-Doppler frequency-shift, rotation frequency, and waveform envelope in the time–frequency diagram after processing. Therefore, this article does not study the correlation effect of rotor blade thickness. In the simulation calculation of the contribution of the rotor blade size to echo signal, the width is changed by adjusting the aspect ratio, and the thickness of the rotor is set as 1/40 of the length. According to Eq. 7, the width of the rotor blade determines the peak (
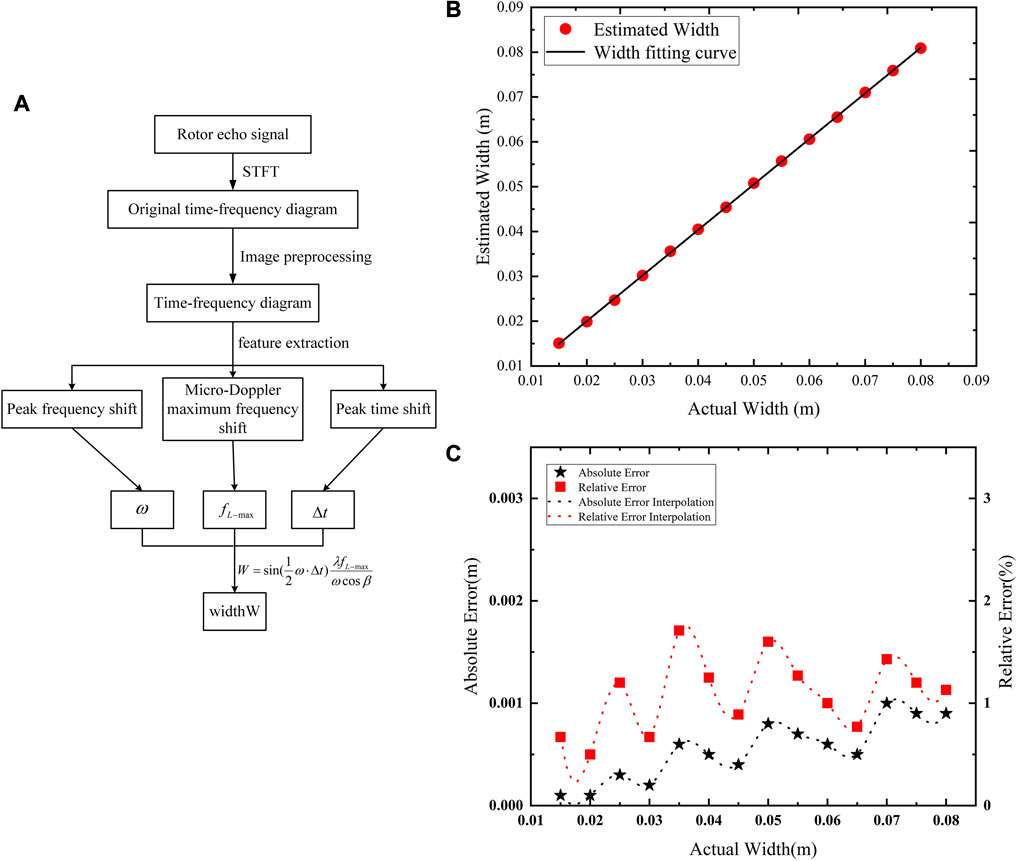
FIGURE 3. Rotor size estimation based on the peak time-shift method. (A) Flow chart of the blade width extractional algorithm. (B) Relationship between estimated width and actual width. (C) Width estimation error.
The laser micro-Doppler echo signal formed by the rotating rotor blade is transformed into the original time–frequency diagram by a short-time Fourier transform. The original time–frequency map has some disadvantages, such as less low-frequency details reserved, low contrast between time–frequency features and background, unsmooth edge leading to time–frequency spectrum repetition period, and the unclear edge of the outer envelope. Logarithmic transformation and Gaussian filtering are used to smooth the edge noise of the original time–frequency graph in order to compress the dynamic range of the data while increasing the low-frequency details, and the time-spectrum envelope is clearer.
The outer envelope function of the time–frequency diagram is extracted, and its derivative is used to calculate the maximum value of the function. The outer envelope function takes time as a variable, and the maximum value of the function is the maximum frequency-shift of micro-Doppler. According to the maximum value of the envelope function, the corresponding occurrence time is calculated. The two nearest adjacent maximum values and the corresponding time interval are the peak value of the micro-Doppler frequency-shift and its corresponding time-shift, respectively.
Substituting the laser wavelength
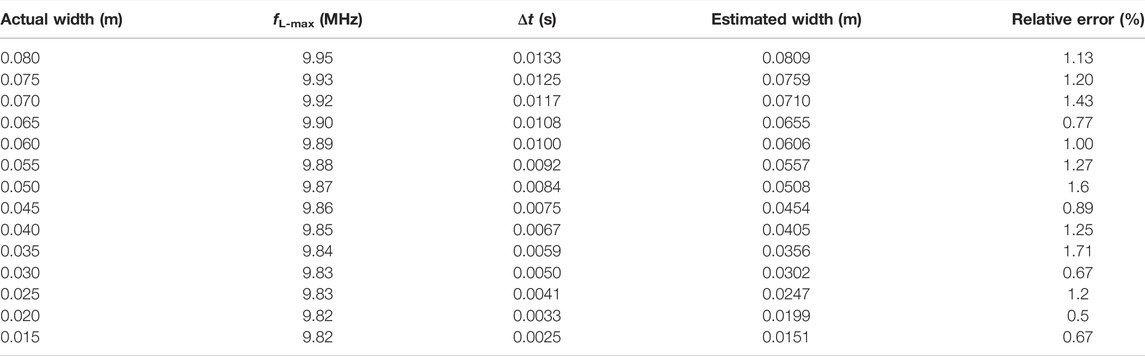
TABLE 2. Width estimation results.
The relationship between the estimated width and the actual rotor width can be obtained according to Table 2, as shown in Figure 3B. The line is the linear fitting result of the estimated width. The slope of the line is 1.016 and the sum of squares of residuals is 5.37 × 10⁻⁷, which is extremely linear, indicating that the estimated result is consistent with the real width value.
The width estimation error obtained from Table 2 is shown in Figure 3C. The red dotted line and black dotted line are cubic spline interpolation curves of the width estimation error of the rotor blade. When the length is constant, the vibration amplitude increases with the increase of the width from 0.015 to 0.045 m and decreases with the increase of the width from 0.045 to 0.080 m. Similarly, the extraction result of the width of the rotor blade is related to the length–width ratio of the rotor blade. The higher the length–width ratio of the rotor blade, the smaller the time-shift of the time–frequency diagram formed. Due to the influence of time resolution, the larger the extracted time-shift (
The main error sources of width estimation in this study are as follows:
1) Discrete error: In the process of modeling, the model is gridded; in a word, the model is dispersed. The degree of model dispersion will have a certain influence on estimation accuracy. The more the grid dividing the higher the estimation accuracy is recognized and the smaller the error will be. The discrete error is inevitable, so this study minimizes the error as far as possible within a reasonable range.
2) Maximum frequency-shift extraction error: Because there is no absolute edge in the time–frequency graph and the frequency resolution in this study is 0.01 MHz, there is an error in the extraction of the maximum frequency-shift of the micro-Doppler, which leads to the error of width estimation.
3) Time-shift extraction error: Because the peak time-shift generated by the smaller rotor width is relatively small, the time resolution in this study is 0.1 ms, and it is difficult to accurately extract the time difference between the two peak values, so the error is generated.
Estimation of the Rotor Aspect Ratio
According to Eq. 7, the estimated width is related to the pitch angle. However, the real situation is the generally unknown pitching angle, so it is hard to estimate the width directly. Combined with Eqs 6, 7, we can get
As shown in Eq. 8, the expression of the aspect ratio of the rotor only includes the rotation speed
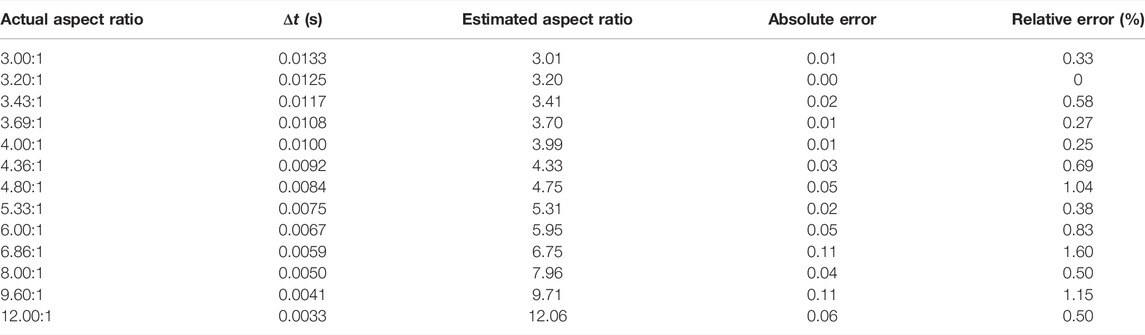
TABLE 3. Estimation results of the aspect ratio.
The flow chart of the rotor aspect ratio estimation algorithm based on the time-shift method is shown in Figure 4A The relationship between the estimated aspect ratio and actual aspect ratio is drawn according to Table 3, as shown in Figure 4B. The red dot is the estimated aspect ratio of simulation, and the black line is the linear fitting result of the real ratio and estimated ratio. The straight slope is 1.007, and the sum of squares of residual errors is 0.029. The results show that the simulated aspect ratio is close to the set aspect ratio. The absolute and relative errors of the estimated aspect ratio are shown in Figure 4C. The red curve and green curve are the cubic spline interpolation results of the absolute and relative errors, respectively. It shows that the absolute error of the estimated aspect ratio fluctuates between 0 and 0.2, while the absolute error shows a rising trend with the increase of the aspect ratio. Similarly, the relative error increases with the increase of the aspect ratio, and the actual maximum relative error is only 1.6%. Similar to the width estimation, the estimation error of the aspect ratio mainly comes from the discrete error introduced by model meshing and the extraction error of time-shift, while the extraction result of frequency-shift does not affect the estimation of the aspect ratio. Therefore, the relative error of the estimation result of the aspect ratio is smaller than that of the width estimation result. It can be seen from the aforementioned analysis that the time-shift method proposed in this study has a good effect and high credibility in the estimation of the rotor aspect ratio parameters.
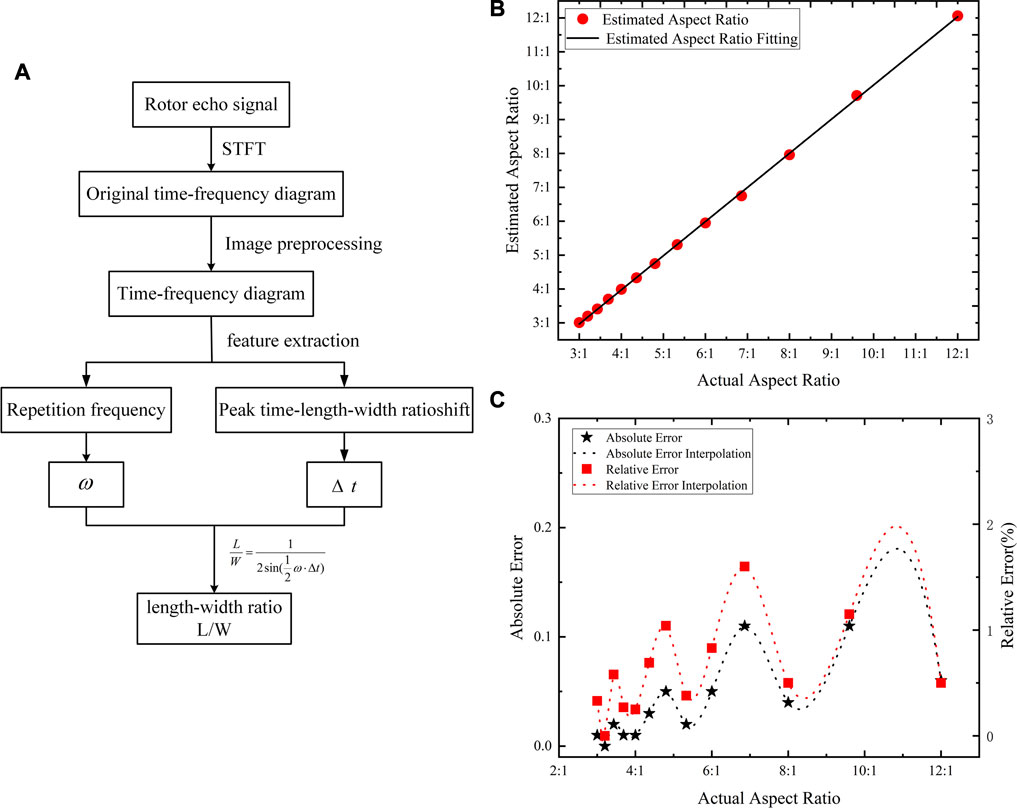
FIGURE 4. (A) Flow chart of the rotor aspect ratio estimation algorithm based on the time-shift method. (B) Relationship between the estimated aspect ratio and actual aspect ratio. (C) Estimation error of the aspect ratio.
Experimental Verification of UAV Parameter Estimation
Different types of rotor UAVs have different rotor blade size information, but the same type of rotor UAVs has the same size information. The micro-Doppler echo signal formed by rotor blade rotation of the same UAVs carries the same information. Based on this, a single rotor blade contains the micro-Doppler echo information formed by all the rotor blades. The rotor UAVs can be recognized by extracting the information of a single rotor blade. The equivalent width and aspect ratio of rotor blades are important parameters to identify UAVs with different signals. In this study, the equivalent width and length–width ratio of the rotor are extracted by the following experimental devices, and the correctness of the simulation experiment is verified.
Figure 5 is a schematic diagram of a UAV rotor blade parameter estimation experimental device. The laser beam from the 100-mW seed laser is divided into signal light and intrinsic light using a fiber beam splitter. The signal light with 90% of the total power is reflected after irradiating to the target of the rotor blade through the transmitting optical system. The reflected micro-Doppler echo signal is transmitted to the optical fiber buncher through the receiving optical system, that is, the Eigen light incident acousto-optic modulator with a frequency-shift of 70 MHz. The outgoing light passes through the fiber attenuator and enters the fiber buncher. The two beams are mixed in the fiber combination and transmitted to the balance detector to form heterodyne interference and retain the difference frequency part. The optical signal is converted into an electrical signal collected by the acquisition card. Finally, the time–frequency diagram is obtained by computer processing.
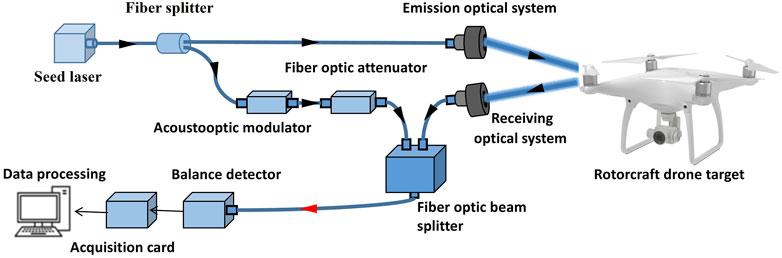
FIGURE 5. Schematic diagram of the rotor blade echo experiment.
In this experiment, the pulsed lidar at 70 GHz was used. The distance between the laser and target is 80 m, and the spot diameter of the laser beam is about 3 cm. The number of revolutions of the motor is 500 r/min, and the target rotating the power supply voltage is 6 V. Figure 6 shows the time–frequency diagram obtained using experimental measurements when the equivalent length–width ratio of rotor blades is 3:1. The length and width of a single blade of the rotor are 9 and 3 mm, respectively, and its rotation frequency is 1.59 Hz. The time–frequency diagram after data processing mainly comprises two parts: the main part with the envelope of the micro-Doppler echo signal formed by the rotation of the rotor blade and the irregular burr edge part formed by noise. In the time–frequency diagram, the two vertical lines are the peaks formed by the two tip points of the rotor width, and the optimal envelope function in the time–frequency diagram is extracted, and the maximum frequency-shift of the rotor and the corresponding t are calculated through several iterations. The five groups of data were averaged for each group, and the time when the peak occurred and the corresponding maximum frequency-shift were recorded. The experimental and simulation results are as follows:
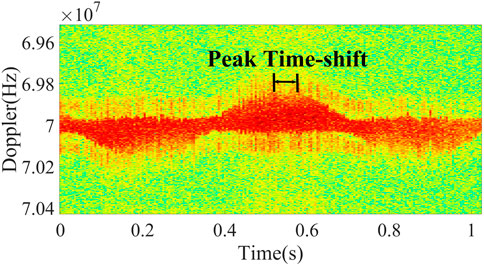
FIGURE 6. Experimental result of the time–frequency diagram.
As the accuracy of the simulation is higher than that of the experiment, it can be concluded from Table 4 that the maximum relative error of rotor width recognition is 3.33%, and the maximum relative error of the aspect ratio is 4.52%. The aforementioned comparison results prove the feasibility of the UAV parameter estimation method proposed in this study, which can accurately extract the rotor width and aspect ratio.
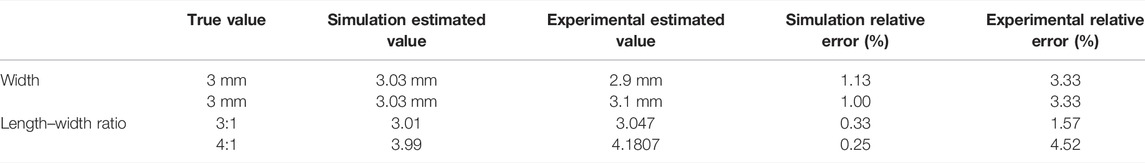
TABLE 4. Comparison between experimental results and simulation results.
Conclusion
Aiming at the problems of low spatial resolution and few parameters of the rotor UAVs identified by the microwave radar, this study proposes a method for identifying the rotor UAV blade parameters based on the peak time-shift method and high spatial resolution lidar. To solve the problem of the lack of rotor geometric structure information in single-point scattering modeling of rotorcraft UAV identified by the microwave radar, a rectangular multipoint scattering geometric model is established in this study. This method can identify two crucial parameters of rotorcraft UAV, rotor width, and aspect ratio with high accuracy.
Based on the established multipoint scattering rotor echo model, the contribution of rotor width to the micro-Doppler echo signal is studied theoretically, and the existence of the time-shift effect is verified using theoretical analysis and simulation. Based on the relationship between the contribution of rotor width to the echo and the time-shift effect, the UAV parameter estimation method based on the time-shift effect is proposed. The estimation accuracy of the rotor width is 98 and 93%. The aspect ratio of the UAV rotor is extracted using the time-shift method. The results show that the relative errors of the aspect ratio of the UAV rotor identified by the simulation and experiment are less than 1.6 and 4%, respectively. This study proposes a new parameter estimation method for laser micro-Doppler identification of rotorcraft UAVs and provides a theoretical and technical basis for further identification of details and structural parameters of rotorcraft UAVs.
Data Availability Statement
The original contributions presented in the study are included in the article/Supplementary Material, further inquiries can be directed to the corresponding authors.
Author Contributions
DL: provided innovation and wrote the manuscript; XD and YH: helped with the experiment; YZ: theoretical and experimental guidance; ZY, XG, and JZ: guidance in the writing of the manuscript.
Conflict of Interest
The authors declare that the research was conducted in the absence of any commercial or financial relationships that could be construed as a potential conflict of interest.
Publisher’s Note
All claims expressed in this article are solely those of the authors and do not necessarily represent those of their affiliated organizations, or those of the publisher, the editors, and the reviewers. Any product that may be evaluated in this article, or claim that may be made by its manufacturer, is not guaranteed or endorsed by the publisher.
References
1. He J, Zhang Q, Luo Y, Yang X, Wen X. Micro-Doppler Effect Analysis Based on Inverse Synthetic Aperture Imaging LADAR. IEEE (2010) 5(10):2071–4. doi:10.1109/ICOSP.2010.5656117
2. Martin J, Mulgrew B. Analysis of the Effects of Blade Pitch on the Radar Return Signal from Rotating Aircraft Blades. Radar Conf (1992) 365(92):446–9.
3. de Wit JJM, Harmanny RIA, Molchanov P. Radar Micro-doppler Feature Extraction Using the Singular Value Decomposition. Radar Conf (2014) 1–6. doi:10.1109/RADAR.2014.7060268
4. Zhao C, Luo G, Wang Y. UAV Recognition Based on Micro-doppler Dynamic Attribute-Guided Augmentation Algorithm. Remote Sens (2021) 13(6):1–17. doi:10.3390/rs13061205
5. Zhao Y, Su Y. Cyclostationary Phase Analysis on Micro-doppler Parameters for Radar-Based Small UAVs Detection. IEEE Trans Instrum Meas (2018) 67(9):2048–57. doi:10.1109/TIM.2018.2811256
6. Peng B, Liu Z, Wei X, Li X. Sinusoidal Frequency Modulation Sparse Recovery for Precession Rate Estimation Using Low-Frequency Long-Range Radar. IEEE Sensors J (2015) 15(12):7329–40. doi:10.1109/JSEN.2015.2469133
7. Ritchie M, Fioranelli F, Griffiths H, Torvik B. Micro-drone RCS Analysis. Radar Conf (2015) 452–6. doi:10.1109/RadarConf.2015.7411926
8. Kim BK, Kang H-S, Park S-O. Experimental Analysis of Small Drone Polarimetry Based on Micro-doppler Signature. IEEE Geosci Remote Sensing Lett (2017) 14(10):1670–4. doi:10.1109/LGRS.2017.2727824
9. Singh AK, Kim YH. Accurate Measurement of Drone's Blade Length and Rotation Rate Using Pattern Analysis with W‐band Radar. Electron Lett (2018) 54(8):523–5. doi:10.1049/el.2017.4494
10. Ciattaglia G, Santis AD, Disha D, Spinsante S, Castellini P, Gambi E, et al. Performance Evaluation of Vibrational Measurements through mmWave Automotive Radars. Remote Sens (2020) 13(1):1–20. doi:10.3390/rs13010098
11. Yang WY, Hoon PJ, Woo BJ. Automatic Feature Extraction from Jet Engine Modulation Signals Based on an Image Processing Method. IET Rada Son Nav (2015) 9(7):783–9. doi:10.1049/iet-rsn.2014.0281
12. Yong YW, Hoon PJ, Young SW, Hoon MN. Robust and Fast Algorithm for Estimating Fundamental Periodicity of Jet Engine Modulation Signals. IET Radar, Sonar & Navigation (2016) 10(7):1286–94. doi:10.1049/iet-rsn.2015.0526
13. Wit JJM, Harmanny RIA, Prémel-Cabic G. Micro-Doppler Analysis of Small UAVs. Cochrane Database Syst Rev (2012) 150(4):210–3.
14. Chen YB, Li SD, Yang J. Rotor Blade echo Modeling and Flicker Mechanism Analysis. J Phys (2016) 65(13):287–97. doi:10.7498/aps.65.138401
15. Baczyk MK, Samczynski P, Kulpa K. Micro-Doppler Signatures of Helicopters in Multistatic Passive Radars. Iet Radar Sonar Nav (2015) 9(9):1276–83. doi:10.1049/iet-rsn.2015.0125
16. Izzo A, Ausiello L, Clemente C, Soraghan JJ. Loudspeaker Analysis: A Radar Based Approach. IEEE Sensors J (2020) 20(3):1223–37. doi:10.1109/JSEN.2019.2946987
17. Passafiume M, Rojhani N, Collodi G, Cidronali A. Modeling Small UAV Micro-doppler Signature Using Millimeter-Wave FMCW Radar. Electronics (2021) 10(6):747. doi:10.3390/electronics10060747
18. Wang Y, Yang S, Yin H, Huo C, Man L. Sparse Time‐frequency Analysis for Aircraft Target Classification with Low Sampling Rate and Short Observation Time. Int J Numer Model (2021) 35(1):1–20. doi:10.1002/jnm.2928
19. Thayaparan T, Abrol S, Riseborough E, Stankovic L, Lamothe D, Duff G. Analysis of Radar Micro-doppler Signatures from Experimental Helicopter and Human Data. IET Radar Sonar Navig. (2007) 1(4):289–99. doi:10.1049/iet-rsn:20060103
20. Zhang P, Li G, Huo C, Yin H. Exploitation of Multipath micro‐Doppler Signatures for Drone Classification. IET Radar, Sonar & Navigation (2020) 14(9):586–92. doi:10.1049/iet-rsn.2019.0105
21. Chen VC, Fayin Li F, Shen-Shyang Ho SS, Wechsler H. Micro-Doppler Effect in Radar: Phenomenon, Model, and Simulation Study. IEEE Trans Aerosp Electron Syst (2006) 42(1):2–21. doi:10.1109/taes.2006.1603402
22. Chen VC. Micro-Doppler Effect of Micromotion Dynamics: A Review. Independent Component Analyses, Wavelets, and Neural Networks. Proc SPIE Int Soc Opt Eng (2003) 5(102):240–9. doi:10.1117/12.488855
23. Rahman S, Robertson DA. Radar Micro-doppler Signatures of Drones and Birds at K-Band and W-Band. Sci Rep (2018) 8(8):1–11. doi:10.1038/s41598-018-35880-9
24. Chen YB, Li SD, Yang J. Rotor Blades echo Modeling and Mechanism Analysis of Flashes Phenomena. Acta Physica Sinica (2016) 65(13):281–91. doi:10.7498/aps.65.138401
25. Jiang XW, Zhao QJ, Meng C. Effect of Helicopter Roter Blade Shape on its Radar Signal Characteristics. Acta Aeronautica et Astronautica Sinica (2014) 35(11):3123–36. doi:10.7527/S1000-6893.2014.0060
26. Wang YP, Hu YH, Guo LR, Xu SL. Research on Laser Detection Method of Rotor Chord Based on Micro-dopper Effect. Acta Photonic sinica (2017) 46(7):0712003. doi:10.3788/gzxb20174607.0712003
27. Dierking MP, Duncan BD. Periodic, Pseudonoise Waveforms for Multifunction Coherent Ladar. Appl Opt (2010) 49(10):1908–22. doi:10.1364/AO.49.001908
28. Tahmoush D. Review of micro‐Doppler Signatures. IET Radar, Sonar & Navigation (2015) 9(9):1140–6. doi:10.1049/iet-rsn.2015.0118
29. Ma Y, Hong Y, Qiao S, Lang Z, Liu X. H-shaped Acoustic Micro-resonator-based Quartz-Enhanced Photoacoustic Spectroscopy. Opt Lett (2022) 47(3):601–4. doi:10.1364/OL.449822
30. Liu X, Ma Y. Sensitive Carbon Monoxide Detection Based on Light-Induced Thermoelastic Spectroscopy with a Fiber-Coupled Multipass Cell [Invited]. Chin. Opt. Lett. (2022) 20(3):031201. doi:10.3788/COL202220.031201
31. Ma Y, Hu Y, Qiao S, Lang Z, Liu X, He Y, et al. Quartz Tuning forks Resonance Frequency Matching for Laser Spectroscopy Sensing. Photoacoustics (2022) 25:100329. doi:10.1016/j.pacs.2022.100329
32. Jian M, Lu Z, Chen VC. Experimental Study on Radar Micro-doppler Signatures of Unmanned Aerial Vehicles. Radar Conf (2017) 0854–7. doi:10.1109/RADAR.2017.7944322
33. Wang XR, Wang PC, Cao XB, Victor CC. Interferometric Angular Velocity Measurement of Rotating Blades: Theoretical Analysis, Modeling and Simulation Study. IET Radar Sonar Nav (2019) 3(13):438–44. doi:10.1049/iet-rsn.2018.5205
Keywords: UAV, laser radar, micro-Doppler, peak time-shift method, size estimation
Citation: Zhang Y, Li D, Han Y, Yang Z, Dai X, Guo X and Zhang J (2022) A New Estimation Method for Rotor Size of UAV Based on Peak Time-Shift Effect in Micro-Doppler Lidar. Front. Phys. 10:865240. doi: 10.3389/fphy.2022.865240
Received: 29 January 2022; Accepted: 07 March 2022;
Published: 04 April 2022.
Edited by:
Qun Hao, Beijing Institute of Technology, ChinaReviewed by:
Hong Gu, Tianjin Polytechnic University, ChinaXu Yang, Zhejiang Sci-Tech University, China
Copyright © 2022 Zhang, Li, Han, Yang, Dai, Guo and Zhang. This is an open-access article distributed under the terms of the Creative Commons Attribution License (CC BY). The use, distribution or reproduction in other forums is permitted, provided the original author(s) and the copyright owner(s) are credited and that the original publication in this journal is cited, in accordance with accepted academic practice. No use, distribution or reproduction is permitted which does not comply with these terms.
*Correspondence: Zhen Yang, c2FpbG9yeXpAaGl0LmVkdS5jbg==