 Xingping Wang1,2
 Gang Zhao3,4*†
 Kang Jiao3,4Bing Chen2Ruifeng Kan2Zhenhua Cong5
 Jianguo Liu2*†
 Weiguang Ma3,4
- 1Department of Precise Machinery and Precise Instrument, University of Science and Technology of China, Hefei, China
- 2Key Laboratory of Environmental Optics and Technology, Anhui Institute of Optics and Fine Mechanics, Chinese Academy of Sciences, Hefei, China
- 3State Key Laboratory of Quantum Optics and Quantum Optics Devices, Institute of Laser Spectroscopy, Shanxi University, Taiyuan, China
- 4Collaborative Innovation Center of Extreme Optics, Shanxi University, Taiyuan, China
- 5School of Information Science and Engineering, Shandong University, Jinan, China
Optical feedback cavity ringdown spectroscopy is presented with a linear Fabry–Pérot cavity and a cost-effective DFB laser. To circumvent the low coupling efficiency caused by the broad laser linewidth, an optical feedback technique is used, and an enhanced coupling efficiency of 31%, mainly limited by impedance mismatch and mode mismatch, is obtained. The trigger of the ringdown event is realized by the shutoff of the laser driving current, and a novel method with the aid of one electronic switch is applied to avoid the ringdown events excited by the unexpected cavity modes during the process of laser current recovery. As a result, the ringdown signal with a signal-to-noise ratio of 2500 is achieved. Through continuous monitoring, the fractional uncertainty of the empty cavity ringdown times is assessed to be 0.04%. An Allan variance analysis indicates a detection sensitivity of 4.3 × 10⁻¹⁰ cm−1 is resulted at an integration time of 120 s, even with a moderate finesse cavity. To further improve the long-term stability, we regularly rectify the empty cavity ringdown time, and an improvement factor of 2.5 is demonstrated.
Introduction
Laser absorption spectroscopy is an effective way for trace gas detection due to its advantages of high sensitivity and high stability. To improve the detection sensitivity, a variety of methods, such as cavity ringdown spectroscopy [1, 2], cavity-enhanced absorption spectroscopy [3, 4], thermoelastic spectroscopy [5, 6], and photoacoustic spectroscopy [7, 8], have been proposed. Cavity ringdown spectroscopy (CRDS) is a well-established spectroscopic technique with the merit of high sensitivity [1, 2]. It leverages an optical cavity to prolong the interaction length between the laser and the intracavity gas, and thus, an amplified absorption signal can be obtained. With superior coating technologies, the amplification factor larger than 105 and the detection sensitivity for trace gas detection down to 10−13 cm−1 could be achieved [9, 10]. On the other hand, CRDS deduces the intracavity absorption information from the variation of the ringdown times, rather than the amplitudes of the cavity transmission modes. Thus, it is immune to laser intensity noise and frequency-to-amplitude noise, which is the main limitation of cavity-enhanced absorption spectroscopy (CEAS). In addition, CRDS is a calibration-free technique that can result in absolute gas concentration. Therefore, in recent decades, CRDS has been widely applied in a variety of application fields [11–13].
To provide regular cavity ringdown events, the laser frequency or cavity length, as well as cavity longitudinal mode frequency, is modulated [14]. However, due to the much broader laser linewidth compared to the cavity mode width, only a small proportion of the light could be coupled into the cavity at a time, leading to a rather low coupling efficiency. Simulation shows that the coupling efficiency could be improved by nearly 100 times with the narrowing of laser linewidth in CRDS [15]. However, diode lasers, the most prevalent light source in the CRDS application field, have a linewidth of several MHz, which is much larger than the cavity linewidth. As a result, a feeble light will be observed in the cavity transmission and the performance of CRDS will be limited by detector noise and electronic noise.
To circumvent this problem, frequency-locked CRDS has been proposed [16]. By locking the laser to the cavity, or vice versa, via the Pound–Drever–Hall method, the laser linewidth is narrowed, and accordingly, high coupling efficiency is attained. However, for a diode laser, because of its large and broadband frequency noise, it is difficult to lock it to a high finesse cavity.
Optical feedback is an alternative method, which is exclusively suitable for a diode laser. The leakage of the intracavity light from the cavity front mirror, acting as an external superb light source with narrow linewidth, returns to the laser, and an injection frequency locking of the laser to the cavity is realized. Optical feedback CRDS (OF-CRDS) was first proposed by Morville based on a V-shape cavity [17, 18]. The improvement of the coupling efficiency by a factor of more than 20 times and neat cavity modes have been observed. Following the first implementation, most existing OF-CRDS setups are based on a V-shape cavity [19–22]. This is because this cavity geometry could separate the intracavity leak-out light from the unwanted direct reflection at the cavity front mirror, which are suspected to generate optical feedback competition with each other. Recently, our group has introduced a linear Fabry–Pérot cavity-based optical feedback CEAS (OF-CEAS) without special care of unwanted direct reflection [23]. By this, optical feedback linear cavity-enhanced absorption spectroscopy (OF-LCEAS) has been developed [3]. The intracavity absorption is derived directly from the amplitude attenuation of the cavity transmission modes. Compared to the V-shape cavity, the Fabry–Pérot cavity is more universal and less sensitive to mechanical vibration and could possess higher finesse. Therefore, it improves the applicability of OF-CEAS.
In this study, optical feedback linear cavity ringdown spectroscopy (OF-LCRDS) based on a linear Fabry–Pérot cavity and a cost-effective DFB laser is presented. Due to the advantages of CRDS over CEAS, a better performance is expected. The ringdown event is excited by changing the laser current below the threshold of emitting quickly. A novel strategy to avoid the trigger of unexpected ringdown events during the laser current recovery is provided. To improve the long-term stability, the optical feedback phase is actively controlled and the empty cavity ringdown time is rectified with the ringdown time at the laser frequency far away from the absorption. The experimental details are presented at first. A ringdown signal with high fidelity is shown. Also, the detection sensitivity is evaluated by the Allan variance plot [24]. Finally, a spectrometer is used to detect CH4 concentration and its long-term stability is examined.
Experimental Setup
The schematic diagram of the experimental setup for OF-LCRDS is shown in Figure 1. A distributed feedback laser diode (Eblana, EP1653-7-DM-TO56-A04) with a TO footprint, emitted at a wavelength of 1.65 μm, is utilized, which addresses three overlapping strong CH4 transitions around 6046.9 cm−1 with a line strength of around 1 × 10⁻²¹ cm−1/(molecule × cm−2). The output light passes through, in sequence, a mode-matching lens, a half-wave plate (λ/2), two reflectors, a polarization beam splitter (PBS), and a quarter wave plate (λ/4). By rotating the λ/4, the feedback ratio could be adjusted.
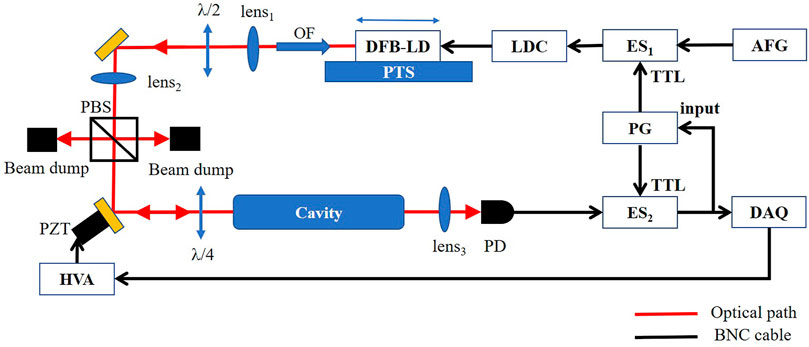
FIGURE 1. Experimental setup for OF-LCRDS. PG: pulse generator; ES1,2: homemade electronic switch; AFG: arbitrary function generator; LDC: laser diode controller; DFB-LD: distributed feedback diode laser; PTS: precision translation stage; λ⁄2: half-wave plate; PBS: polarization beam splitter; PZT: piezoelectric transducer; HVA: high voltage amplifier; PD: photodetector; and DAQ: data acquisition card.
The light is then injected into a Fabry–Pérot (FP) cavity. The cavity consists of two identical mirrors with a reflectivity of 99.96%, corresponding to a finesse of around 7850. The two mirrors are separated with a length of 39.4 cm, implying a free spectral range of 380 MHz. The maximum coupling efficiency between the laser and the cavity is measured to be around 31%, mainly limited by impedance mismatch and mode mismatch, by monitoring the cavity reflection when the laser frequency is locked to the cavity mode [25]. To control the feedback phase to be an integer multiple of 2π for an effective optical feedback [23], two strategies are utilized. A translation stage mounting the laser and a PZT adhered to one of the reflectors are responsible for coarse and fine phase adjustments, respectively. A correction voltage is sent to the PZT to realize active and real-time compensation, which is generated from the judgment of the asymmetry of the cavity transmission mode. To avoid the usage of an extra optical switch which will deteriorate the stability of optical feedback by introducing optical phase shift and fluctuation, the ringdown event is excited by directly and abruptly cutting off the laser current using a homemade electronic switch, i.e., ES1. The cavity transmission and ringdown signals are captured using a PD (Thorlabs, PDA 10CS-EC) and then sent to another homemade electronic switch, i.e., ES2, which is used to filter out the unexpected cavity modes (detailed information will be given in Ringdown Signal). The output of ES2 is divided into two parts. One is sent to a data acquisition (DAQ) card, and the other is sent to a pulse generator, where the latter generates two pulse signals with different starting times and duty ratios to control the ES1 and ES2, respectively.
To get the error signal for the control of the optical feedback phase, the symmetry of the arch-shape cavity mode should be acquired before performing the trigger action. Here, the method similar to that in [18] is adopted to show that the ringdown event is excited on the falling edge of the cavity mode. By changing the laser current below the threshold of the laser emitting quickly, the ringdown event can be observed in the cavity transmission. An exponential function is used to fit the ringdown signal by the least square method.
Results and Discussion
Ringdown Signal
Special measures to avoid the trigger of unwanted ringdown events during the laser current recovery have been taken, and their effect is illustrated in Figure 2 by the time sequence of process signals. The black curve in Figure 2A is the cavity transmission signals for CEAS when the laser current is scanned. There are three successive cavity longitudinal modes, all of which have a typical arch profile. At these points, the laser frequency is briefly locked to the corresponding cavity mode with the time scale of 0.5 ms, even though the nominal linewidth of the laser offered by the manufacturer is 5 MHz and the linewidth of the cavity mode is 54 kHz. This verifies the effect of the optical feedback that could suppress most of the laser frequency noises.
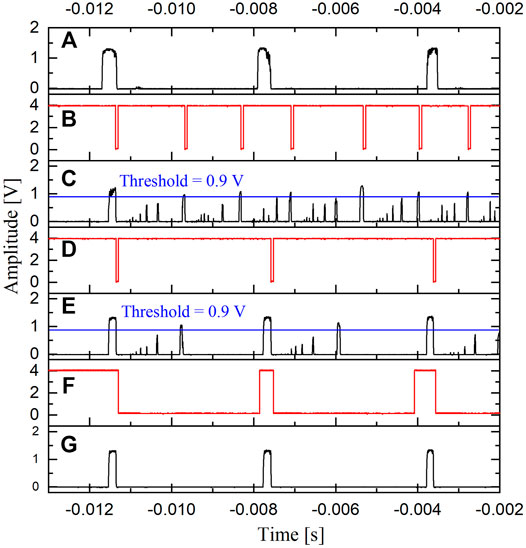
FIGURE 2. The time sequence of the process signals. (A) The cavity transmission modes without the trigger of ringdown event; (B) the pulse signal to the ES1; (C) the cavity transmission modes of OF-LCRDS, and a series of messy cavity modes are observed under this situation; (D) the pulse signal to the ES1 with the ES2; (E) the cavity transmission modes of OF-LCRDS with the ES2; (F) the pulse signal to the ES2 to filter out the unexpected modes; and (G) the signal to the DAQ card with the ES2.
When a falling edge is detected and its amplitude drops below the trigger threshold, a pulse signal with 60 μs duration is generated by the PG and then sent to the ES1 to cut off the laser current. As a result, one ringdown event is observed. The output signal of the PG is shown in Figure 2B with a trigger threshold voltage of 0.9 V for the cavity transmission signal. The curves in Figure 2C are the corresponding cavity transmission modes. After 60 µs, the output of the PG would return to its initial state. However, the recovery of the laser wavelength is relatively slow and several unexpected cavity modes might be stimulated during its recovery process, exemplified by the cavity transmission modes with relatively lower amplitude, as in Figure 2C. It would also excite the ringdown event if it satisfies the requirement of the trigger. Consequently, a series of messy cavity ringdown events stimulated at uncertain laser frequencies are resulted, just as illustrated in Figures 2B,C. This problem could be solved if a higher threshold voltage for the ringdown trigger is set, whereas this strategy is not suitable for the case of large variation of the laser power. For example, a large scanning range of the laser frequency for the detection of a complete absorption spectrum will result in intrinsic variation of the laser power along with the scanning of the laser current.
Here, to address the problem, another electronic switch, i.e., the ES 2, is added after the PD, which is controlled by the PG and can filter out these unexpected modes. Figure 2F depicts the control signal to the ES2. Initially, the ES2 is turned on and the PG can receive the output of the PD. A pulse with a duration of 3.4 ms which lags behind the pulse to the ES1 is generated by the PG and sent to the ES2. After the ringdown signal has been recorded using the DAQ card, it will turn off the ES2 and, thus, cut the link between the PG and the PD. After the laser wavelength gets stable, the ES2 is turned on again and another ringdown event could be triggered. Figures 2D,E,G show the output of the PG to the ES1, the output of the PD, and the input of the DAQ card by using this new strategy, respectively. It is clear to see, even though the numerous cavity transmission modes are still observed during the recovery of the laser frequency, they do not affect the regular trigger of the desired ringdown event. As a result, three ringdown events corresponding to the three consecutive cavity modes are observed, as shown in Figure 2G. With the improvement of the coupling efficiency, large amplitude of the cavity transmission mode as well as the cavity ringdown signal with high repeatability and high signal-to-noise ratio is obtained, illustrated by the black dot in Figure 3A. The red curve is the fitting result based on an exponential decay function; and the lower panel is the fitting residual. An excellent signal-to-noise ratio (SNR) of 2500, defined as the ratio of the peak value and the standard deviation of the residual, is obtained. Also, no strong structure has been found in the fitting residual.
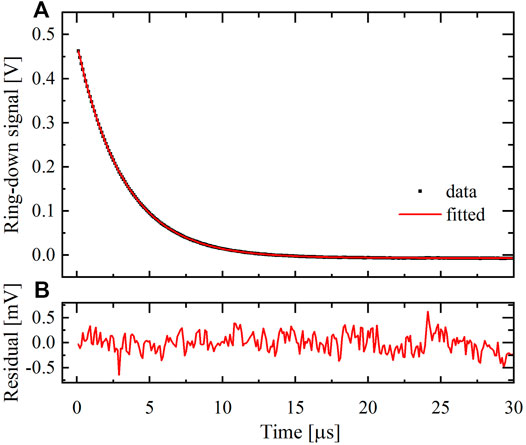
FIGURE 3. (A) Measured single ringdown event (black dot) and its fitting result by an exponential function (red line). (B) The fitting residual.
Evaluation of the Detection Limit
To estimate the detection sensitivity of OF-LCRDS, a series of ringdown events for a single longitudinal mode of the empty cavity was consecutively measured for around 1 h. This is realized by tuning the laser frequency with a triangle wave signal at a rate of 2 Hz. The red curve in Figure 4A depicts the measured empty cavity decay rate, 1/(c·τ0), over time (c is the speed of light, and τ0 is the empty cavity ringdown time). It demonstrates a 0.04% fractional uncertainty of the ringdown times, i.e., σ (τ0)/E (τ0) [σ (τ0) is the standard deviation of τ0, and E (τ0) is the mean value of τ0], which is among the state-of-the-art of CRDS results. Slow fluctuations can be seen in Figure 4A, and it is suspected to be caused by the environmental temperature change which leads to the variation of the cavity length and mechanical vibration which leads to the light hitting the different spots of the cavity mirrors. There is also sparse impulse noise which is attributed to the electric noise and etalon effect. The Allan variance plot [24] is shown as a red curve in Figure 4B. A white noise response of 2.6 × 10⁻⁹ cm−1 Hz−1/2 was obtained, which is illustrated by the dash line in black. Also, the system reached its detection limit of 4.3 × 10⁻¹⁰ cm−1 at an integration time of 120 s, corresponding to a minimal detection of CH4 concentration of 1.2 ppb by a CH4 transition at 6046.9 cm−1.
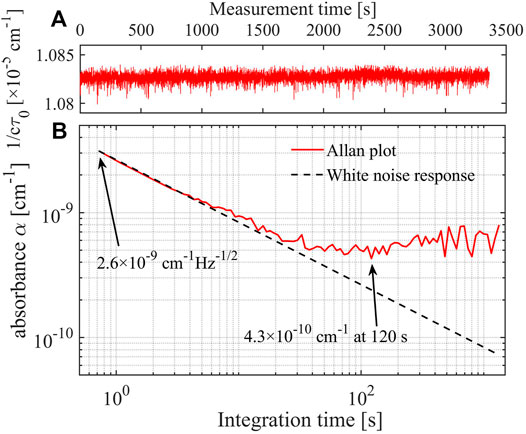
FIGURE 4. Long-term ringdown time measurement of a single cavity longitudinal mode. (A) Empty cavity decay rate; (B) Allan variance plot.
Measurement of the CH4 Absorption Spectrum
Then, the absorption spectrum of CH4 is measured. We filled the cavity with the ambient air of our lab located at Taiyuan, China, which is filtered by using a desiccant first. The intracavity pressure was set to 0.92 atm, i.e., the local atmospheric pressure. In the experiment, each cavity mode was scanned 50 times for average ringdown time. The laser current is scanned by a triangular wave with a frequency scanning range of around 0.5 FSR at a rate of 50 Hz. The shift of the adjacent cavity mode is realized by stepping the central value of the laser current, and it took 7 min to get a whole spectrum. The empty cavity ringdown time is measured at the wavelength of 6047.5 cm−1, which is 18 GHz away from the center of the nearest strong absorption transition. The obtained absorption spectrum is shown as the black dots in Figure 5A. With a total laser frequency scanning range of 45 GHz, 118 successive cavity modes are stimulated and a CO2 absorption line is observed besides the CH4 absorption line, shown as a small bump in Figure 5. The spectral parameters from the HITRAN database [26] and Lorentzian line-shape function are used to fit the measurement spectrum. The fitted curve is displayed as a red line in Figure 5A, and the fitting residual is presented in Figure 5B. The theoretical model shows a good consistency with the measured spectrum, and the signal-to-residual ratio of 156 is obtained. The retrieved CH4 concentration is 2.73 ppm.
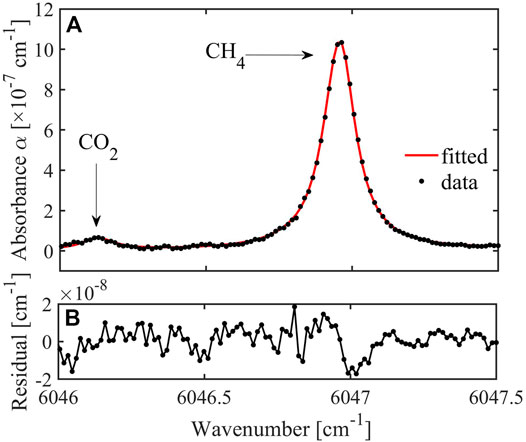
FIGURE 5. (A) Measured CH4 absorption spectrum and its fitting result with Lorentz function; (B) fitting residual.
Rectification of the Empty Cavity Ringdown Time
The variation of the empty cavity ringdown time, owing to temperature fluctuation and mechanical vibration, is the dominant limitation to the long-term stability of CRDS. To solve this problem, the empty cavity ringdown time is rectified regularly by the ringdown time at the laser frequency far away from the gas absorption transition. To verify the effectiveness of this method, a long-term concentration measurement with a time interval of 20 min and a duration of 34 h for CH4 gas with a constant concentration has been performed. The dotted lines in blue and red in Figure 6 are the measured concentrations without and with rectification, respectively. Without rectification, the drift range of retrieved concentration is 0.2 ppm within this measurement time. After the rectification, the drift range is suppressed to 0.08 ppm, which shows an improvement with a factor of 2.5.
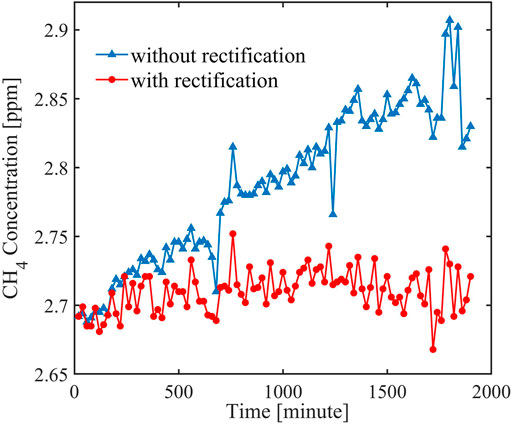
FIGURE 6. Long-term measurement of CH4 with constant concentration.
Conclusion
In summary, we have developed optical feedback linear cavity ringdown spectroscopy. The ringdown event is excited by changing the laser current below the threshold of emitting quickly. An effective method to avoid the ringdown events excited by the unexpected cavity modes during the process of current recovery is introduced with one electronic switch. The coupling efficiency of the laser to the FP cavity is improved to 31%, mainly limited by the mode mismatch and impedance mismatch, by optical feedback, and consequently, ringdown signals with high fidelity are achieved. The fractional uncertainty of empty cavity ringdown time is 0.04%, yielding a minimal detection of CH4 concentration of 1.2 ppb at the integration time of 120 s. The long-term retrieved concentration drift is improved by 2.5 times within 34 h through rectifying the empty cavity ringdown time during the measurement of each spectrum. This novel technique paves the way for the construction of a robust and sensitive CRDS instrument for trace gas detection.
Data Availability Statement
The raw data supporting the conclusion of this article will be made available by the authors, without undue reservation.
Author Contributions
XW: data curation, formal analysis, methodology, and writing—original draft. GZ: conceptualization, supervision, validation, visualization, writing—review and editing. KJ: formal analysis. BC: software and validation. RK: resources and writing—review and editing. ZC: resources and validation. JL: supervision, funding acquisition, project administration, and writing—review and editing. WM: writing—review and editing.
Funding
This work was supported by the equipment development project of the Chinese Academy of Sciences (Grant No. ZDKYYQ20200006), National Natural Science Foundation of China (Grant Nos. 61875107, 61905136, 61905134, 62175139, and 61805286), and Opening Foundation of Key Laboratory of Laser and Infrared System (Shandong University), Ministry of Education.
Conflict of Interest
The authors declare that the research was conducted in the absence of any commercial or financial relationships that could be construed as a potential conflict of interest.
Publisher’s Note
All claims expressed in this article are solely those of the authors and do not necessarily represent those of their affiliated organizations, or those of the publisher, the editors, and the reviewers. Any product that may be evaluated in this article, or claim that may be made by its manufacturer, is not guaranteed or endorsed by the publisher.
References
1. Paldus BA, Kachanov AA. An Historical Overview of Cavity-Enhanced Methods. Can J Phys (2005) 83:975–99. doi:10.1139/p05-054
2. Romanini D, Ventrillard I, Méjean G, Morville J, Kerstel E. Introduction to Cavity Enhanced Absorption Spectroscopy. In: G Gagliardi, and L Hans-Peter, editors. Cavity-enhanced Spectroscopy and Sensing. New York, NY: Springer (2014). p. 1–60. doi:10.1007/978-3-642-40003-2_1
3. Tian J, Zhao G, Fleisher AJ, Ma W, Jia S. Optical Feedback Linear Cavity Enhanced Absorption Spectroscopy. Opt Express (2021) 29:26831–40. doi:10.1364/OE.431934
4. Głuszek A, Senna Vieira F, Hudzikowski A, Wąż A, Sotor J, Foltynowicz A, et al. Compact Mode-Locked Er-Doped Fiber Laser for Broadband Cavity-Enhanced Spectroscopy. Appl Phys B (2020) 126:1–6. doi:10.1007/s00340-020-07489-2
5. Liu X, Qiao S, Ma Y. Highly Sensitive Methane Detection Based on Light-Induced Thermoelastic Spectroscopy with a 2.33 Μm Diode Laser and Adaptive Savitzky-Golay Filtering. Opt Express (2022) 30:1304–13. doi:10.1364/OE.446294
6. Liu X, Ma Y. Sensitive Carbon Monoxide Detection Based on Light-Induced Thermoelastic Spectroscopy with a Fiber-Coupled Multipass Cell [Invited]. Chin Opt Lett (2022) 20:031201. doi:10.3788/COL202220.031201
7. Ma Y, Hu Y, Qiao S, Lang Z, Liu X, He Y, et al. Quartz Tuning forks Resonance Frequency Matching for Laser Spectroscopy Sensing. Photoacoustics (2022) 25:100329. doi:10.1016/j.pacs.2022.100329
8. Ma Y, Hong Y, Qiao S, Lang Z, Liu X. H-shaped Acoustic Micro-resonator-based Quartz-Enhanced Photoacoustic Spectroscopy. Opt Lett (2022) 47:601–4. doi:10.1364/OL.449822
9. Winkler G, Perner LW, Truong G-W, Zhao G, Bachmann D, Mayer AS, et al. Mid-infrared Interference Coatings with Excess Optical Loss below 10 Ppm. Optica (2021) 8:686–96. doi:10.1364/OPTICA.405938
10. Cole GD, Zhang W, Martin MJ, Ye J, Aspelmeyer M. Tenfold Reduction of Brownian Noise in High-Reflectivity Optical Coatings. Nat Photon (2013) 7:644–50. doi:10.1038/nphoton.2013.174
11. Fleisher AJ, Long DA, Liu Q, Gameson L, Hodges JT. Optical Measurement of Radiocarbon below Unity Fraction Modern by Linear Absorption Spectroscopy. J Phys Chem Lett (2017) 8:4550–6. doi:10.1021/acs.jpclett.7b02105
12. Hu M, Chen B, Yao L, Yang C, Chen X, Kan R. A Fiber-Integrated CRDS Sensor for In-Situ Measurement of Dissolved Carbon Dioxide in Seawater. Sensors (2021) 21:6436. doi:10.3390/s21196436
13. Tao L-G, Liu A-W, Pachucki K, Komasa J, Sun YR, Wang J, et al. Toward a Determination of the Proton-Electron Mass Ratio from the Lamb-Dip Measurement of HD. Phys Rev Lett (2018) 120:153001. doi:10.1103/PhysRevLett.120.153001
14. Hodges JT, Layer HP, Miller WW, Scace GE. Frequency-stabilized Single-Mode Cavity Ring-Down Apparatus for High-Resolution Absorption Spectroscopy. Rev Scientific Instr (2004) 75:849–63. doi:10.1063/1.1666984
15. Hahn JW, Yoo YS, Lee JY, Kim JW, Lee H-W. Cavity Ringdown Spectroscopy with a Continuous-Wave Laser: Calculation of Coupling Efficiency and a New Spectrometer Design. Appl Opt (1999) 38:1859–66. doi:10.1364/ao.38.001859
16. Paldus BA, Harb CC, Spence TG, Wilke B, Xie J, Harris JS, et al. Cavity-locked Ring-Down Spectroscopy. J Appl Phys (1998) 83:3991–7. doi:10.1063/1.367155
17. Morville J, Kassi S, Chenevier M, Romanini D. Fast, Low-Noise, Mode-By-Mode, Cavity-Enhanced Absorption Spectroscopy by Diode-Laser Self-Locking. Appl Phys B (2005) 80:1027–38. doi:10.1007/s00340-005-1828-z
18. Morville J, Romanini D, Kachanov AA, Chenevier M. Two Schemes for Trace Detection Using Cavity Ringdown Spectroscopy. Appl Phys B (2004) 78:465–76. doi:10.1007/s00340-003-1363-8
19. Baran SG, Hancock G, Peverall R, Ritchie GAD, van Leeuwen NJ. Optical Feedback Cavity Enhanced Absorption Spectroscopy with Diode Lasers. Analyst (2009) 134:243–9. doi:10.1039/B811793D
20. Wan F, Zhou F, Hu J, Wang P, Wang J, Chen W, et al. Highly Sensitive and Precise Analysis of SF6 Decomposition Component CO by Multi-Comb Optical-Feedback Cavity Enhanced Absorption Spectroscopy with a 2.3 μm Diode Laser. Sci Rep (2019) 9:9690. doi:10.1038/s41598-019-46190-z
21. Tan Z, Long X. A Developed Optical-Feedback Cavity Ring-Down Spectrometer and its Application. Appl Spectrosc (2012) 66:492–5. doi:10.1366/11-06291
22. Hippler M, Mohr C, Keen KA, McNaghten ED. Cavity-enhanced Resonant Photoacoustic Spectroscopy with Optical Feedback Cw Diode Lasers: A Novel Technique for Ultratrace Gas Analysis and High-Resolution Spectroscopy. J Chem Phys (2010) 133:044308. doi:10.1063/1.3461061
23. Zhao G, Tian J, Hodges JT, Fleisher AJ. Frequency Stabilization of a Quantum cascade Laser by Weak Resonant Feedback from a Fabry-Perot Cavity. Opt Lett (2021) 46:3057–60. doi:10.1364/OL.427083
24. Werle P, Mücke R, Slemr F. The Limits of Signal Averaging in Atmospheric Trace-Gas Monitoring by Tunable Diode-Laser Absorption Spectroscopy (TDLAS). Appl Phys B (1993) 57:131–9. doi:10.1007/BF00425997
25. Zhao G, Hausmaninger T, Ma W, Axner O. Differential Noise-Immune Cavity-Enhanced Optical Heterodyne Molecular Spectroscopy for Improvement of the Detection Sensitivity by Reduction of Drifts from Background Signals. Opt Express (2017) 25:29454–71. doi:10.1364/OE.25.029454
Keywords: CRDS, laser absorption spectroscopy, high sensitivity, optical feedback, Fabry–Pérot cavity
Citation: Wang X, Zhao G, Jiao K, Chen B, Kan R, Cong Z, Liu J and Ma W (2022) Optical Feedback Linear Cavity Ringdown Spectroscopy. Front. Phys. 10:857371. doi: 10.3389/fphy.2022.857371
Received: 18 January 2022; Accepted: 25 January 2022;
Published: 16 February 2022.
Edited by:
Yufei Ma, Harbin Institute of Technology, ChinaCopyright © 2022 Wang, Zhao, Jiao, Chen, Kan, Cong, Liu and Ma. This is an open-access article distributed under the terms of the Creative Commons Attribution License (CC BY). The use, distribution or reproduction in other forums is permitted, provided the original author(s) and the copyright owner(s) are credited and that the original publication in this journal is cited, in accordance with accepted academic practice. No use, distribution or reproduction is permitted which does not comply with these terms.
*Correspondence: Gang Zhao, Z2FuZ3poYW9Ac3h1LmVkdS5jbg==; Jianguo Liu, amdsaXVAYWlvZm0uYWMuY24=
†These authors have contributed equally to this work