- Copernicus Institute of Sustainable Development, Utrecht University, Utrecht, Netherlands
The luminescent solar concentrator (LSC) as energy harvesting window is an emerging technology in the realm of building integrated photovoltaics. Using recent advancement for assessing the balance between transmitted color quality and potential electricity generation, this paper optimizes theoretical luminophore absorption spectra for the highest power generation possible. The power conversion efficiencies (PCE) are based on coupling of the LSC waveguide to a highly efficient crystalline silicon solar cell. A non-convex optimisation algorithm maximizing absorption is used with constraints for color quality parameters: average visible transmission (AVT) and color rendering index (CRI). An optimal luminophore has been defined using a continuous absorption function with a cut-off and limited absorption in the visible spectrum. Two types of constraints are set: 1) 55% < AVT < 100% and 2) 55% < AVT < 100% and 70 < CRI < 100. The first constraint will ensure sufficient visible light and the second ensures appropriate color rendering. Ray-trace validated results show high power conversion efficiencies ranging from 9.53% to 14.3% for (AVT = 90%, CRI = 98) and (AVT = 55%), respectively. Future studies can use these results to benchmark (tandem) LSCs for specific lighting requirements. Furthermore, the flexibility of the proposed method allows for the adaptation to constraints not used in this paper.
1 Introduction
As the next step in photovoltaic (PV) applications, integration of PV in buildings (roofs and façades), denoted as building integrated PV (BIPV), has seen a steady increase in popularity [1, 2]. BIPV distinguishes itself by being a structural part of the building envelope while simultaneously functioning as an electricity generation system. BIPV thus provides solutions in densely populated areas for lack of space [3] and shading effects [4] allowing the realization of near-zero energy buildings (NZEBs) [5].
A promising BIPV application is an electricity generating window based on luminescent solar concentrators (LSCs) [3]. The LSC uses luminophores embedded in a waveguide that absorb part of the incoming sunlight and emit red-shifted photons, which, via total internal reflection, can reach side-mounted PV cells. Here, light is converted to electricity. LSC-based windows should allow for sufficient transmission of visible light, see Figure 1. LSCs have seen an increase in popularity in the past decade [3, 4, 6] due to their flexibility [7, 8] and excellent performance under diffuse irradiance [9, 10]. Figure 2 shows the number of publications per year on LSCs since 1978, illustrating the recent increased interest.
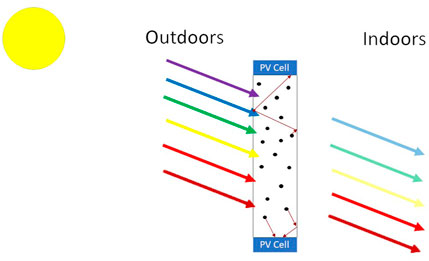
FIGURE 1. Working principle of a luminescent solar concentrator. The incoming solar photons are partly absorbed by a luminophore (black dots), and subsequently emitted towards the sides (red arrows) where they can arrive, after total internal reflection from the edges of the waveguide material, at the side-mounted PV cells. Note that only part of the light is captured as shown by the fading of the colored arrows. Based on the picture from Mangu [11].
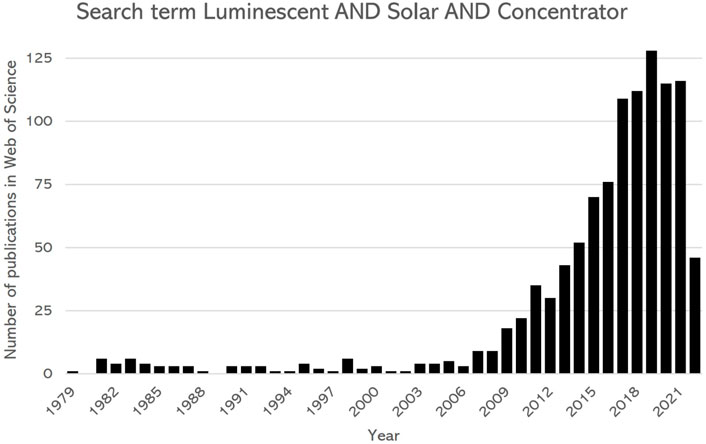
FIGURE 2. Number of publications per year as found in Web of Science on LSCs, using the search term “Luminescent” AND “Solar” AND “Concentrator”, since 1979. Data collected 7 June 2022.
Today’s power conversion efficiencies (PCE) of LSCs are low however and hover around 2–3% [12], while the 2008 record of 7.1% still stands [13]. For the LSC to be a viable BIPV element it is speculated that a PCE of 10% is required [14, 15], which theoretical models show is possible [16]. Besides power generation, the LSC needs to transmit light with a color quality corresponding to a pleasant indoor environment, when used in a transparent window.
To assess the quality of light, the Color Rendering Index (CRI), while under discussion [17], is generally considered to be the leading metric for assessing window applications [18–20]. Determination of CRI leads to a value ranging from 0 to 100 with 100 being a perfect representation of the colors of an object. A CRI of at least 70 is considered to be of good quality [3]. The CRI only indicates relative color differences, however, and should be correlated to an absolute value such as average visible-light transmissivity (AVT) [16] to provide a full picture of color quality.
An optimal LSC has a high PCE while still transmitting good quality light at sufficient intensity. [16, 21] found that using a luminophore without absorption in the 435–675 nm range (visible) would have a theoretical efficiency of 21–33%. When using more realistic circumstances, the efficiency dropped to 10–16% depending on the transmittance in the aforementioned range. The range for 435–675 nm was defined by iterating over a number of wavelength cut-offs to find the optimum.
The optimum absorption spectrum can be used to approximate maximum efficiencies of LSC devices. Namely tandem devices can use multiple luminophores to approximate a broad absorption spectrum without re-absorption effects [22]. In this article, an innovative approach is used were an optimal luminophore, or rather its absorption spectrum, will be defined using an optimisation algorithm. The algorithm will maximize photon absorption while adhering to two types of constraints: first, 55% < AVT < 90% and second, similar to the first, but with the added constraint of 70 < CRI < 100. The AVT and CRI are calculated using the equations and assumptions as provided by [23]. The found results are validated by a ray trace algorithm created by [24].
The ray trace algorithm assumes the widely used waveguide material polymethylmethacrylate (PMMA), optimal for LSC devices [25]. Furthermore, the side-mounted PV cells are modelled after the record efficiency hetero junction silicon solar cell by [26] with interdigitated back contacts. Results will provide high theoretical (tandem) LSC efficiencies based on realistic waveguide and PV cell characteristics.
This paper is further organized as follows. In the method section we will explain the calculations used to find PCE and colorimetry parameters. Subsequently, the optimal luminophore is defined and the ray trace parameters are introduced. The result section will present the optimal luminophores and the corresponding PCE for different CRI and AVT values, and show the resulting colors.
2 Methods
2.1 Power Conversion Efficiency
The incident photons to the waveguide sides are captured by the attached PV cell(s) for the generation of electricity. The ratio between the incident power (Pin) and the electrical power generated by the side-mounted PV cell (Pout) is the power conversion efficiency of the LSC device, as shown in Eq. (1)
in which Jmpp is the current density at maximum power point (MPP) of the cell, Vmpp the voltage at MPP, and PAM1.5G the power of the incident AM1.5G spectrum (1000 W/m2 under standard test conditions (STC)). MPP of the cell equals the product JmppVmpp. In order to determine MPP, a procedure is followed based on [27]. First, the short circuit density Jsc is calculated using the spectrally resolved photon flux S(λ) [in # m−2 s−1) incident on the PV cell and the external quantum efficiency of the PV cell (EQEPV(λ)), as follows:
Second, an iterative procedure for Vmpp is performed using the diode equation at MPP (Eq. 3) and the derivative of the equation for power with respect to the applied voltage (Eq. (4)). Solving this transcendental equation yields Vmpp, Jmpp, and P.
with q as the elemental charge (C), kb the Boltzmann constant (m2 kg s−2 K−1), T the ambient temperature (K), J0 the diode saturation current of the PV cell (A m−2), and A the diode ideality factor. J0, EQEPV(λ) and A are obtained from the manufacturer, in this paper [26].
2.2 Light Quality and Colorimetry
In order to function as a window, the LSC needs to transmit sufficient visible light. Assessing transmitted visible light is generally done with the Average Visible Transmission (AVT) which is dependent on the photopic response of the human eye. Eq. (5) details the calculation of the AVT which uses the ratio of the solar photon flux (AM1.5G) (S(λ)), the transmission (T(λ)) and the photopic response (P(λ)), adapted from Lunt [16]. For window applications an AVT between 555% and 90% is generally considered acceptable [16].
Besides the transmission in the visible spectrum, a more complete figure of merit for light is based on the potential to accurately render the color of objects. To quantify this, the 1976 Color Rendering Index (CRI) is used as defined by the International Commission on Illumination (CIE) [28], the general authority on colorimetry. This method is suggested by [3] and extensively explained in [23], and besides LSC research [29], also used in assessing color quality of glazed windows [17–20].
Generally, a CRI above 70 is considered good quality and above 95 of excellent quality. Note that [3, 21] both use the AM1.5G as a reference. The CIE however suggests to use the D65 spectrum and to change the reference spectrum depending on correlated color temperature (CCT) [28]. This method is also adopted by glazed window color assessments [17], but without dependence on the CCT. In this article the AM1.5G spectrum has been taken as the reference spectrum without dependence on the CCT or chromaticity correction.
2.3 Defining the Optimal Luminophores
2.3.1 Optimisation of Absorption
The ideal luminophore will have a high absorption and a transmission spectrum corresponding to specific lighting requirements. When convoluting the AM1.5G spectrum by the absorption spectrum of a luminophore, this transmission spectrum can be approximated and the CRI can be calculated. At the same time, the absorbed part of the spectrum will indicate the photons available for electricity generation.
The optimization procedure follows the equations below:
Taking the absorption spectrum as a decision variable and setting a constraint for the AVT and CRI, the power output can be optimized. The optimisation uses the Lambert-Beer law to calculate the absorbed photons (Φabs) which is set equal to the absorption fraction multiplied by the AM1.5G photon flux (S(λ). The maximization of absorbed photons is constraint by the AVT and CRI value of the transmitted spectrum. The waveguide is modelled using top and bottom reflection losses of 4% each, leading to a transmittance of 0.96 × 0.96 = 92.16% (ηR). Further, the waveguide absorption uses the wavelength dependent PMMA absorption spectrum (α(λ)) taken from [30]. The thickness of the waveguide is d.
We define an idealized, but modifiable, absorption spectrum by the function shown in Eq. 7. Here λc indicates the middle of the absorption gap and σ the length from the middle (λc) to the start of the absorption at both sides. The absorption gap thus has a width of 2σ,
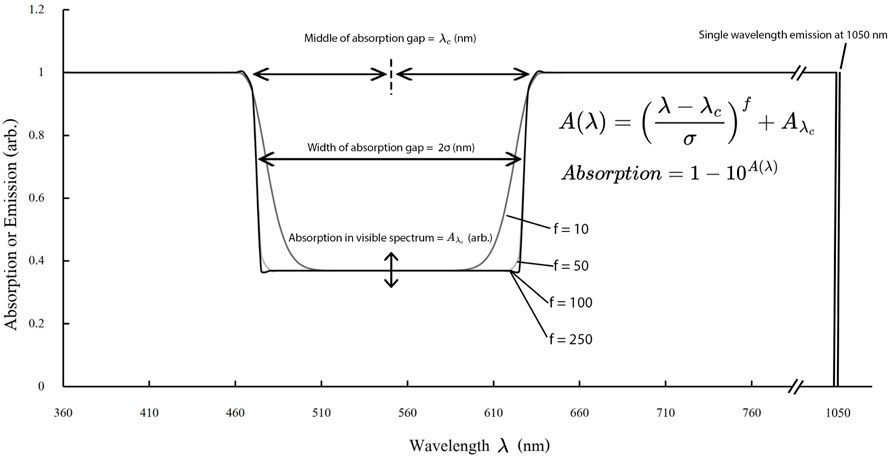
FIGURE 3. Showing the relationship between λc, σ and
2.3.2 Optimisation Parameters
Optimising for photon absorption (Φabs) is done by the Scipy minimize (trust-constraint) method [31]. The lower and upper bounds on λc, σ and
Two types of optimisation are run with varying constraints. The first optimisation takes only AVT into account with steps of 5% for a range of 55% < AVT < 90% and given by Eq. 9. The second constraint builds upon the first and adds a requirement for the CRI: 70 < CRI < 98, again with steps of 5, and given by Eq. 11. Note that the optimisation uses a range of 360–830 nm, but the photons between 280–360 nm, and 830–1,050 nm (the optimal emission wavelength as defined below) are assumed to be absorbed as well.
2.3.3 Defining Optimal Emission
For optimal emission two things are important: avoiding overlap with the absorption spectrum in order to minimize self-absorption losses, and optimal coupling with the side-mounted PV cell. In this paper, the ray trace algorithm for the LSC device is connected to a c-Si cell with interdigitated back contacts by [26]. It was found that the highest photon absorption taking the EQEPV into account occurs at a wavelength of 1,050 nm. To avoid overlap, the absorption stops at 1,049 nm as shown in Figure 3.
2.4 Ray Trace Parameters
When the two different optimisation settings have been run the PCE, CRI and other colorimetric values can be calculated using PVtrace by Farrell [24]. The ray trace algorithm uses 106 emitted photons distributed like the AM1.5G spectrum up until the found optimal emission (280–1,050 nm). From a list of LSC devices provided by Roncali [12] an average size of 0.3 × 0.3 m2 is used in the ray trace algorithm. The thickness is set at 0.5 cm resulting in a geometric gain of 15. The wavelength dependent absorption spectrum for the PMMA waveguide is taken from [30] with a wavelength independent index of refraction of 1.49. The coupled PV cell is modelled after the record efficiency cell produced by [26]. This amorphous silicon hetero junction cell uses interdigitated back contacts to avoid reflection from the front, ideal for coupling with LSC devices. The ideality factor is set at 1.0, corresponding to VOC ≈ 0.7 V as found in their paper.
3 Results
3.1 Validation
Figures 4A,B show the influence of λc and σ on CRI and photon absorption, respectively. Visible is the increase in CRI with increasing σ and the opposite trend for the photon absorption. This is to be expected since σ determines the width of the absorption gap (see Figure 3).
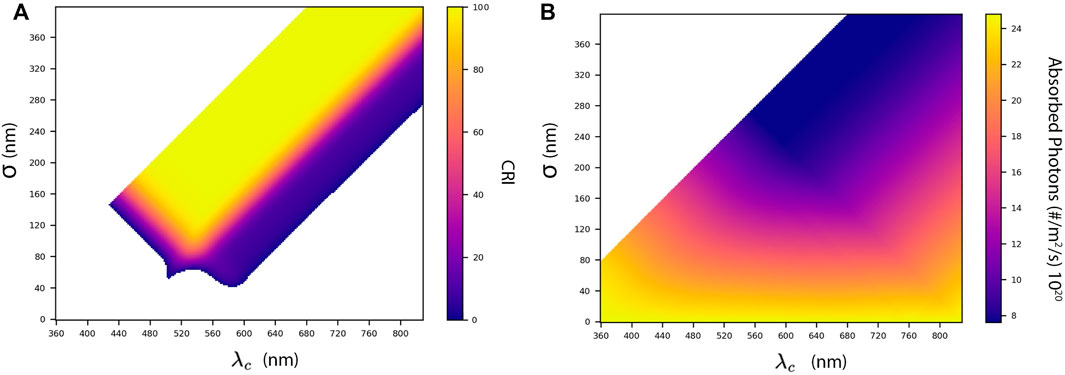
FIGURE 4. (A) CRI as a function of λc and σ. A high CRI is visible starting from σ = 120 at λc = 540 nm. (B) Number of absorbed photons as function of λc and σ. It is clear that photon absorption is increasing with decreasing σ. Note, values for which λc − σ ≤ 280 are colored white in both figures.
In Figure 4A showing the CRI, a triangle is visible with high CRI values starting from λc = 540 nm, which is the top of the photopic response curve and the wavelength most sensitive to the human eye. Photon absorption increases with decreasing σ and shows a similar effect across all shown values of λc. The AM1.5G spectrum does not have enough variation in the range 360–830 nm to influence the effect of λc on photon absorption significantly.
Non-convex optimisation algorithms are prone to finding local optima. Analysing Figures 4A,B shows that global optima should occur around λc = 540 nm and 100 ≤ σ ≤ 200. The decision variable
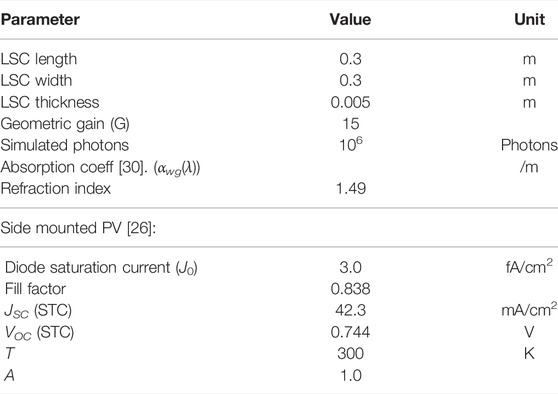
TABLE 1. Parameters used in the PVtrace ray trace algorithm [24].

TABLE 2. RMSE values and mean normalized (NRMSE) between optimised and ray traced values for all tested optimal luminophores shown for absorbed photons (Φ), AVT and CRI.
3.2 PCE, AVT and CRI
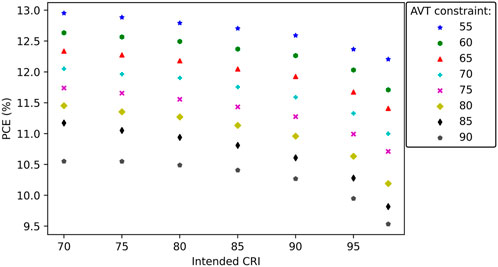
The found PCE by the ray trace algorithm decreases with increasing AVT and CRI as shown in Figure 5. Without constraining the CRI, the highest PCE (14.3%) is obtained for the lowest AVT-constraint of 55% as shown by the grey dots in Figure 5. As expected, the lowest PCE is found for an AVT of 90% and a CRI of 98, resulting in a PCE of 9.53%.
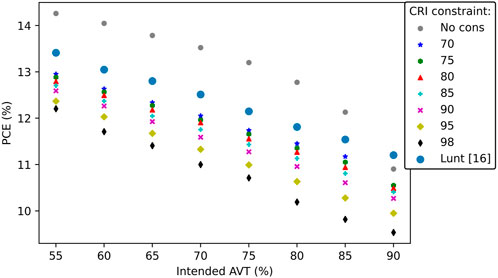
FIGURE 5. AVT and PCE for different CRI constraints, note that the values on the x-axis are the AVT values as found by the optimisation algorithm and may differ slightly from the ray-trace algorithm results, see the Supplementary Material for details. Values from Lunt [16] are based on the practical limit values in Figure 3B in his paper.
When constraining the CRI, the relationship between AVT and PCE is mostly linear, as visible in Figure 5. The linear relationship is due to the necessity of an equal color distribution for high CRI values. This results in λc being mostly equal per CRI constraint with
With only a constraint on the AVT, the relationship between AVT and PCE becomes logarithmic as shown by the grey dots in Figure 5. The logarithmic relationship occurs as a result of the normal distribution of the photopic response curve. To allow for a linear (i.e. 5%) increase in AVT, an increasingly larger part of the visible spectrum needs to be transmitted.
When relating the CRI to the PCE as shown in Figure 6, a logarithmic relationship appears again. Higher CRI values need more light of all wavelengths since the CRI is based on an average of test colors. The resulting relationships thus show an increasing drop of PCE with an increase in CRI. Note that the values with CRI < 90 have Duv values above the confidence threshold of 0.000 ± 0.006 to 0.003 ± 0.006 for solid state lighting [17], see the supplementary Excel for exact values.
Also shown in Figure 5 are the values found in Figure 3B in the paper by Lunt [16]. Lunt’s approach defines a visible transmission between 435–670 nm which assures a CRI of
3.3 Colorimetrics
The resulting transmitted colors for the AVT without a CRI constraint and with a CRI constraint are shown in Figure 7. A zoom-in of both types of constraints is shown in Figures 8A,B. Visible for the AVT-only constraint is a green color between 560–570 nm. This is to expected since the photopic response of the human eye has its peak in the green spectrum.
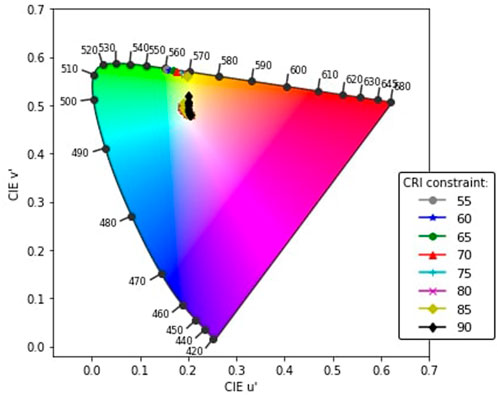
FIGURE 7. u’ and v’ values on the CIE 1976 colorimetric diagram for all ray traced optimal luminophores.
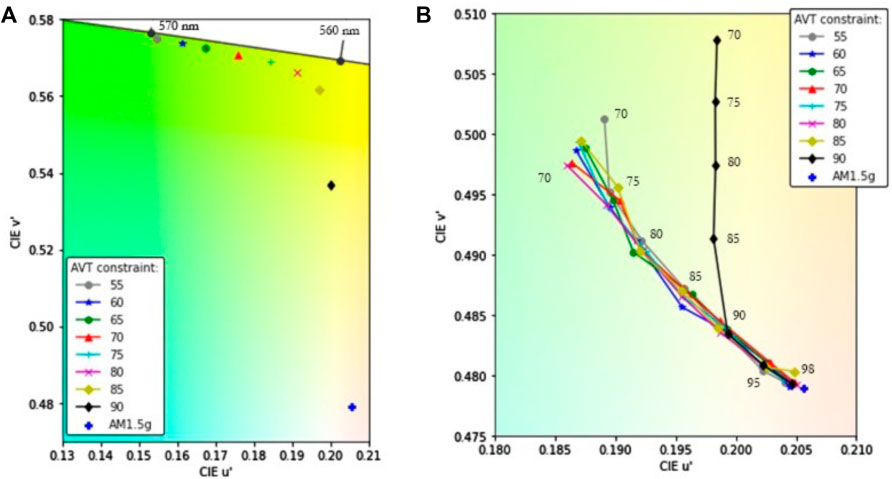
FIGURE 8. Zoom-in of Figure 7. (A) u’ and v’ values on the CIE 1976 colorimetric diagram for the optimised luminophore, constraint only by AVT values. (B) u’ and v’ values on the CIE 1976 colorimetric diagram for the optimised luminophore constraint by AVT and CRI. The numbers indicate the CRI value of the points closest. u’v’ results for AVT values between 85 and 90 (not shown) lie between the results of AVT 85 and 90.
For the AVT and CRI constraint, the values are close together and close to the AM1.5G spectrum color indicated by the blue cross in Figures 8A,B. A high
4 Discussion
4.1 Losses
For optimising photon absorption and calculating the resulting PCE, numerous simplifications have been made. Reflection losses have been ignored. Adding an anti-reflection coating to the front of the LSC will improve the efficiency by avoiding the 4% reflection from the front. The losses from the LSC-PV interface have been ignored as well, beside the losses from the EQEPV as provided by the article by [26], thus improving the efficiency. Further studies can improve the simulated efficiencies by adding an anti-reflection coating and implementing LSC-PV interface reflections.
4.2 Color Quality Metrics
In this article, most of the color quality metrics have been adopted from [16, 23], and [3]. Color quality metrics are however highly subjective to environmental factors and using an individual factor is often not enough to provide accurate predictions [32].
Generally, the CRI is used for assessing color quality, but a host of other metrics exist such as the more developed Color Quality Scale (CQS) (based on 15 test colors), or metrics based on long term color memory (Memory CRI), preference index of skin (PS) and others. See [33] for a more elaborate explanation of each metric. These metrics are most often used for LED applications however, while LSCs are better to be compared to windows.
For window applications, color comfort research has mostly been focused on glazing applications [17, 19]. Some studies have been conducted based on questionnaires and simulated lighting in buildings [34–36] for which results are mostly related to transmission and not related to color quality metrics. Based on [17] and their suggestion to not make CRI a design criterium, a need for a new quantification approach for transmitted light in windows is clear.
4.3 Feasibility of Found Spectra
The found absorption spectra for an optimal luminophore are theoretical only, and don’t adhere to fundamental thermodynamic principles. The found results will thus only serve as a benchmark for (tandem) LSC devices with specific transmission properties. Combinations of luminophores, in a tandem structure, may approach the found spectra however.
[37] in 1981 proposed the tandem LSC as a means of capturing larger fractions of the incoming solar spectrum. Especially with recent advancement in quantum dots as a luminophore, the size dependence of the absorption spectra provide possibilities of combining UV and (N)IR absorbing LSCs in a tandem structure and optimal band-gap coupling with existing PV cells. This principle has already been successfully demonstrated by [38] obtaining a PCE of 3.1%.
5 Conclusion
In this article, a reverse engineering approach is presented that optimizes absorption while constraining colorimetric parameters. This resulted in high theoretical efficiencies that adhere to average visible transmission and color rendering index constraints. The found efficiencies show upper limits of (tandem) LSC devices and can be used as a benchmark.
Despite using contested color metrics the proposed methods can be valuable for optimising (tandem) LSCs, or other transparent PV applications, based on required lighting specifications. Further research can be based on different constraint settings and implementing self-absorption to use the same method for existing luminophores.
Data Availability statement
The original contributions presented in the study are included in the article/Supplementary Material, further inquiries can be directed to the corresponding author.
Author Contributions
TdB: conceptualization, methodology, modeling, writing, reviewing, and editing. WvS: methodology, writing, reviewing, and editing.
Funding
This work was supported by the Dutch Topsector Energy within the framework of the MOOI-BIPVT and the TES-W projects.
Conflict of Interest
The authors declare that the research was conducted in the absence of any commercial or financial relationships that could be construed as a potential conflict of interest.
The reviewer DDB declared a past co-authorship with one of the author WGJHMVS to the handling editor.
Publisher’s Note
All claims expressed in this article are solely those of the authors and do not necessarily represent those of their affiliated organizations, or those of the publisher, the editors and the reviewers. Any product that may be evaluated in this article, or claim that may be made by its manufacturer, is not guaranteed or endorsed by the publisher.
Acknowledgments
The author would like to thank P. Moraitis for his preliminary work on the topic, providing the basis for the research, Yoshikawa et al. for sharing their data on the record efficiency PV cell and C. de Mello-Donegá for discussions and feedback early on in the research.
Supplementary Material
The Supplementary Material for this article can be found online at: https://www.frontiersin.org/articles/10.3389/fphy.2022.856799/full#supplementary-material
References
1. Biyik E, Araz M, Hepbasli A, Shahrestani M, Yao R, Shao L, et al. A Key Review of Building Integrated Photovoltaic (BIPV) Systems. Eng Sci Technol Int J (2017) 20:833–58. doi:10.1016/j.jestch.2017.01.009
2. Kuhn TE, Erban C, Heinrich M, Eisenlohr J, Ensslen F, Neuhaus DH, et al. Review of Technological Design Options for Building Integrated Photovoltaics (Bipv). Energy and Buildings (2021) 231:110381. doi:10.1016/j.enbuild.2020.110381
3. Traverse CJ, Pandey R, Barr MC, Lunt RR. Emergence of Highly Transparent Photovoltaics for Distributed Applications. Nat Energ (2017) 2:849–60. doi:10.1038/s41560-017-0016-9
4. Debije MG, Verbunt PPC. Thirty Years of Luminescent Solar Concentrator Research: Solar Energy for the Built Environment. Adv Energ Mater (2012) 2:12–35. doi:10.1002/aenm.201100554
5. D’Agostino D, Tzeiranaki ST, Zangheri P, Bertoldi P. Assessing Nearly Zero Energy Buildings (Nzebs) Development in Europe. Energ Strategy Rev (2021) 36:100680. doi:10.1016/j.esr.2021.100680
6. Van Sark WG. Luminescent Solar Concentrators – A Low Cost Photovoltaics Alternative. Renew Energ (2013) 49:207–10. doi:10.1016/j.renene.2012.01.030
7. Vishwanathan B, Reinders A, de Boer D, Desmet L, Ras A, Zahn F, et al. A Comparison of Performance of Flat and Bent Photovoltaic Luminescent Solar Concentrators. Solar Energy (2015) 112:120–7. doi:10.1016/j.solener.2014.12.001
8. Reinders A, Kishore R, Slooff L, Eggink W. Luminescent Solar Concentrator Photovoltaic Designs. Jpn J Appl Phys (2008) (2018) 57:08RD10. doi:10.7567/JJAP.57.08RD10
9. Debije MG, Rajkumar VA. Direct versus Indirect Illumination of a Prototype Luminescent Solar Concentrator. Solar Energy (2015) 122:334–40. doi:10.1016/j.solener.2015.08.036
10. Aste N, Tagliabue L, Del Pero C, Testa D, Fusco R. Performance Analysis of a Large-Area Luminescent Solar Concentrator Module. Renew Energ (2015) 76:330–7. doi:10.1016/j.renene.2014.11.026
11. Mangu A. Luminescent Solar Concentrators: A Technology for Solar Windows. Stanford, California: Master’s thesis (2018).
12. Roncali J. Luminescent Solar Collectors: Quo Vadis? Adv Energ Mater (2020) 10:2001907. doi:10.1002/aenm.202001907
13. Slooff LH, Bende EE, Burgers AR, Budel T, Pravettoni M, Kenny R, et al. A Luminescent Solar Concentrator with 7.1% Power Conversion Efficiency. Phys Stat Sol (2008) 2:257–9. doi:10.1002/pssr.200802186
14. Van Sark W. Will Luminescent Solar Concentrators Surpass the 10% Device Efficiency Limit. Bellingham, Washington: SPIE Newsroom (2014).
15. Van Sark W, Krumer Z, De Mello Donega C, Schropp R. Luminescent Solar Concentrators: the Route to 10% Efficiency. Proceedings 40th IEEE Photovoltaic Specialist Conference (PVSC40) (2014). Denver, CO, USA: IEEE. p. 2276–8. doi:10.1109/PVSC.2014.6925380
16. Lunt RR. Theoretical Limits for Visibly Transparent Photovoltaics. Appl Phys Lett (2012) 101:043902. doi:10.1063/1.4738896
17. Dangol R, Kruisselbrink T, Rosemann ADepartment of the Built Environment, Building Lighting Group, Eindhoven University of Technology, Eindhoven, The NetherlandsDepartment of the Built Environment, Building Lighting Group, Eindhoven University of Technology, Eindhoven, The Netherlands. Effect of Window Glazing on Colour Quality of Transmitted Daylight. J Daylighting (2017) 4:37–47. doi:10.15627/jd.2017.6
18. Lynn N, Mohanty L, Wittkopf S. Color Rendering Properties of Semi-transparent Thin-Film PV Modules. Building Environ (2012) 54:148–58. doi:10.1016/j.buildenv.2012.02.010
19. Ghosh A, Norton B. Interior Colour Rendering of Daylight Transmitted through a Suspended Particle Device Switchable Glazing. Solar Energ Mater Solar Cell (2017) 163:218–23. doi:10.1016/j.solmat.2017.01.041
20. Gunde MK, Krašovec UO, Platzer WJ. Color Rendering Properties of interior Lighting Influenced by a Switchable Window. J Opt Soc Am A (2005) 22:416. doi:10.1364/JOSAA.22.000416
21. Yang C, Lunt RR. Limits of Visibly Transparent Luminescent Solar Concentrators. Adv Opt Mater (2017) 5:1600851. doi:10.1002/adom.201600851
22. Goetzberger A, Greube W. Solar Energy Conversion with Fluorescent Collectors. Appl Phys (Kowloon) (1977) 14:123–39. doi:10.1007/BF00883080
23. Yang C, Liu D, Lunt RR. How to Accurately Report Transparent Luminescent Solar Concentrators. Joule (2019) 3:2871–6. doi:10.1016/j.joule.2019.10.009
24. PVtrace FD. Optical ray Tracing for Luminescent Materials and Spectral Converter Photovoltaic Devices (2019). Cambridge: Python Library.
25. Zettl M, Mayer O, Klampaftis E, Richards BS. Investigation of Host Polymers for Luminescent Solar Concentrators. Energy Technol (2017) 5:1037–44. doi:10.1002/ente.201600498
26. Yoshikawa K, Kawasaki H, Yoshida W, Irie T, Konishi K, Nakano K, et al. Silicon Heterojunction Solar Cell with Interdigitated Back Contacts for a Photoconversion Efficiency over 26%. Nat Energ (2017) 2:17032. doi:10.1038/nenergy.2017.32
28.International Commission on Illumination. Method of measuring and specifying colour rendering properties of light sources. No. 13.3-1995 in CIE (Austria: Commission internationale de l’Éclairage. Vienna, Austria: CIE Central Bureau (1995).
29. Moraitis P, Van Leeuwen G, van Sark W. Visual Appearance of Nanocrystal-Based Luminescent Solar Concentrators. Materials (2019) 12:885. doi:10.3390/ma12060885
30. Hu X, Kang R, Zhang Y, Deng L, Zhong H, Zou B, et al. Ray-Trace Simulation of CuInS(Se)_2 Quantum Dot Based Luminescent Solar Concentrators. Opt Express (2015) 23:A858. doi:10.1364/OE.23.00A858
32. Guo X, Houser K. A Review of Colour Rendering Indices and Their Application to Commercial Light Sources. Lighting Res Technology (2004) 36:183–97. doi:10.1191/1365782804li112oa
33. Bhusal P, Dangol R. Performance of Different Metrics Proposed to CIE TC 1-91. Int J Sustainable Lighting (2017) 19:91. doi:10.26607/ijsl.v19i2.36
34. Pineault N, Dubois MC. Effect of Window Glazing Type on Daylight Quality: Scale Model Study of a Living Room under Natural Sky. LEUKOS (2008) 5:83–99. doi:10.1582/LEUKOS.2008.05.02.001
35. Zinzi M. Office Worker Preferences of Electrochromic Windows: a Pilot Study. Building Environ (2006) 41:1262–73. doi:10.1016/j.buildenv.2005.05.010
36. Clear R, Inkarojrit V, Lee E. Subject Responses to Electrochromic Windows. Energy and Buildings (2006) 38:758–79. doi:10.1016/j.enbuild.2006.03.011
37. Goetzberger A, Wittwer V. Fluorescent Planar Collector-Concentrators: A Review. Solar Cells (1981) 4:3–23. doi:10.1016/0379-6787(81)90033-8
Keywords: average visible transmission, color rendering index, luminescent solar concentrator, luminophore, optimisation
Citation: de Bruin TA and van Sark WGJHM (2022) Optimising Absorption in Luminescent Solar Concentrators constraint by Average Visible Transmission and Color Rendering Index. Front. Phys. 10:856799. doi: 10.3389/fphy.2022.856799
Received: 17 January 2022; Accepted: 15 June 2022;
Published: 22 July 2022.
Edited by:
Un-Gi Jong, Kim Il Sung University, DPR KoreaCopyright © 2022 de Bruin and van Sark. This is an open-access article distributed under the terms of the Creative Commons Attribution License (CC BY). The use, distribution or reproduction in other forums is permitted, provided the original author(s) and the copyright owner(s) are credited and that the original publication in this journal is cited, in accordance with accepted academic practice. No use, distribution or reproduction is permitted which does not comply with these terms.
*Correspondence: Wilfried G. J. H. M. van Sark, dy5nLmouaC5tLnZhbnNhcmtAdXUubmw=
 Thomas A. de Bruin
 Wilfried G. J. H. M. van Sark