- 1School of Optics and Photonics, Beijing Institute of Technology, Beijing, China
- 2Beijing Key Laboratory for Precision Optoelectronic Measurement Instrument and Technology, Beijing, China
- 3Yangtze Delta Region Academy of Beijing Institute of Technology, Jiaxing, China
Early accurate diagnosis and assessment severity of the hypoxic state of diabetic foot is of paramount importance. In this paper, a noninvasive monitoring method of the hypoxic state of the diabetic foot based on diffuse reflectance spectroscopy is proposed. Monte Carlo simulation method is used to imitate the effect on diffuse reflectance of the foot from different blood volume fractions and blood oxygen saturations. Moreover, the in vivo experiments of the hypoxic state of the foot based on the binding method is carried out using an integrating sphere system. Monte Carlo simulation results show that the diffuse reflectance of the foot under normal state and hypoxic state is significantly different. In vivo experimental results are highly consistent with the Monte Carlo simulation results. In vivo experiments further indicate that six characteristic wavelengths (440, 469, 514, 540, 560, and 576 nm) of the diffuse reflectance are more able to distinguish the normal oxygen state and hypoxic states of the foot. The proposed method promotes the development and application of the diffuse reflectance spectroscopy method in the noninvasive detection of biological tissue.
1 Introduction
Diabetes mellitus (DM) is a metabolic disorder disease characterized by hyperglycemia. According to the statistics of the World Health Organization, the complications caused by DM are more than 100, involving diabetic retinopathy, diabetic nephropathy, and even death [1, 2]. Among these complications, the incidence rate of diabetic foot is as high as 25% [3]. The etiology of diabetic foot is extremely complicated. Peripheral arterial disease (PAD) plays a major role in the pathogenesis of diabetic foot, which has been generally recognized. PAD is a common finding in DM patients with diabetic foot complications and is associated with poor outcomes, such as amputation. PAD leads to vasoconstriction, which will block the vascular microcirculation, reduce the blood supply of the lower limbs, and finally generate foot infection and gangrene. Pay special attention to the oxygen assessment and blood perfusion of the vascular microcirculation of the foot, especially the changes of blood volume fraction and blood oxygen saturation, which is very important to monitor the deterioration degree of foot lesions. Timely diagnosis and treatment of the foot may even reverse the occurrence of foot complications in the preclinical stage. Doppler test [4], percutaneous oxygen tension [5], and angiography may be the most prevalent used approaches for clinically monitoring the blood oxygen status of the lower extremity vascular microcirculation in patients with DM. However, these methods not only rely on expensive instruments and professional knowledge to evaluate the vascular microcirculation state and blood perfusion in the diabetic foot, but also are difficult to judge these changes in real-time and quickly.
The diffuse reflectance spectroscopy (DRS) method uses optical analysis methods to obtain real-time optical information such as physiology, morphology, and composition of human tissue, which has become one of the main noninvasive research methods of human tissue. DRS method has been widely used to characterize normal and malignant states of different types of human tissues including colon [6], cervix [7], ovary [8], breast [9], liver [10], lung [11], and skin tumors [12]. Recently, the DRS method has been gradually applied to the study of diabetic foot. Kumar et al. [13] quantitatively measured localized blood volume fraction from various sites of the human foot sole by using the DRS. The investigation also illustrated that the blood volume fractions were different from four sites of the human foot sole. Anand et al. [14] implemented a DRS approach to monitor blood oxygenation of diabetic foot. This study mainly indicated the relationships among diffuse reflectance intensity measurements, tissue oxygenation, and wound healing process. However, these related studies only achieved the measurement of diffuse reflectance spectra of the diabetic foot in DM patients and studied a simple analysis of these spectra. Pathological analysis of diabetic foot is insufficient. In addition, for DM patients without diabetic foot complications, monitoring the diffuse reflectance spectra of the foot is also very important for preventing the occurrence and deterioration of diabetic foot. Lower extremities of DM patients with an early diabetic foot complication often suffer from numbness, weakness, and other symptoms [15, 16]. Unfortunately, these symptoms are often ignored due to no obvious wound on the surface of the DM patients’ foot. Due to lack of foot care, foot hygiene and minor wounds are underestimated, which further leads to the deterioration of foot ulcers. To our best of knowledge, the DRS method has not been demonstrated to be devoted to exploring the pathology of the hypoxic state of diabetic foot.
The purpose of our current research is to qualitatively determine the pathological mechanism of the hypoxic state of the diabetic foot by simulation and in vivo experiments. In this paper, Monte Carlo (MC) [17] simulation is implemented to imitate the hypoxic state of the foot. In the MC simulation experiments, a nine-layer skin model in terms of optical characteristics of the foot skin tissue is established. Combined with the skin tissue model, the hypoxic state of the foot is created by adjusting blood oxygen saturation and blood volume fraction. Based on the MC simulation experiments, the pathological mechanism of the hypoxic state of the foot is analyzed. The MC simulation results are further verified by in vivo experiments, i.e., binding the subjects’ toes with the elastic bands to imitate the hypoxic state of the foot. To elucidate the effect of changes in the hypoxia degree on the diffuse reflectance, experiments on the hypoxia degree in the toes are also performed. The pathological mechanism of foot hypoxia and the significance of foot hypoxia monitoring are indicated based on MC simulation and in vivo experiments.
2 Materials and Methods
2.1 Monte Carlo Simulation
To accurately simulate the changes of the diffuse reflectance resulting from blood oxygen saturation and blood volume fraction of DM patients’ foot, an appropriate skin tissue model is required to establish. Due to the multi-layer structure and physiological characteristics of skin tissue, the establishment of the skin tissue model is extremely complex. The traditional three-layer tissue model is composed of epidermis, dermis, and subcutaneous tissue, which is simple and convenient to calculate. However, the traditional skin tissue model assumes that chromophores are uniformly distributed on the epidermis or dermis. Therefore, the traditional skin tissue model makes the simulation value deviate greatly from the truth value in terms of diffuse reflectance.
In this paper, we adopt the nine-layer skin tissue model designed by Maeda [18]. The epidermis and dermis of the nine-layer skin tissue model are finely divided on the basis of the three-layer traditional tissue model. Figure 1 shows the nine-layer structure of the skin tissue model. The stratum corneum (L1) is located above the epidermis. The epidermal layer is mainly composed of stratum granulosum and stratum spinosum (L2), and the stratum basale (L3). The dermis is under the epidermis and classified into five layers consisting of the papillary dermis (L4), subpapillary dermis (L5), upper blood net dermis (L6), reticular dermis (L7), and deep blood net dermis (L8), respectively. The subcutaneous tissue (L9) is under the dermis.
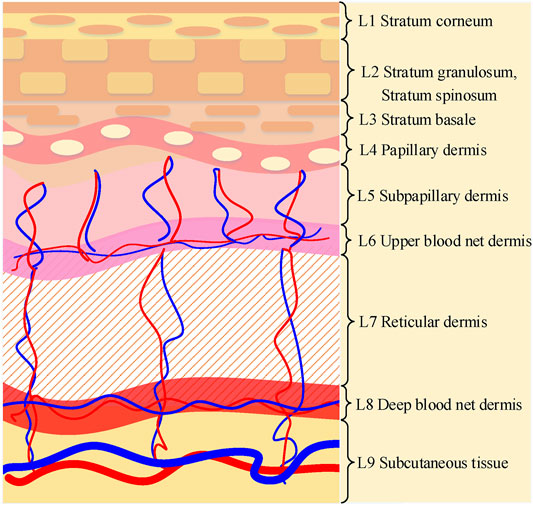
FIGURE 1. Illustration of nine-layer structure of skin tissue: stratum corneum (L1), stratum granulosum and stratum spinosum (L2), stratum basale (L3), papillary dermis (L4), subpapillary dermis (L5), upper blood net dermis (L6), reticular dermis (L7), deep blood net dermis (L8) and subcutaneous tissue (L9), respectively.
Each layer of skin tissue contains particular chromophores, which determines each layer of skin tissue with specific optical absorption properties. The baseline absorption of both epidermis and dermis is expressed by the following μa.baseline [19], approximated as a function of wavelength λ:
The absorption coefficient of the dermis depends on a minor baseline skin absorption (water, fat, and other absorption components) and a dominant hemoglobin absorption due to the cutaneous blood perfusion.
where Bf denotes blood volume fraction, S denotes the blood oxygen saturation. μa.oxy and μa.deoxy are the absorption coefficient of oxyhemoglobin and deoxyhemoglobin respectively, for the hematocrit Ht = 45% [20].
The chromophore of the epidermis is mainly melanin. The absorption coefficient of the epidermis is followed as:
where Mf denotes the melanin volume fraction and μa.mel denotes the melanin absorption coefficient. The values of Mf and μa.mel are from Ref. [21].
The fibrous components in the dermis such as collagen and elastin, are related to the scattering properties of the skin tissue. Scattering properties are the contributions due to Rayleigh scattering by the small-scale structure associated with the collagen fibers and other cellular structures and the Mie scattering by the large cylindrical dermal collagen fibers.
The reduce scattering coefficients of the Rayleigh scattering and Mie scattering can be written as
The scattering theory of Eq. 4 and Eq. 5 comprehensively analyzes the relationship between wavelength and various components in skin tissue. The scattering coefficient of the epidermis and dermis can be approximated as a standard value by using the relation equation given by Gemert [22].
where the anisotropy parameter (g) of the epidermis and dermis is approximately written as:
The refractive index is given by Meglinski [23], and the tissue thickness is from the Das [24]. We adjust the above parameters of optical properties in each layer of skin tissue based on data from these empirical literature, and finally establish the skin tissue model of the foot. MC simulation is employed to simulate the diffuse reflectance spectra of the foot according to these parameters of optical properties.
2.2 Experiment Setup
A single integrating sphere system designed by our team to measure the diffuse reflectance spectra of the foot in vivo is shown in Figure 2. The single integrating sphere system mainly consists of a deuterium tungsten halogen light source (HYBEC, HBL-273) with the wavelength in the range of 190–800 nm, an integrating sphere (Aimealth Technology Co., Ltd., Beijing), a photomultiplier tube (Hamamatsu, R928) and a computer. The power of the single integrating sphere system is 20W. The light emitted from the halogen light is split through a monochromator in the beam-splitting system to emit light of a specific wavelength, and then reaches the sample port of the integrating sphere through a series of mirrors. Subsequently, the light reflected by the sample tissue, carrying the optical information of the tissue, undergoes a series of reflections and refractions in the integrating sphere, and is finally received by the photomultiplier tube. The photomultiplier tube transmits the received diffuse light to the computer. The computer processed the diffuse reflectance spectra of the foot under the control of the self-made spectroscopy software.
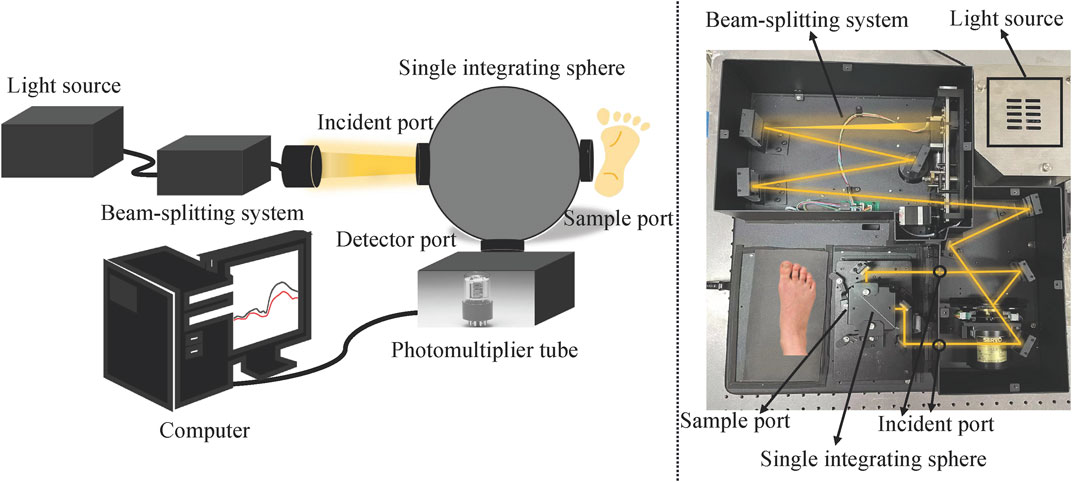
FIGURE 2. Scheme of the integrated single integrating sphere system (Left); Physical diagram of the single integrating sphere system (Right). The light emitted from the halogen light is split through a monochromator in the beam-splitting system to emit light of a specific wavelength, focuses on the incident port and reaches the sample port. Subsequently, the light reflected by the sample tissue through a series of reflections and refractions in the integrating sphere, which is finally received by the photomultiplier tube at the detection port.
For each measurement, the diffuse reflectance spectra of the white reflectance standard (SRS-99-010, Labsphere, Inc., North Sutton, NH) and background noise are measured first. The diffuse reflectance of the sample tissue (MR(λ)) is calculated according to the diffuse reflectance spectra of the sample tissue, the white reflectance standard, and the background noise. Eq. 8 is written as follows:
where the diffuse reflectance spectrum of the sample tissue is expressed as R(r), the diffuse reflectance spectrum of the white reflectance standard is expressed as Rstd, and the diffuse reflectance spectrum of the background noise is expressed as Rdark.
The subjects’ great toes are selected as our measurement site since great toes are easy to bind and measure. The diffuse reflectance spectrum of each subject’s great toe is measured in the same environment and kept clean. To avoid interference from external pressure, we choose the same type of elastic bands, the same number loops of an elastic band, and the same binding time to control the pressure [25] for every subject in vivo experiments. During the measurement process, the same site of the subjects’ foot is chosen each time. First, the diffuse reflectance spectrum of the subjects’ great toes under a normal state is measured by the integrating sphere system. Subsequently, the diffuse reflectance spectrum from the same site of a great toe is measured again when the subjects’ great toe is bound over time t.
3 Results and Discussion
3.1 Results and Analysis of MC Simulation Experiments
The changes in blood volume fraction and blood oxygen saturation mainly affect the optical parameters of the dermis and subcutaneous tissue, specifically the L4-L9 layer of the skin tissue model (Shown in Figure 1). Adjusting blood volume fraction and blood oxygen saturation of the L4-L9 layer, the diffuse reflectance of the great toes under normal state and hypoxic state are simulated.
For healthy people, the blood volume fraction is between 2% and 7% and the blood oxygen saturation is above 95%. To simulate the diffuse reflectance under different oxygen states, different concentration ranges of blood volume fraction and blood oxygen saturation are set based on parameters of healthy people. First, the blood volume fraction varies over a wide range, while the oxygen saturation maintains a healthy parameter to simulate diffuse reflectance. Subsequently, the blood volume fraction maintains unchanged, and the blood oxygen saturation is changed in a large range, thereby realizing the simulation of diffuse reflectance. The simulation results are shown in Figure 3. Bf denotes blood volume fraction and S denotes the blood oxygen saturation. Figure 3A indicates the diffuse reflectance in the blood volume fraction with the range of 0.1%–20% and the blood oxygen saturation with 98%. When the blood oxygen saturation remains constant at 98%, the diffuse reflectance decreases as the blood volume fraction increases. When the blood volume fraction is less than the normal level (<2%), the gap from peak and valley of diffuse reflectance in the wavelength range of 540–580 nm gradually gets smaller. When the blood volume fraction is higher than the normal level (>7%), the variation amplitude of the diffuse reflectance in the wavelength range of 440–520 nm is lower than the normal blood volume fraction. Figure 3B shows the changes of the diffuse reflectance of the skin tissue when the blood volume fraction is at a healthy level and the blood saturation changes from healthy states (95%, 98%) to abnormal states (75%, 80%, 85%, and 90%). When the blood volume fraction is 2%, although the blood oxygen saturation decreases from the normal level (more than 95%) to the abnormal level, the diffuse reflectance basically maintains the same trend. However, the shape of the diffuse reflectance produces a flip in the wavelength range of 400–440 nm. This flip is mainly due to changes in the absorption coefficients of oxyhemoglobin and deoxyhemoglobin. The diffuse reflectance exhibits pathological features when the blood volume fraction is above healthy levels and blood oxygen saturation is below healthy levels.
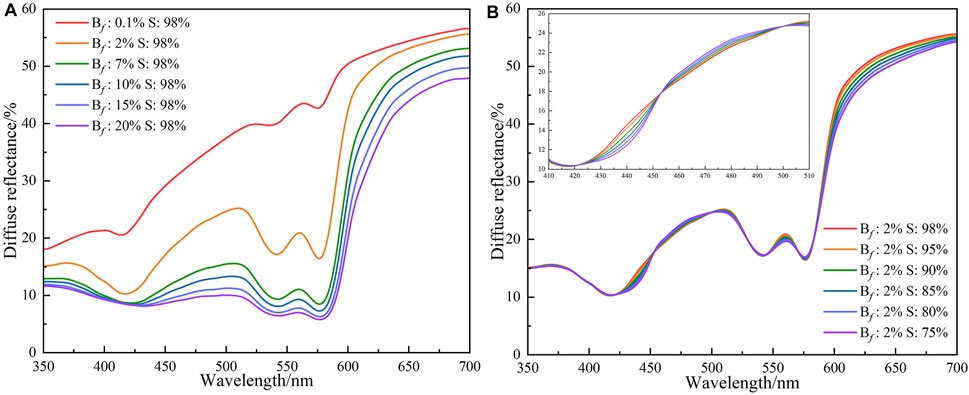
FIGURE 3. The diffuse reflectances of different blood volume fraction and blood oxygen saturation: (A) The blood oxygen saturation is 98%, and the blood volume fraction is 0.1%, 2%, 7%, 10%, 15%, and 20%; (B) The blood volume fraction is 2%, and the blood oxygen saturation is 75%, 80%, 85%, 90%, 95%, and 98%.
To verify the above analysis, further simulations are carried out with increased blood volume fraction and decreased blood oxygen saturation. The blood volume fraction we adopted is above the healthy level (2%–7%), which is 10% and 20%, respectively. The blood oxygen saturation is lower than the healthy level (95%–100%) and is set to 55%, 65%, and 75%, respectively. The simulation results of diffuse reflectance based on the MC algorithm are shown in Figure 4. The simulated diffuse reflectance of the great toe first bulge and then descend with the wavelength range of 450–530 nm compared with the diffuse reflectance under normal state. The diffuse reflectance of oxyhemoglobin and deoxyhemoglobin (543–585 nm) are attenuated under hypoxia compared with normal conditions. Combining the optical characteristic parameters of oxyhemoglobin and deoxyhemoglobin, when the blood volume fraction increases and the blood oxygen saturation decreases, the absorption coefficient of the tissue will increase (the effect of oxygen saturation on the absorption coefficient predominates when fluctuations in the fractional blood volume are small). The other optical properties caused by blood volume fraction and blood oxygen saturation are ignored. Therefore, the absorption coefficient of the skin tissue increases, while the scattering coefficient remains relatively unchanged, which will lead to an increase in light absorption and a corresponding decrease in diffuse reflectance. Figure 4 shows that when the blood volume fraction is from 10% to 20% (oxygen saturation remains the same), the diffuse reflectance in the wavelength range of 400–500 nm significantly decrease. Figure 4 indicates the pathology of the diabetic foot, i.e., hypoxia results in increased blood volume fraction and decreased blood oxygen saturation in localized areas of the foot.
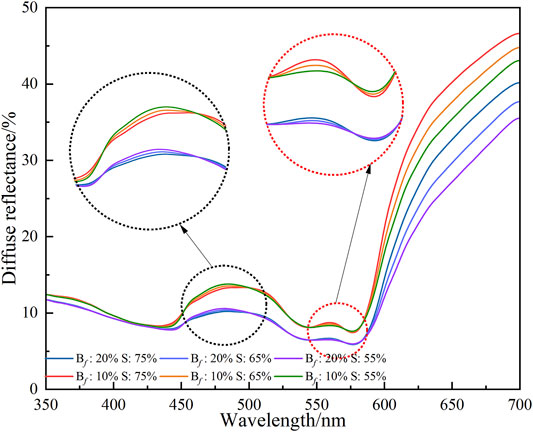
FIGURE 4. The diffuse reflectances of more blood volume fraction and lower blood oxygen saturation. The blood oxygen saturation is 55%, 65%, and 75%, respectively. The blood volume fraction is 10% and 20%, respectively.
The above MC simulation results show that hyperglycemia damages the nerve fiber and reduces blood supply, causing tissue hypoxia and metabolism alteration in the lower limbs. The vasoconstriction of the lower limbs of DM patients leads to insufficient blood supply and tissue hypoxia. In terms of optical characteristic parameters, these problems lead to increased blood volume fraction and decreased oxygen saturation in the local area.
3.2 Results and Analysis of In vivo Experiments
To further verify the simulation results of MC under hypoxia state, in vivo experiments are implemented. The occurrence of the diabetic foot means that the patient already has DM. A variety of complications DM accompanied that have a certain impact on blood circulation. Therefore, to analyze the pathological mechanism of the hypoxic state of the diabetic foot, healthy people are selected as our subjects. We imitate the hypoxic state of the diabetic foot by binding elastic bands to the great toes of healthy people and measure the diffuse reflectance spectra of great toes by a single integrating sphere system (See Section 3). A total of 34 healthy subjects (19 men and 15 women), aged 20–35 years, are studied. The research protocol is approved by the Medical Ethics Committee of Medical and Laboratory Animal of Beijing Institute of Technology with approval code 2021–004. Detailed information on healthy subjects is from the Beijing Institute of Technology shown in Table 1.
Figure 5 shows the diffuse reflectance of the great toes of three subjects (A, B, and C) under normal state and hypoxic state (binding time t for 1 min). The blue solid lines represent the diffuse reflectances under normal state, and the red solid lines represent the diffuse reflectances under hypoxic state. The trends of diffuse reflectances of three subjects’ great toes under normal state and hypoxic state in the wavelength range of 350–700 nm are roughly consistent and are corresponding with the MC simulation results (Shown in Figure 3 and Figure 4). When the toe is bound by an elastic band, the transport of oxygen is blocked and the local tissue swells. Compared with the diffuse reflectances under normal state, the amplitudes and shapes of diffuse reflectances of three subjects’ great toes are moving down in wavelength range 350–700 nm under the hypoxic state. The peaks and valleys of the diffuse reflectances almost completely disappear, specifically in the wavelength range of blood oxygen saturation and hemoglobin sensitive area, i.e., wavelength in the range with 540–580 nm. The diffuse reflectances have inflection points at some special wavelengths compared with the normal oxygen state. The wavelengths of these inflection points are 440, 469, 514, 540, 560, and 576 nm, respectively. In all subjects, these diffuse reflectances under normal state are consistent with the related literature [26], which can confirm the correctness of the diffuse reflectance from MC simulated and the integrating sphere system collected. Combined with the absorption maxima of some chromophores of the skin tissue and inflection points of the subject’s diffuse reflectances, six average wavelengths are selected as the characteristic wavelengths. The six characteristic wavelengths are shown in Table 2.

FIGURE 5. The diffuse reflectances of three subjects under normal state and hypoxic state. (A) The diffuse reflectance of the subject A; (B) The diffuse reflectance of the subject B; (C) The diffuse reflectance of the subject C.
In fact, hypoxia problems can also cause the skin on the foot to darken, appearing red or purple. Prolonged hypoxia can cause foot skin ulcers and even cause more serious lesions. However, the color change of skin tissue caused by hypoxia is not obvious at first. Due to the thicker skin of the foot, it is still difficult to distinguish the hypoxia degree from the color of the foot despite chronic hypoxia. In addition, due to the lack of sensitivity of the foot skin, we also lack special attention to these changes. To further prove the effect of blood volume fraction and blood oxygen saturation to the toes involving the surface skin color and diffuse reflectance, we achieve the hypoxia degree experiment. In the hypoxia degree experiment, we adopt the same binding method for the great toes as the above experiment, only change the binding time for the hypoxia degree experiment. The time when the great toe is not tied with the elastic band is taken as the initial time, and the corresponding diffuse reflectance is marked as the normal state. As the time for the great toes to bind the elastic band increased, the diffuse reflectance of the great toes are measured in 1st, 10th, 20th and 30th min, respectively. Finally, five diffuse reflectances within 30 min from each subject are obtained. We capture the image area where the toes are bound with the elastic within 30 min. The device for collecting images is an ordinary camera (FLIR co. BFLY-U3-23S6C-C) with a resolution of 1920 × 1,200 pixels. The skin color change and degree of edema of the great toe in the subject A are shown in Figure 6. With the increase of great toe binding time, the skin color presents a changing dark red. The elastic band prevents the blood flow of the great toe, causes insufficient oxygen supply, so the great toe is swollen. However, when the great toe binding time is too long, the effect of the degree of hypoxia on changes in skin color was difficult to distinguish.

FIGURE 6. The change of skin color and degree of edema of great toe from subject A. The red numbers in the figures indicate the time when the toe is bound by the elastic band.
The diffuse reflectances obtained by the hypoxia degree experiment from subject A are shown in Figure 7. Figure 7 shows that the characteristics of the diffuse reflectances under different binding times are consistent with the results of our simulation and in vivo experiments. More specifically, the diffuse reflectances obviously increase with binding time t in the 1st, 10th, 20th, and 30th min, respectively. A similar trend is also found from the diffuse reflectances of other subjects’ great toes. When the great toe is just bound, the blood oxygen saturation decreases rapidly and the blood volume fraction increases, so the absorption coefficient of the skin tissue increases. The absorption coefficient of the skin tissue increases, while the change of the scattering coefficient is ignored, resulting in an increase in the absorption of light by the tissue and a decrease in the diffuse reflectance obtained by the integrating sphere. When the binding time t reaches a certain level, the local hyperemia of the great toe begins to increase relatively slowly, i.e., the blood volume fraction maintains a relatively stable change state. Although the blood volume fraction changes slowly with the increase of the binding time t, the blood oxygen saturation is still decreasing, resulting in a decrease in the absorption coefficient of the tissue based on the initial state, which makes the tissue diffuse reflectance obtained by the integrating sphere increase steadily. This explains the increase of the amplitudes of the diffuse reflectances under a hypoxic state over binding time t. To further analyze the diffuse reflectances at characteristic wavelengths, the diffuse reflectance value at the 0th minute is set to R0 and the diffuse reflectance value at other times is set to the Rminute. The value changes of diffuse reflectance can be written as Eq. 9.
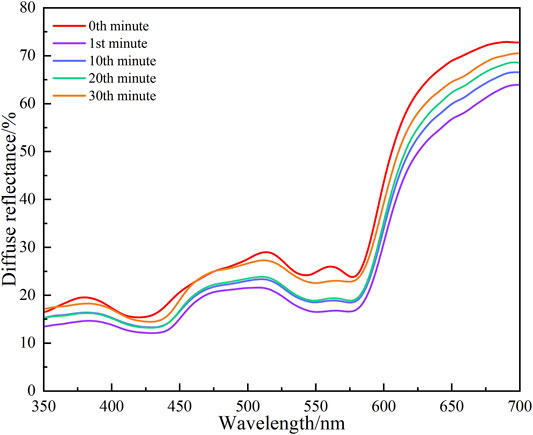
FIGURE 7. Diffuse reflectances of subject A in hypoxia degree experiment with time followed by 0th, 1st, 10th, 20th, and 30th min, respectively.
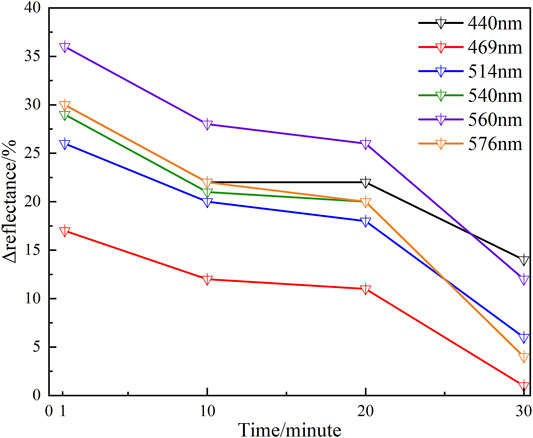
The values of Δreflectance at six characteristic wavelengths with binding time t are shown in Table 3. Table 3 indicates that at any characteristic wavelength, the value of Δreflectance decreases with the increase of binding time t. The minimum value of Δreflectance is 0.01 at 469 nm wavelength. At characteristic wavelengths of the oxyhemoglobin (540 and 576 nm), the values of Δreflectance are basically the same at different binding times t. Especially at the 20th and 30th min, the values of Δreflectance at these two wavelengths are 0.20 and 0.04, respectively. Figure 8 shows that when the time changes from the 10th minute to the 20th min, the values of Δreflectance at the characteristic wavelengths are relatively smooth. From the 1st min to the 10th min (the hypoxia state just starts) and the 20th min to the 30th min (longer duration of the hypoxia), the changes of Δreflectance fluctuate greatly. However, the effect on skin color is not obvious. These results illustrate that the diffuse reflectances at these characteristic wavelengths are more meaningful for the evaluation of the hypoxia degree. In vivo experiments illustrate that when lower extremity vascular microcirculation is hindered and the oxygen supply is insufficient, the diffuse reflectances of the tissue are obviously different from those of the normal state, especially at these characteristic wavelengths. Therefore, monitoring diffuse reflectance at characteristic wavelengths timely to evaluate the blood oxygen supply level has great potential to prevent tissue lesions caused by insufficient oxygen supply. The hypoxic state simulation of the great toes is caused by pressure generated by the binding elastic bands in this method. In fact, the pressure also affects the absorption coefficient and scattering coefficient of the skin, resulting in changes in the diffuse reflectance of the skin tissue [27]. Moreover, the diffuse reflectances at characteristic wavelengths have some differences due to the influence of individual and hypoxic degrees. Therefore, comprehensively analyzing the changes of diffuse reflectances at multiple characteristic wavelengths to determine the hypoxia degree of the great toes is necessary. Indeed, the diffuse reflectances of patients with the diabetic foot are more complex due to pathology. Patients with such hypoxic symptoms may also be accompanied by other diseases. Thus, when the diffuse reflectances from the patient’s foot are matching the phenomenon of the hypoxic condition, further combining the patient’s usual symptoms and clinical diagnosis to determine the patient suffering from the degree of the diabetic foot. Monitoring the diffuse reflectance of the patient’s foot to determine whether the patient has symptoms of hypoxia, and early treatment is adopted to prevent the symptoms from further worsening, which is of great significance for the prevention of diabetic foot.

TABLE 3. The change values of diffuse reflectances at characteristic wavelengths with binding time t.
4 Conclusion
We propose and demonstrate a noninvasive DRS method for the assessment and monitoring of the hypoxic state in the diabetic foot. Based on MC simulation, a nine-layer skin tissue model is established. This model is used to simulate the diffuse reflectance of the pathological mechanism of hypoxia in the diabetic foot. MC simulation experiments show that the diffuse reflectances under the hypoxic condition are quite different from under a normal state. Subsequently, we verify the MC simulation results are consistent with the in vivo experiments by the toes binding method. In vivo experiments further indicate that the diffuse reflectances at characteristic wavelengths are extremely effective to distinguish the healthy state and hypoxic state.
For DM patients with symptoms such as lower extremity hypoxia, monitoring the diffuse reflectance rather than the change in foot skin color can prevent further deterioration of the hypoxic state. Our preliminary results illustrate that the DRS approach has the potential to quantitatively determine the hypoxic state of the foot in a noninvasive manner. This method provides a novel idea for the detection of the most susceptible part of diabetic foot ulcers and is expected to prevent the occurrence of the diabetic foot.
Data Availability Statement
The raw data supporting the conclusion of this article will be made available by the authors, without undue reservation.
Ethics Statement
The studies involving human participants were reviewed and approved by the Medical Ethics Committee of Medical and Laboratory Animal of Beijing Institute of Technology with approval code 2021-004. The patients/participants provided their written informed consent to participate in this study. Written informed consent was obtained from the individual(s) for the publication of any potentially identifiable images or data included in this article.
Author Contributions
All authors listed have made a substantial, direct, and intellectual contribution to the work and approved it for publication.
Funding
This work was supported by the National Natural Science Foundation of China (Nos. 61705010, 11774031, and 61935001).
Conflict of Interest
The authors declare that the research was conducted in the absence of any commercial or financial relationships that could be construed as a potential conflict of interest.
Publisher’s Note
All claims expressed in this article are solely those of the authors and do not necessarily represent those of their affiliated organizations, or those of the publisher, the editors and the reviewers. Any product that may be evaluated in this article, or claim that may be made by its manufacturer, is not guaranteed or endorsed by the publisher.
References
1. Sen S, Chakraborty R. EDITORIAL (Thematic Issue: Treatment and Diagnosis of Diabetes Mellitus and its Complication: Advanced Approaches). Mrmc (2015) 15(14):1132–3. doi:10.2174/138955751514151006154616
2. Schmidt AM. Highlighting Diabetes Mellitus. Atvb (2018) 38(1):e1–e8. doi:10.1161/atvbaha.117.310221
3. Boulton AJM, Armstrong DG, Albert SF, Frykberg RG, Hellman R, Kirkman MS, et al. Comprehensive Foot Examination and Risk Assessment. Diabetes care (2008) 31(8):1679–85. doi:10.2337/dc08-9021
4. Beckert S, Witte MB, Konigsrainer A, Coerper S. The Impact of the Micro-lightguide O2C for the Quantification of Tissue Ischemia in Diabetic Foot Ulcers. Diabetes care (2004) 27(12):2863–7. doi:10.2337/diacare.27.12.2863
5. Cina C, Katsamouris A, Megerman J, Brewster DC, Strayhorn EC, Robison JG, et al. Utility of Transcutaneous Oxygen Tension Measurements in Peripheral Arterial Occlusive Disease. J Vasc Surg (1984) 01(2):362–71. doi:10.1016/0741-5214(84)90069-7
6. Zonios G, Perelman LT, Backman V, Manoharan R, Fitzmaurice M, Van Dam J, et al. Diffuse Reflectance Spectroscopy of Human Adenomatous colon Polyps In Vivo. Appl Opt (1999) 38(31):6628–37. doi:10.1364/ao.38.006628
7. Mirabal YN, Chang SK, Atkinson EN, Malpica A, Follen M, Richards-Kortum R. Reflectance Spectroscopy for In Vivo Detection of Cervical Precancer. J Biomed Opt (2002) 7(4):587–94. doi:10.1117/1.1502675
8. Utzinger U, Brewer M, Silva E, Gershenson D, Blast RC, Follen M, et al. Reflectance Spectroscopy for In Vivo Characterization of Ovarian Tissue. Lasers Surg Med (2001) 28(1):56–66. doi:10.1002/1096-9101(2001)28:1<56::aid-lsm1017>3.0.co;2-l
9. Volynskaya Z, Haka AS, Bechtel KL, Fitzmaurice M, Shenk R, Wang N, et al. Diagnosing Breast Cancer Using Diffuse Reflectance Spectroscopy and Intrinsic Fluorescence Spectroscopy. J Biomed Opt (2008) 13(2):024012. doi:10.1117/1.2909672
10. Keller A, Bialecki P, Wilhelm TJ, Vetter MK. Diffuse Reflectance Spectroscopy of Human Liver Tumor Specimens - towards a Tissue Differentiating Optical Biopsy Needle Using Light Emitting Diodes. Biomed Opt Express (2018) 9(3):1069–81. doi:10.1364/boe.9.001069
11. Evers DJ, Nachabé R, Klomp HM, van Sandick JW, Wouters MW, Lucassen GW, et al. Diffuse Reflectance Spectroscopy: a New Guidance Tool for Improvement of Biopsy Procedures in Lung Malignancies. Clin Lung Cancer (2012) 13(6):424–31. doi:10.1016/j.cllc.2012.02.001
12. Borisova E, Troyanova P, Pavlova P, Avramov L. Diagnostics of Pigmented Skin Tumors Based on Laser-Induced Autofluorescence and Diffuse Reflectance Spectroscopy. Quan Electron. (2008) 38(6):597–605. doi:10.1070/qe2008v038n06abeh013891
13. Kumar A, Chellappan K, Nasution A, Kanawade RV. Diffuse Reflectance Spectroscopy Based Blood Oxygenation Monitoring: a Prospective Study for Early Diagnosis of Diabetic Foot. Proc SPIE (2021) 11651:116510T. doi:10.1117/12.2583022
14. Anand S, Sujatha N, Narayanamurthy VB, Seshadri V, Poddar R. Diffuse Reflectance Spectroscopy for Monitoring Diabetic Foot Ulcer - A Pilot Study. Opt Lasers Eng (2014) 53:1–5. doi:10.1016/j.optlaseng.2013.07.020
15. Hile C, Veves A. Diabetic Neuropathy and Microcirculation. Curr Diab Rep (2003) 3(6):446–51. doi:10.1007/s11892-003-0006-0
16. Greenman RL, Panasyuk S, Wang X, Lyons TE, Dinh T, Longoria L, et al. Early Changes in the Skin Microcirculation and Muscle Metabolism of the Diabetic Foot. The Lancet (2005) 366(9498):1711–7. doi:10.1016/s0140-6736(05)67696-9
17. Doronin A, Meglinski I. Online Object Oriented Monte Carlo Computational Tool for the Needs of Biomedical Optics. Biomed Opt Express (2011) 2(9):2461–9. doi:10.1364/BOE.2.002461
18. Maeda T, Arakawa N, Takahashi M, Aizu Y. Monte Carlo Simulation of Spectral Reflectance Using a Multilayered Skin Tissue Model. Opt Rev (2010) 17(3):223–9. doi:10.1007/s10043-010-0040-5
20. Prahl S. Optical Absorption of Hemoglobin. Portland: Oregon Medical Laser Center News (2021). Available at: http://omlc.ogi.edu/spectra/hemoglobin/ (Accessed on: January, 2021).
21. Jacques SL, McAuliffe DJ. The Melanosome: Threshold Temperature for Explosive Vaporization and Internal Absorption Coefficient during Pulsed Laser Irradiation. Photochem Photobiol (1991) 53(6):769–75. doi:10.1111/j.1751-1097.1991.tb09891.x
22. Van Gemert MJC, Jacques SL, Sterenborg HJCM, Star WM. Skin Optics. IEEE Trans Biomed Eng (1989) 36(12):1146–54. doi:10.1109/10.42108
23. Meglinski IV, Matcher SJ. Computer Simulation of the Skin Reflectance Spectra. Comp Methods Programs Biomed (2003) 70(2):179–86. doi:10.1016/s0169-2607(02)00099-8
24. Das K, Yuasa T, Maeda T, Nishidate I, Funamizu H, Aizu Y. Simple Detection of Absorption Change in Skin Tissue Using Simulated Spectral Reflectance Database. Measurement (2021) 182:109684. doi:10.1016/j.measurement.2021.109684
25. Reif R, Amorosino MS, Calabro KW, A’Amar O, Singh SK, Bigio IJ. Analysis of Changes in Reflectance Measurements on Biological Tissues Subjected to Different Probe Pressures. J Biomed Opt (2008) 13(1):010502. doi:10.1117/1.2870115
26. Cooksey CC, Allen DW. Reflectance Measurements of Human Skin from the Ultraviolet to the Shortwave Infrared (250 Nm to 2500 Nm). SPIE ProceedingsActive and Passive Signatures IV (2013) 8734:152–60. doi:10.1117/12.2015821
Keywords: diffuse reflectance spectroscopy, monte carlo simulation, diabetic foot, hypoxic state, blood oxygen saturation, blood volume fraction
Citation: Xu G, Dong L, Yuan J, Zhao Y, Liu M, Hui M and Kong L (2022) Early Noninvasive Monitoring of Hypoxic State of Diabetic Foot Based on Diffuse Reflectance Spectroscopy. Front. Phys. 10:853813. doi: 10.3389/fphy.2022.853813
Received: 13 January 2022; Accepted: 16 March 2022;
Published: 13 April 2022.
Edited by:
Yufei Ma, Harbin Institute of Technology, ChinaReviewed by:
Xiaojun Yu, Northwestern Polytechnical University, ChinaNina Reistad, Lund University, Sweden
Copyright © 2022 Xu, Dong, Yuan, Zhao, Liu, Hui and Kong. This is an open-access article distributed under the terms of the Creative Commons Attribution License (CC BY). The use, distribution or reproduction in other forums is permitted, provided the original author(s) and the copyright owner(s) are credited and that the original publication in this journal is cited, in accordance with accepted academic practice. No use, distribution or reproduction is permitted which does not comply with these terms.
*Correspondence: Liquan Dong, a3lsaW5kQGJpdC5lZHUuY24=; Lingqin Kong, a29uZ2xpbmdxaW4zMDI1QGJpdC5lZHUuY24=
 Ge Xu
Ge Xu Liquan Dong
 Jing Yuan
 Yuejin Zhao1,2,3
 Ming Liu

