- 1Shandong Hydrological Center, Jinan, China
- 2Yantai Hydrological Center, Yantai, China
River health has become one of the major concerns today. This study develops a water quality index-based health assessment method to diagnose the status of the Dagujia River, China. The Dagujia River is the second largest river and the main source of drinking water in Yantai, China. The health status is classified into five levels – ideal, healthy, sub-healthy, unhealthy, and morbid. The assessment process includes four phases: 1) index layer grading, 2) criterion layer grading, 3) target layer grading, and 4) health diagnosis. The results show that eight sections are morbid, accounting for 66.3% of the entire assessed river. It also finds that higher water temperature variation (WTV) results in this poor health situation. However, the assessment excluding WTV reveals that all the other sections are in ideal states except for a sub-healthy river section caused by the higher concentrations of CODMn and COD in the high-flood season (June–September).
1 Introduction
The river is the water source for life, providing a living environment for humans and other living organisms, while the river is also the most vulnerable ecosystem to human activities [1, 2]. With the development of human beings, the demand for water resources continues to increase. Meanwhile, many pollutants are discharged into the rivers, causing point and non-point source pollution. Human modernization has caused damage to riparian vegetation, soil and water loss, channel changes, blockages, and interruptions. These activities have greatly affected river and lake health, which on a long term impacts physical habitats, biodiversity, ecological functions, and services [3]. For example, algal blooms have frequently occurred since the late 1980s, and around 41 kinds of fish, 65 zooplanktons, and 16 macrophyte species have disappeared from the Taihu Lake in the Yangtze River Delta in China [4]. In the world, only a small fraction of the river systems remain unaffected [5–6, 8], and river systems have become one of the most endangered global systems at an alarming rate [7–9]; . In turn, the negative river health of water pollution has greatly affected human health, which remains a major source of morbidity and mortality in countries like China [10]. The poor water quality has led to 190 million people falling ill and 60,000 people dying from liver and gastric cancers every year in China [10, 11].
Similar to a healthy human body, only a healthy river can fully perform its various functions and services. River health is a helpful term for people to interpret the river status easily and thus evoke public concern about human impacts on river systems [8, 12]. However, there has not been a universal definition of river health so far. In a pioneer study [13], the concept of river health was proposed. A healthy river should stably maintain all its intrinsic values and be able to repair itself when exposed to external stress [1]. Furthermore, it is suggested that river health assessment includes biological, physical, chemical, and socioeconomic contexts. Since the concept of river health was proposed by [13], river health assessment has become one of the major concerns for water resource protection. Maintaining and restoring the health of rivers have gradually been incorporated into the practice of river protection and management, and establishing an assessment index system has quickly become the goal and direction of river management [14].
Since the past decades, many countries in the world have assessed the health status and variation of the river system and evaluation of human impacts [8]. Consequently, different assessment methods and indices have been developed in multiple countries, such as the United Kingdom [15, 16], France [17], Zimbabwe [18], China [3, 19, 20], Swaziland [21], the United States [22], and Australia [23, 24], Flint et al., 2017, and so on. For example, in the United Kingdom, the Institute of Freshwater Ecology (IFE) developed a software package called “In Vertebrate Prediction and Classification System” (RIVPACS) for assessing the biological quality of rivers [15]. In France [17], applied logistic and multiple linear regression methods and fish-based index to assess river health were used. In Zimbabwe [18], river health related to lands based on macroinvertebrate data sampled from sites along a dry-land river in northwestern Zimbabwe was investigated. The [20] proposed an index system from five aspects, hydrology, physical forms, water quality, aquatic organisms, and social service functions, to assess river and lake health. In the United States [22], examples from Wyoming, Colorado, and Arizona in the western United States were used to quantify relations between driver and response variables on rivers affected by dams. In Australia [23], the ecosystem health of streams in Southeast Queensland was studied by using a river ecosystem health score composed of five component indicators: fish, macroinvertebrates, water quality, nutrients, and ecosystem processes.
In recent years, more studies on river health assessment have been conducted in the world. The methods applied in these studies can be roughly summarized into three categories: predictive model methods [6, 25, 26], multi-index comprehensive assessment methods [27, 28], Flint et al., 2017 [29], and mixed ones [3, 8, 26, 30]. For instance [25], multiple biological indices were developed using three groups of aquatic organisms, including benthic algae, macroinvertebrates, and fish, to assess the health of rivers in northeastern China [29]. An ecological health index method (EHI) was developed to evaluate the health status of the Poyang Lake in China from the four aspects of physical, chemical, ecological integrity, and social services [26]. The health of river ecosystems was evaluated by establishing a comprehensive river health index (RHI) determined by a fuzzy matter-element expansion evaluation model [3]. The chemical parameter model and the index of the biological integrity model were used to assess the ecological health of the Geum River watershed.
The Dagujia River is the second largest river and the main source of drinking water in Yantai, China. However, only a few studies on the health status of the river have been found in the literature, and these studies were undertaken in 2008 and just focused on the ecological aspect [31, 32]. In this connection, it is urgently needed to develop a health system index to assess the health status of the river fast. The main purpose of this study is to scientifically evaluate the health status of the Dagujia River based on water quality indicators. The main goals are to diagnose the current health status of the Dagujia River and analyze the driving forces that cause the health problems to provide technical and decision support for government departments concerned.
2 Methods
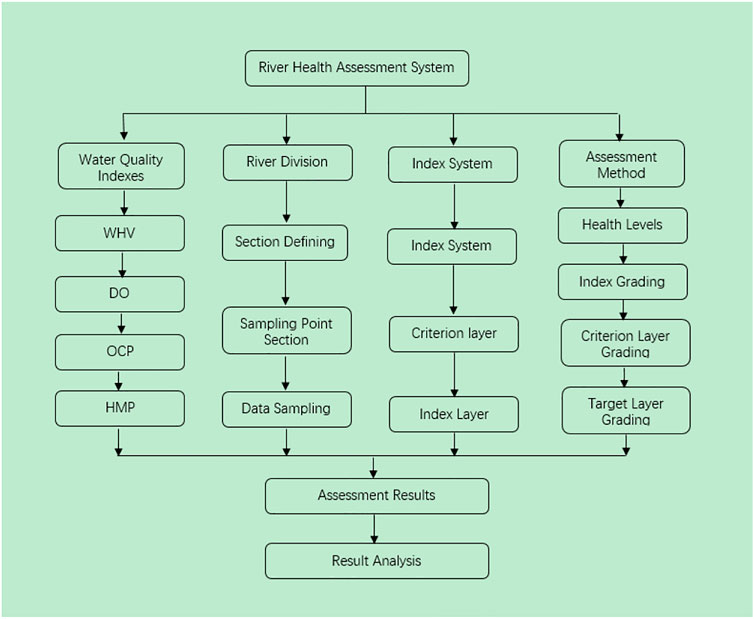
The proposed health assessment system is composed of three parts: 1) river section division, 2) system index definition, and 3) assessment method (Figure 1).
We divide the river into different sections first and then select sections for health assessment. Finally, sampling points are defined in each section. The system index includes defining the layers and indices for assessment, and the assessment method includes health level classification and grading methods for each level. Grading and health diagnosis are conducted using the Python programming language and its scientific computing libraries, Numpy and Pandas. In addition, Mapinfo 16 is used to visualize the river health assessment results spatially on the watershed GIS map.
2.1 Index System Definition
The index system includes three layers, that is, target, criterion, and indicator, and a total of 12 indices (Table 1). The target layer of the river health status is composed of four indicator layers, namely, water temperature variation (WTV), dissolved oxygen status (DO), oxygen consumption organic pollutants (OCP), and heavy metal pollutants (HMP).
WTV is the maximum absolute deviation of the monthly water temperature in the assessment year from the multi-year monthly average, reflecting the impact of river development activities on aquatic species. DO is the dissolved oxygen concentration in the water, which is essential to the growth of aquatic species. OCP refers to organic pollutants that cause a significant decrease in dissolved oxygen in water, and this study considers four indicators, including permanganate index (CODMn), chemical oxygen demand (COD), five-day biochemical oxygen demand (BOD5), and ammonia nitrogen (NH3N). HMP refers to the pollutants of heavy metal elements and their compounds with significant biological toxicity, such as mercury (Hg), cadmium (Cd), hexavalent chromium (Cr), lead (Pb), and arsenic (Ar).
2.2 Health Levels
The health status of rivers is usually divided into five levels [20, 25, 29]. Based on this previous research, this study defines the health status as ideal, healthy, sub-healthy, unhealthy, and morbid, and each health level was graded with a score ranging from 0 to 100 points. The classification standard of the five health levels is based on the total target scores (Table 2).
2.3 Grading Method
The target layer score is assigned as the minimum score of the four criterion layers, and it is expressed by
where s stands for the score, TLs is the score to target layer, subscript X ∈ [1, 2, 3, 4] stands for the four criterion layers, and CXs are the scores assigned to each of the four layers.
2.3.1 WTV Grading
Water temperature variation (WTV) is expressed by the maximum deviation of the measured monthly water temperature in the assessment year from the multi-year monthly average (Eq. 2), and the grade of WTV is determined based on its values by Eq. 3
where TV refers to WTV (°C), Tm is the measured monthly average water temperature (°C) in the assessment year, ‾Tm is the multi-year monthly average water temperature (°C), and TVs is the score obtained by WTV.
2.3.2 Grading of DO Index
The DO status index grade is defined as the minimum of the scores assigned to the DO concentration in the flood season and the non-flood season by the following equation
where DOs is the score of DO index, DOFs is the score of DO index in the flood season, DONs is the score of DO index in the non-flood season, and subscripts F and N represent the flood season and non-flood season, respectively.
Too high and too low DO concentrations can both cause harm to aquatic organisms. The appropriate DO concentration value is 4–12 mg/L based on [20, 33], and the DO concentration of 5 mg/L is defined as the base point because it meets the basic water quality requirements of fish organisms [33]. The scores of DO index in the flood season and the non-flood season are defined according to its concentrations of these two seasons by the following equation
where DOF is the average DO concentration in the flood season in the assessment year and DON is the average DO concentration in the non-flood season in the assessment year.
In this study, we define the DO concentration in the flood season (DOF) as the monthly average concentration from May to September in the assessment year (Eq. 6) and the DO concentration in the non-flood season (DON) as the monthly average concentration from January to April and from October to December in the assessment year (Eq. 7)
where DOi is the DO concentration in the ith month of the flood season; DOj is the DO concentration in the jth month of the non-flood season; subscripts i and j represent a certain month in the flood season and non-flood season, respectively; and m and n represent the total months of the flood season and non-flood season, respectively.
2.3.3 Oxygen Consumption Organic Pollutants
The oxygen consumption organic pollutant score is assigned by the average score of its four indices, that is, CODMn, COD, BOD5, and NH3H (Eq. 8). The score of each index is defined as the minimum one of the two scores assigned for this index in the flood season and non-flood season, expressed by Eq. 9
where OCPs is the score of the oxygen consumption organic pollutants (OCP); OCPks are the scores to the four indices; OCPkFs and OCPkNs refer to the score to each of the four indices in the flood season and non-flood season, respectively; and subscript k stands for each of the four indices.
The scores to each of the four indices in the flood and non-flood seasons are assigned based on their concentrations in these two seasons (Eqs 10–13)
where CODMns, CODs, BODs, and NH3Ns are the scores to the four indices, CODMn, COD, BOD, and NH3N, respectively; CODMn, COD, BOD, and NH3N are the concentrations of these four indices, respectively; and subscripts F and N represent the flood season and non-flood season, respectively.
The concentrations of each index are defined as the monthly average concentrations of this index in the flood season and non-flood season, respectively (14–15). In this study, the flood season refers to May to September in the assessment year. The non-flood season refers to January to April and from October to December in the assessment year
where OCPkF and OCPkN refer to the concentrations of one of the four indices, CODMn, COD, BOD, and NH3N, in the flood season and non-flood season, respectively; subscripts i and j represent a certain month in the flood season and non-flood season, respectively; and m and n represent the total months of the flood season and non-flood season, respectively.
2.3.4 Grading of Heavy Metal Pollutants
Heavy metal pollutant score (HMPs) is defined by the minimum score of its five indices, arsenic (Ar), mercury (Hg), cadmium (Cd), chromium(Cr), and lead (Pb) (Eq. 16). Each of the five indices is graded by the minimum one of its scores in the flood and non-flood seasons. The concentrations of each index in these two seasons are determined by Eqs 23 and 24
where HMPs is the score assigned to HMP; OCPkF and OCPkN refer to the concentrations of the five indices in the flood season and non-flood season, respectively; subscript k is each of the four indices; i and j represent a certain month in the flood season and non-flood season, respectively; and m and n represent the total months of the flood season and non-flood season, respectively.
3 Study Area and Data
3.1 Area Description
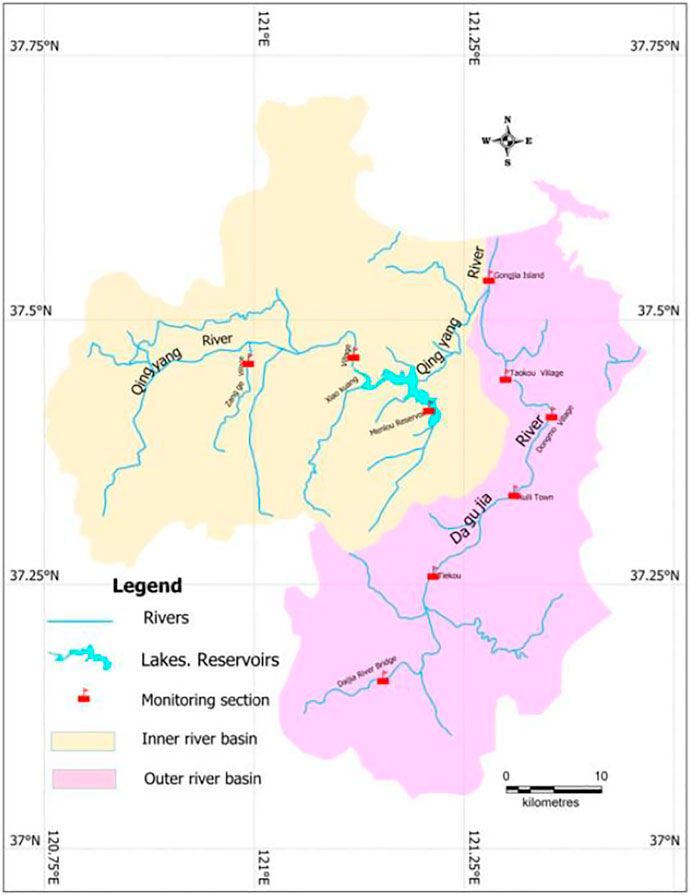
The Dagujia River watershed is located in the north-central part of Yantai City in the Shandong Peninsula (Figure 2). It originates from Haiyang City and flows through Muping District, Qixia City, Fushan District, Laishan District, and Zhiyu District. It is the second largest river in Yantai City, China, with a length of 83 km and a basin area of 2,293 km2.
The Dagujia River watershed is the continental climate in the warm temperate East-Asian monsoon region, accompanied by obvious maritime climate characteristics and four distinct seasons. It has an annual average rainfall of 683.9 mm, a frost-free period of 222 days, an average temperature of 11.5°C, and a wind speed of 4.5 m/s. The precipitation distribution is extremely uneven spatially and temporally in the watershed, and precipitation in the flood season (May to September) accounts for more than 70% of the annual total.
The local people honored the Dagujia River as the “Mother River”. It is the most important source of drinking water in Yantai City, raising 27 towns with 600 thousand people. Along the river is the import-producing place of the famous “Yantai Apple” and “Yantai Big Cherry”.
3.2 River Section Division
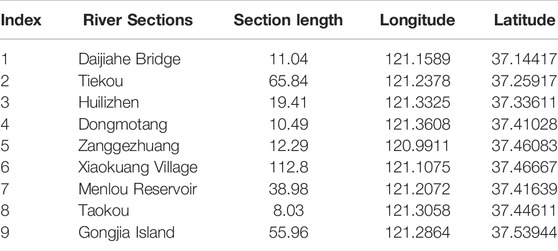
Based on the existing monitoring sections of the Dagujia River in the Yantai Hydrological Bureau, China, we divide the river into nine sections for health assessment, namely, the Menlou Reservoir, Taokou, Dongmotang, Huili Town, Tiekou, Daijiahe Bridge, Zanggezhuang, Xiaokuang Village, and Gongjia Island. The river sections assessed are 334.838 km long, and the geographical location and length of each river section are displayed in Table 3.
3.3 Data Sampling and Collection
This study conducted monthly field sampling of the indices of the nine river sections throughout the whole 2018 assessment year. We collected the index samples from 7:00 a.m. to 12:00 a.m. on 1 day randomly selected in each month. Besides the sampling data, local monthly temperature data in 2018 were collected from [19] and the multi-year monthly average temperature data were collected from [34].
4 Result Analysis and Discussion
The health levels of the nine selected river sections of the Dagujia River were assessed based on the developed health assessment index system and the monthly sampling data.
4.1 Water Temperature Variation
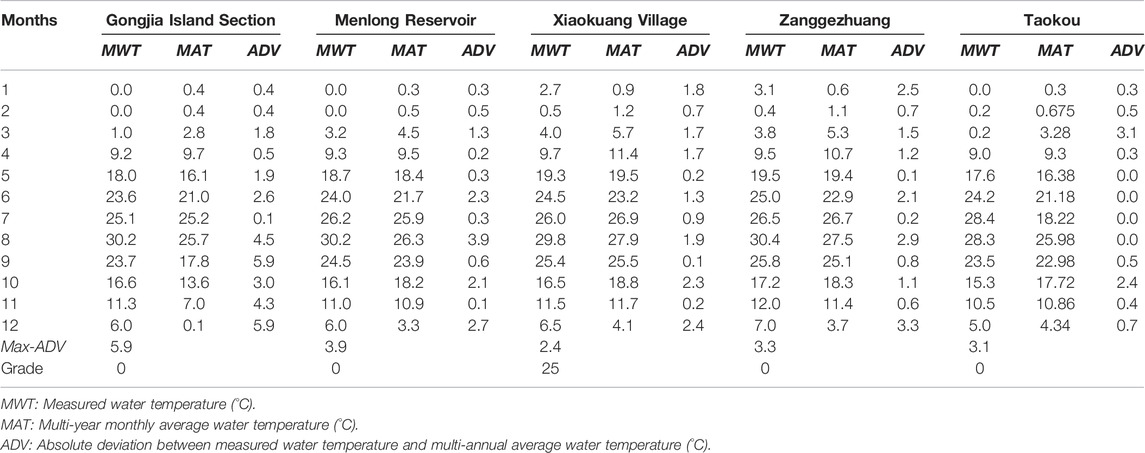
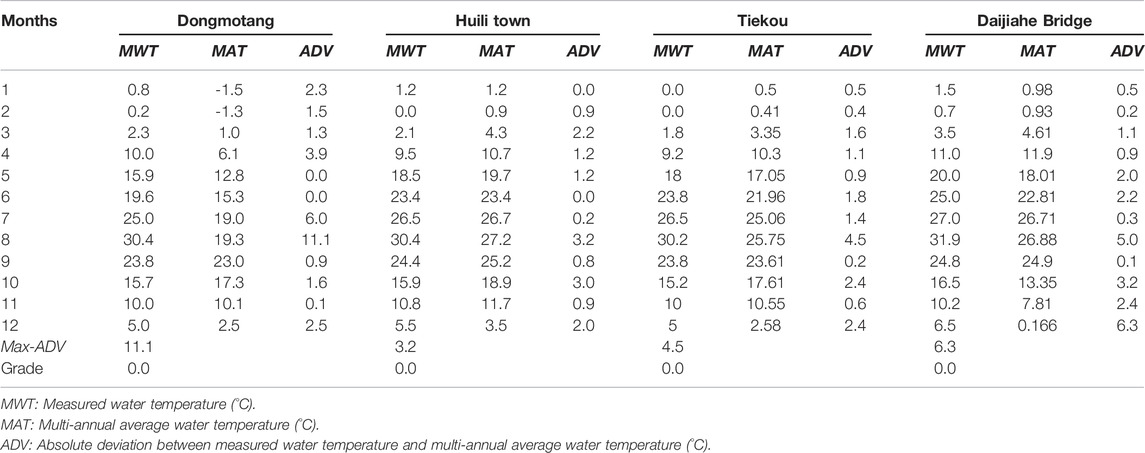
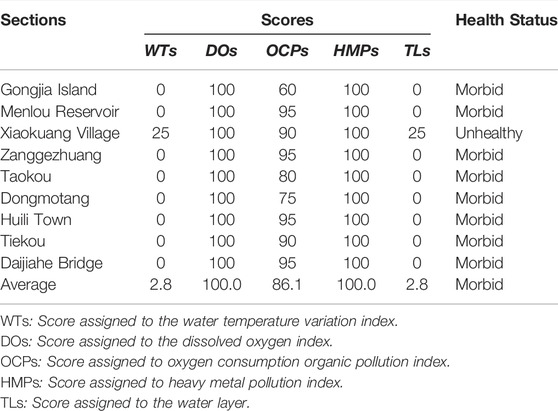
The analysis results of sampling data show that the water temperature of the nine sections displays a similar trend of polynomial order three lines with the maximum temperature in August and the minimum in January and February, and the Daijiahe Bridge section has the highest temperature among the nine sections (Figure 3A). The results of the water temperature variation (WTV) reveal that the Xiaokuang Village section has a relatively lower WTV, say 2.4°C. In contrast, the Dongmotang section has the largest WTV, say 11.1°C. The Daijiahe Bridge section, Gongjia Island section, and Tiekou section are followed, with WTVs of 6.3°C, 5.9, and 4.5°C, respectively (Figure 3B; Table 4 and 5). In addition, the WTV of the rest four sections is between 3 and 4°C (Figure 3).

FIGURE 3. Water temperature and water temperature variation of the Dangujia River in the 2008 assessment year: (A) monthly water temperature and (B) monthly water temperature variation.
Based on the WTV grading method, the Xiaokuang Village obtains 25 points, and all the other eight sections have 0 points due to the higher WTV (Table 4 and 5). These analysis results indicate that human development activities have greatly influenced the river’s water temperature.
A higher WTV will impact the living environment of local fishes in the river, which further influences the fish behaviors of feeding, reproduction, and migrations [35]. Consequently, the body efficiency of many physiological processes will change from 6 to 10% when the body temperature of fish changes by 1°C [36], and the pregnancy period of a pregnant female fish will decrease by 2 weeks for every 1°C increase in temperature in a relatively stable environment [37].
4.2 DO Water Quality
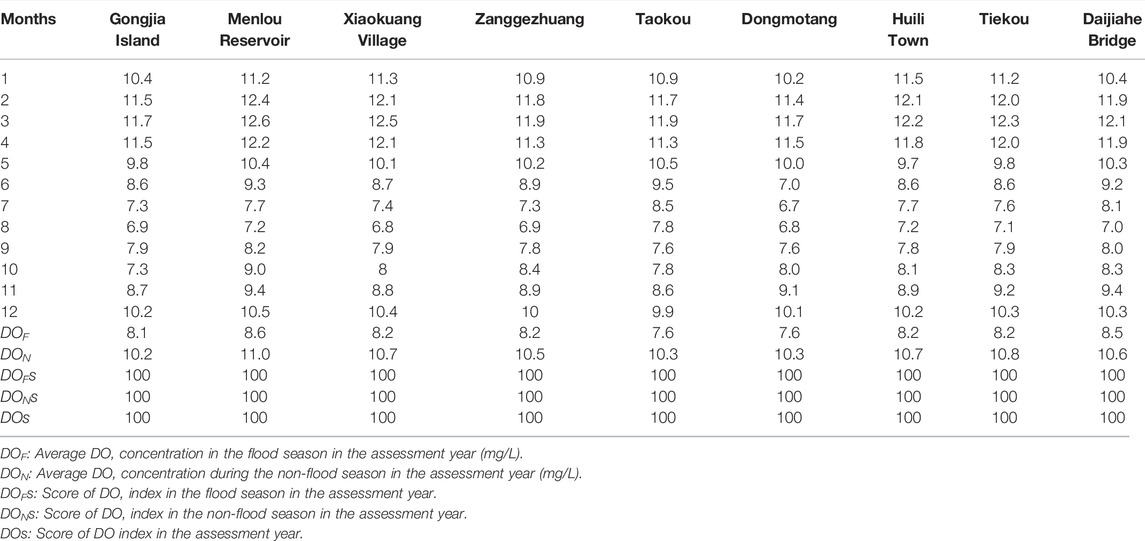
The analysis results show that the change behaviors of DO concentrations in the assessed nine river sections have a general pattern. DO shows an increasing trend from January to March and then decreases until August, followed by another increase (Figure 4A). The results also reveal that the average concentration of DO in each section in the flood season is much lower than that in the non-flood season (Figure 4B and Table 6). This is mainly because of the following two reasons: (1) an increase in water flow during the flood season would dilute the DO content and (2) a large amount of oxygen-consuming organic matter pollutants entered into the river with precipitation and flow during the flood season, which consumed much more DO. Figure 4B also illustrates that the Menlou Reservoir section has the highest DO concentration compared with other sections in the two seasons, while the Dongmotang section and the Taokou section have the lowest concentrations (Figure 4B and Table 6).

FIGURE 4. DO concentrations in the Dangujia River in the 2008 assessment year: (A) monthly DO concentrations and (B) DO concentrations in the flood and non-flood seasons.
The average concentrations of DO in the flood and non-flood seasons in the nine river sections are between 7.5 and 12 mg/L (Figure 4B), which confirms that the nine river sections are all assigned to 100 points according to the grading equation of DO index (Figure 4B). This result indicates that the DO status in the Dagujia River is excellent in the 2018 assessment year, which is very suitable for the growing needs of aquatic species.
4.3 Oxygen Consumption Organic Pollutants
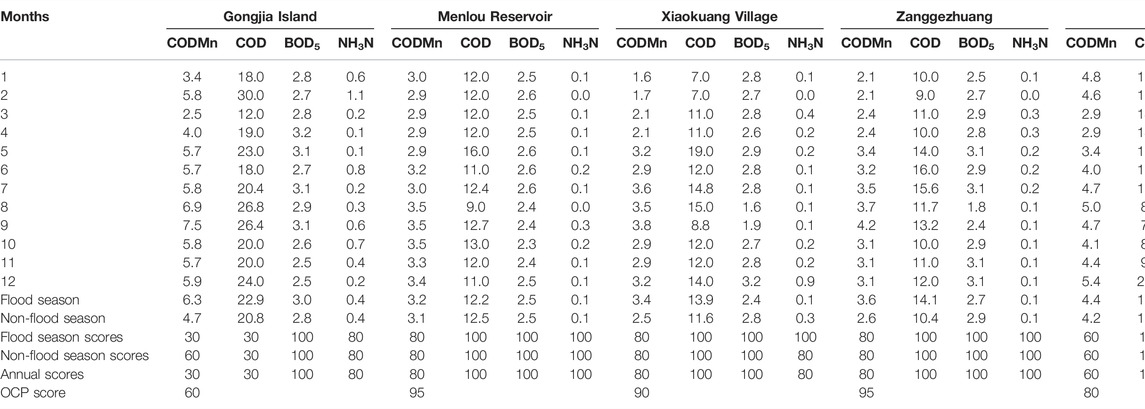
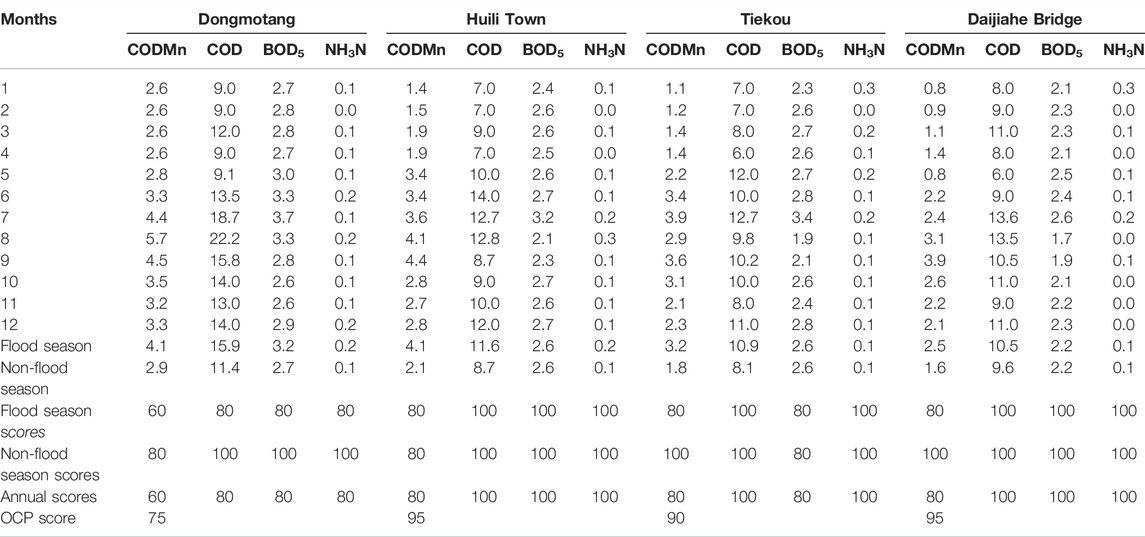
The analysis and grading results of the oxygen consumption organic pollutants (OCP) of the nine sections in the Dagujia River in the assessment year are displayed in Figures 5, 6 and Tables 7 and 8.
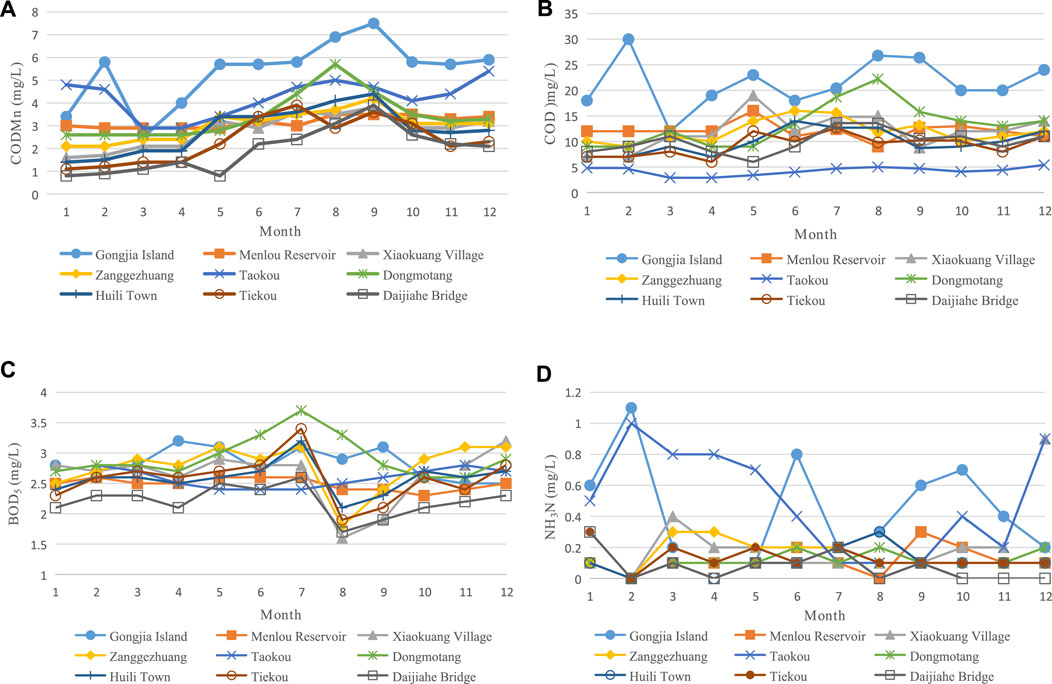
FIGURE 5. Organic oxygen consumption pollutants (OCP) in the Dangujia River in the 2008 assessment year: (A) CODMn concentration, (B) COD concentration, (C) BOD5 concentrations, and (D) NH3N concentration.
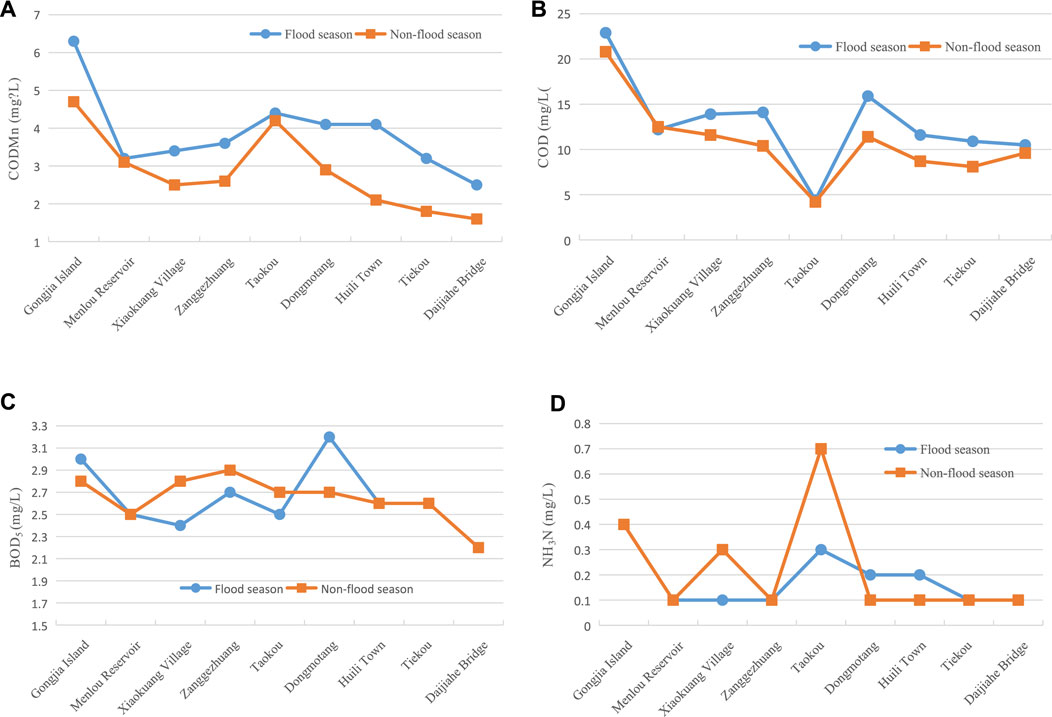
FIGURE 6. Monthly organic oxygen consumption pollutants (OCP) in the Dangujia River in the flood and non-flood seasons in the 2008 assessment year: (A) CODMn concentrations, (B) COD concentrations, (C) BOD5 concentration, and (D) NH3N concentration.
The results display that the Gongjia Island section has higher CODMn, COD, BOD5, and NH3N in the nine sections. This is also illustrated obliviously in terms of the average concentrations of the food season and non-flood season (Figure 6).
The results further reveal that the Daijiahe Bridge has lower CODMn, BOD5, and NH3N (Figures 5A,C,D), and the Taokou section has the lowest COD (Figure 5B), although it seemly has the second highest CODMn and NH3N (Figures 5A,D). It also finds that the Dongmotang section has the highest BOD5 in July, August, and September (Figure 5C) and the second highest CODMn, COD, and NH3N during the same period (Figures 5A,B,D).
Besides, the analysis results show that the average CODMn and COD concentrations of the nine sections are higher in the flood season than in the non-flood season (Figures 6A,B). In contrast, the BOD5 and NH3N concentrations are opposite, except for a few river sections like Gonjia Island, Tongmotang, and Huili Town (Figures 6C,D). It suggests that CODMn and COD enter the water body of the river mainly through the high flow during the flood season, while BOD5 and NH3N are higher in the non-flood season mainly because of lower flow and higher mainly in the flood season due to flow dilution.
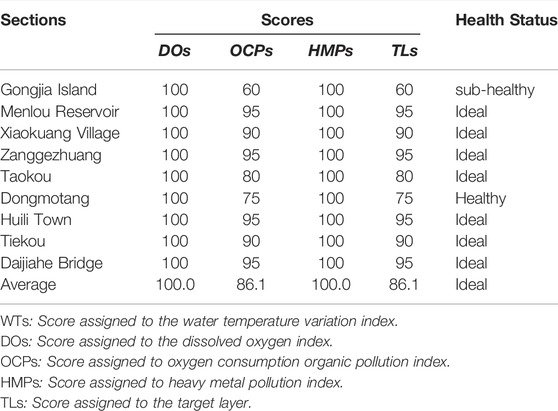
The OCP grading results of the nine river sections show that Gongjia Island is assigned the lowest score of 60 points due to the lower score of CODMn (30 points) in the flood season and the lower score of COD (30 points) in both seasons (Table 7). Dongmotang obtains a score of 75 points due to the lower scores of CODMn (60 points) in the flood season (Table 8). The scores of OCPs in the other seven river sections are all above 80 points (Tables 7 and 8).
4.4 Heavy Metal Pollutants
The monthly heavy metal pollutant (HMP) data sampling results show that the concentrations of the five indices, that is, arsenic, mercury, cadmium, chromium, and lead, are all zero in the nine river sections in the assessment year. Therefore, the scores of HMP in the nine river sections are all assigned to 100 points.
4.5 Health Assessment
Table 9 displays the grading results of the four-index layer and health assessment results of the target layer. The health assessment results show that the nine sections of the Dagujia River in the assessment year are very bad. The Xiaokuang Village section is unhealthy, and the rest eight sections are all in morbidity. The average score of the nine sections is only 2.8 points, which indicates that the Dagujia River in the 2018 assessment year is in the morbid status (Table 9). The spatial analysis results of the health assessment display that the unhealthy river section is 112.8 km long, accounting for 33.7% of the total assessed river section length, and the morbid section is 222.038 km long, accounting for 66.3% of the total assessed river section (Figure 7A).
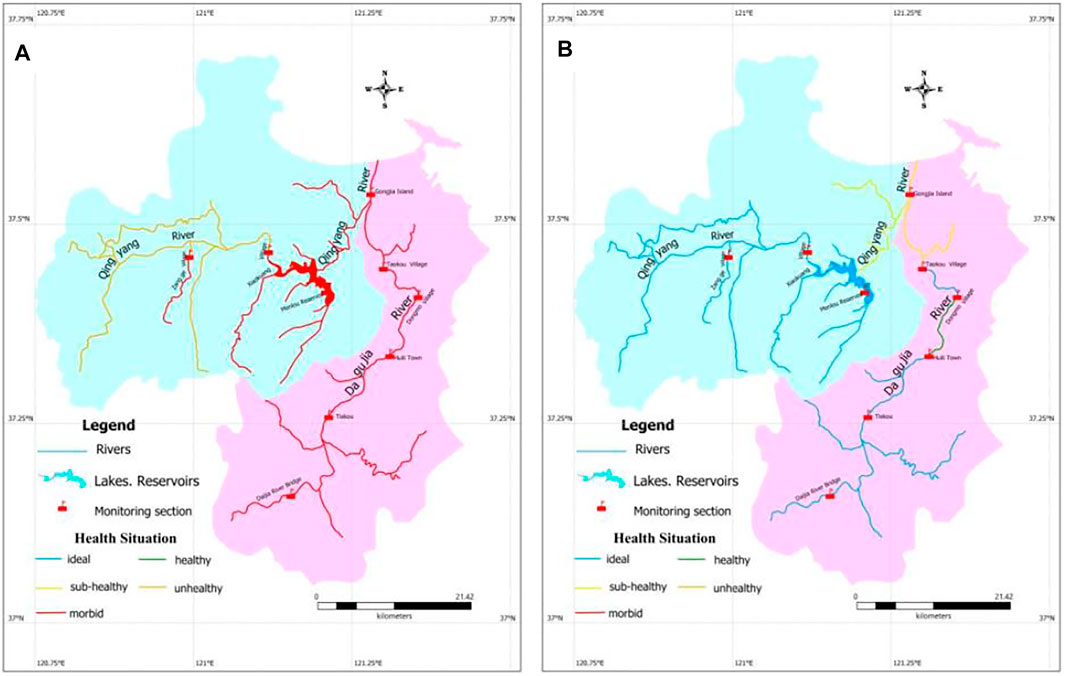
FIGURE 7. Health assessment results of the Dagujia River: (A) results including water temperature variation and (B) results excluding heavy metal pollutants.
The results excluding WTV, however, are quite different. The Gongjia section is in a sub-health state, the Dongmotang section is healthy, and the other seven river sections are all under ideal conditions. The sub-health status of the Gongjia section is mainly caused by the lower score of OCP (60 points) in the flood season (Table 10) due to the higher concentrations of CODMn and COD (Table 7). The complete target layer grading results show that the average score of the nine sections is 85.3, confirming that the Dagujia River is under ideal health conditions (Table 10). The spatial analysis result of the health assessment reveals the heath of the river. The 268.39 km river section is in an ideal state of health, the 10.49 km river section is in a healthy state, and the 55.96 km river section is in a sub-healthy state, which respectively accounted for 80.2, 3.1, and 16.7% of the total assessed river length (Figure 7B).
This assessment suggests that higher changes in water temperature variation (WTV) are the main factor resulting in the lower score and the poor health condition of the river (Table 9). The higher WTV could result from human development activities as assumed in this study. Meanwhile, the extreme temperatures are probably also the driving factor leading to the higher WTV in the assessment year, which causes the higher deviation of monthly water temperature from the monthly average of multiple years. In order to check if it is the influence of climate change, a comparison analysis is made based on the local monthly average temperature data in 2018 [9] and the multiple-year monthly average data from 1970 to 2000 [34]. The analysis result illustrates that the average monthly temperatures in the assessment year are close to the multi-year monthly average values (Figure 8A) with the maximum deviation of 1.9 °C and the minimum deviation of −1.1°C (Figure 8B). This comparison result indicates that the local temperature is not the driving factor leading to the higher WTV.

FIGURE 8. Monthly temperature in Yantai City, China: (A) comparison between the average in 2018 and the average of multi-year series (1971–2000) and (B) comparison deviation.
5 Conclusion
This study develops a river health assessment system based on water quality indices, and this system is applied to assess the health situations of the Dagujia River in China in 2018.
The main findings of the study are as follows: 1) the DO index of all assessed river sections in the flood season and the non-flood season are between 7.5 and 12 mg/L, which is very suitable for the growth needs of aquatic species, and hence, the DO index obtained a full score of 100; 2) the heavy metal pollutant indices of the nine assessed sections in the flood and non-flood seasons are both zero, and thus, they are also assigned full marks; (3) The CODMn and COD in the Gongjia Island section and Dongmotang section in the flood season are higher, making the scores of oxygen consumption organic pollutant index (OCP) in these two sections lower, 53 points and 70 points, respectively; (4) the water temperature variation (WTV) index of the assessed river sections is high, which resulted in the poor health status of the nine assessed river sections, where one section is in an unhealthy state and the other eight river sections are all in morbidity, and the morbid river sections accounted for 66.3% of the total assessed river sections; and (5) without considering the index of WTV, only one section is in a sub-health state, accounting for an assessment of 16.7% of the total length of the assessed river sections, and other river sections are all in the healthy and ideal states.
Therefore, the higher WTV plays a vital role in the health assessment results of the Dagujia River. The analysis results also confirm that the local monthly temperatures in the assessment year are not deviated from their multi-year average, suggesting that climate change is not the driving force of the higher WTV in the study area. In addition, CODMn and COD in certain river sections in the flood season are relatively higher, playing an important role in some sections’ sub-health status. In this sense, WTV, CODMn, and COD should draw the management department concerned for planning and managing the Dagujia River.
Data Availability Statement
The original contributions presented in the study are included in the article/Supplementary Material, further inquiries can be directed to the corresponding author.
Author Contributions
Conception and design of this study were mainly contributed by XY and YS. Numerical simulations were mainly contributed by LJ and CF. Drafting the manuscript was mainly contributed by YX and ZY.
Funding
The Scientific Bureau of Yantai, China, supported this work under the Science and Technology Plan Project “R and D of the River and Lake Health Intelligent Assessment and Early Warning System and Its Demonstration and Application in the Dagujia River” (2017SF085) and “Real-time Monitoring and Simulation and Early Warning Platform for Water Quality Based on Artificial Intelligence” (2019YT06130885).
Conflict of Interest
The authors declare that the research was conducted in the absence of any commercial or financial relationships that could be construed as a potential conflict of interest.
Publisher’s Note
All claims expressed in this article are solely those of the authors and do not necessarily represent those of their affiliated organizations or those of the publisher, the editors, and the reviewers. Any product that may be evaluated in this article or claim that may be made by its manufacturer is not guaranteed or endorsed by the publisher.
References
1. Karr JR. Biological Integrity: A Long-Neglected Aspect of Water Resource Management. Ecol Appl (1991) 1(1):66–84. doi:10.2307/1941848
2. Karr JR. Defining and Measuring River Health. Freshw Biol (1999) 2(41):221–34. doi:10.1046/j.1365-2427.1999.00427.x
3. Hara J, Mamun M, An K-G. Ecological River Health Assessments Using Chemical Parameter Model and the Index of Biological Integrity Model. Water (2019) 11(8):1729. doi:10.3390/w11081729
4. Guan B, An S, Gu B. Assessment of Ecosystem Health during the Past 40 Years for Lake Taihu in the Yangtze River Delta, China. Limnology (2011) 12(1):47–53. doi:10.1007/s10201-010-0320-6
5. Dos Santos DA, Molineri C, Reynaga MC, Basualdo C. Which index Is the Best to Assess Stream Health? Ecol Indicators (2011) 11(2):582–9. doi:10.1016/j.ecolind.2010.08.004
6. Woznicki SA, Nejadhashemi AP, Ross DM, Zhang Z, Wang L, Esfahanian A-H. Ecohydrological Model Parameter Selection for Stream Health Evaluation. Sci Total Environ (2015) 511:341–53. doi:10.1016/j.scitotenv.2014.12.066
7. Flint AE, Waterman M, Bowmer G, Vadlamani G, Chumas P, Morrall MCHJ. Neuropsychological Outcomes Following Paediatric Temporal Lobe Surgery For Epilepsies: Evidence From a Systematic Review. Seizure (2017) 2017(52):89–116. doi:10.3390/app9194163
8. Chen Y, Xia J, Cai W, Sun Z, Dou C. Three-Phase-Based Approach to Develop a River Health Prediction and Early Warning System to Guide River Management. Appl Sci (2019) 9(19):4163. doi:10.3390/app9194163
9.Shandong Bureau of Statistics.. Shandong Statistical Yearbook 2019 Report.. Beijing, China: China Statistical Yearbook Press (2019).
10. Wang Q, Yang Z. Industrial Water Pollution, Water Environment Treatment, and Health Risks in China. Environ Pollut (2016) 218:358–65. doi:10.1016/j.envpol.2016.07.011
11. Tao T, Xin K. Public Health: A Sustainable Plan for China's Drinking Water. Nature (2014) 511(7511):527–8. doi:10.1038/511527a
12. Boulton AJ. An Overview of River Health Assessment: Philosophies, Practice, Problems and Prognosis. Freshw Biol (1999) 41(2):469–79. doi:10.1046/j.1365-2427.1999.00443.x
13. Karr JR, Fausch KD, Angermeier PL, Yant PR. Assessing Biological Integrity in Running Waters: A Method and its Rationale. Champaign Illinois: Illinois Natural History Survey Special Publication (1986). p. 1–28.5.
14. Feng Y, He D, Yang L. Selection of Major Evaluation Indicators on River Health Evaluation. Geographical Res (2012) 31(03):389–98.
15. Wright JF. Development and Use of a System for Predicting the Macroinvertebrate Fauna in Flowing Waters. Austral Ecol (1995) 20(1):181–97. doi:10.1111/j.1442-9993.1995.tb00531.x
16. Neal C. Surface and Groundwater Quality and Health, with a Focus on the United Kingdom. Geology Health closing gap (2003) 87:94. doi:10.1093/oso/9780195162042.003.0021
17. Oberdorff T, Pont D, Hugueny B, Porcher J-P. Development and Validation of a Fish-Based index for the Assessment of 'river Health' in France. Freshw Biol (2002) 47(9):1720–34. doi:10.1046/j.1365-2427.2002.00884.x
18. Chakona A, Phiri C, Chinamaringa T, Muller N. Changes in Biota along a Dry-Land River in Northwestern Zimbabwe: Declines and Improvements in River Health Related to Land Use. Aquat Ecol (2009) 43(4):1095–106. doi:10.1007/s10452-008-9222-7
19. Meng W, Zhang N, Zhang Y, Zheng B. Integrated Assessment of River Health Based on Water Quality, Aquatic Life and Physical Habitat. J Environ Sci (China) (2009) 21(8):1017–27. doi:10.1016/s1001-0742(08)62377-3
20.China Ministry of Water Resources. National River Health Assessment Indicators, Standards and Methods (Office Resources [2010] No. 484). Beijing: General Office of the Ministry of Water Resources (2010).
21. Magagula CN, Mansuetus AB, Tetteh JO. Ecological Health of the Usuthu and Mbuluzi Rivers in Swaziland Based Onselected Biological Indicators. Afr J Aquat Sci (2010) 35(3):283–9. doi:10.2989/16085914.2010.545505
22. Ellen W. Identifying and Mitigating Dam-Induced Declines in River Health: Three Case Studies from the Western United States. Int J Sediment Res (2012) 27(3):271–87.
23. Sheldon F, Peterson EE, Boone EL, Sippel S, Bunn SE, Harch BD. Identifying the Spatial Scale of Land Use that Most Strongly Influences Overall River Ecosystem Health Score. Ecol Appl (2012) 22(8):2188–203. doi:10.1890/11-1792.1
24. Pinto U, Maheshwari BL, Ollerton RL. Analysis of Long-Term Water Quality for Effective River Health Monitoring in Peri-Urban Landscapes-A Case Study of the Hawkesbury-Nepean River System in NSW, Australia. Environ Monit Assess (2013) 185(6):4551–69. doi:10.1007/s10661-012-2888-2
25. Qu X, Zhang H, Zhang M, Liu M, Yu Y, Xie Y, et al. Application of Multiple Biological Indices for River Health Assessment in Northeastern China. Ann Limnol - Int J Lim (2016) 52:75–89. doi:10.1051/limn/2016005
26. Xu W, Dong Z, Hao Z, Li D, Ren L. River Health Evaluation Based on the Fuzzy Matter-Element Extension Assessment Model. Pol J Environ Stud (2017) 26(3):1353–61. doi:10.15244/pjoes/67369
27. Song J, Cheng D, Li Q, He X, Long Y, Zhang B. An Evaluation of River Health for the Weihe River in Shaanxi Province, China. Adv Meteorology (2015) 2015:1–13. doi:10.1155/2015/476020
28. Yadav NS, Sharma MP, Kumar A. Assessment of Ecological Health of Chambal River Using Plant Species Diversity. J Mat Environ Sci (2015) 6(9):2624–30.
29. Qi L, Huang J, Huang Q, Gao J, Wang S, Guo Y. Assessing Aquatic Ecological Health for Lake Poyang, China: Part I Index Development. Water (2018) 10(7):943. doi:10.3390/w10070943
30. Kim J, An K-G. Integrated Ecological River Health Assessments, Based on Water Chemistry, Physical Habitat Quality and Biological Integrity. Water (2015) 7(11):6378–403. doi:10.3390/w7116378
31. Luo X, Zhang X, Guo X, Li H, Han Y, Wu G. Ecological Health Bioassessment Based on Benthic Macroinvertebrate in Dagujia River. Res Environ Sci (2008) 21(4):88–93.
32. Luo X, Li H, Zhang X, Guo X, Han Y, Wu G. Identification of Eco-Healthy Stressor for the Qingyang Reach of Dagujia River. Acta Ecologica Sinica (2008) 28(11):5766–74.
33.China State Environmental Protection Administration. Environmental Quality Standards for Surface water(GB3838-2002). Beijing: China State Environmental Protection Administration (2002).
34.China Meteorology Web. Analysis of Yantai Climate Background. Beijing, China: CMA Public Meteorological Service Center (2020). Available from: http://www.weather.com.cn/cityintro/101120501.shtml January 1, 2020.
35. Lu W, Yuan M. The Literature Review of Temperature Change Effect on Fish Behavior. J Shanghai Ocean Univ (2017) 26(6):828–35. doi:10.12024/jsou.20150501459
36. Johnston IA, Bennett AF. Animals and Temperature: Phenotypic and Evolutionary Adaptation. Cambridge, United Kingdom: Cambridge University Press (2008).
Keywords: health assessment, water quality index, health levels, grading method, water temperature variation
Citation: Yi X, Shi Y, Jiang L, Fu C, Xing Y and Yu Z (2022) River Health Assessment Method Based on Water Quality Indices for the Dagujia River in China. Front. Phys. 10:852538. doi: 10.3389/fphy.2022.852538
Received: 11 January 2022; Accepted: 10 March 2022;
Published: 21 April 2022.
Edited by:
Qingxiang Meng, Hohai University, ChinaReviewed by:
Yuan Li, Hohai University, ChinaQiang Zhang, China Institute of Water Resources and Hydropower Research, China
Copyright © 2022 Yi, Shi, Jiang, Fu, Xing and Yu. This is an open-access article distributed under the terms of the Creative Commons Attribution License (CC BY). The use, distribution or reproduction in other forums is permitted, provided the original author(s) and the copyright owner(s) are credited and that the original publication in this journal is cited, in accordance with accepted academic practice. No use, distribution or reproduction is permitted which does not comply with these terms.
*Correspondence: Long Jiang, TEppYW5nMjAyMkB5ZWFoLm5ldA==
 Xuejun Yi1
 Long Jiang