 Fu Yang
 Dongmin Ma1,3
- 1Key Lab of Coal Resources Exploration and Comprehensive Utilization Ministry of Nature Resources, Xi’an, China
- 2Shaanxi Coal Geology Group Co., Ltd., Xi’an, China
- 3School of Geology and Environment, Xi’an University of Science and Technology, Xi’an, China
- 4Shaanxi Key Laboratory of Advanced Stimulation Technology for Oil and Gas Reservoirs, Xi’an Shiyou University, X’ian, China
Continental shale is investigated for potential shale gas reservoirs in the Tongchuan area, southern Ordos Basin. The kerogen macerals of Upper Triassic Chang 7 Shale are vitrinite 28–43%, exinite 4–7%, and inertinite 52–69%, and Ro is 0.85–0.88%, and the kerogen type is II. The total organic carbon (TOC) content is 9.75–29.92%, free hydrocarbon (S1) is 3.21–12.14%, pyrolysis hydrocarbon (S2) is 41.86–165.39%, and maximum pyrolysis temperature (Tmax) is 439–445°C. The mineral composition is mainly dominated by quartz 3.94–43.27%, followed by feldspar 9.65–30.07% and clay minerals 13.46–59%. Illonite/smectite (I/S) is the main clay mineral, accounting for 47–69%. The liquid nitrogen adsorption curve showed that the pore types were tubular and plate-like. The pores are mainly microporous (<2 nm) and mesoporous (2–50 nm) in size. Isothermal adsorption results show that Langmuir volume (VL) is 2.06–5.57 cm3 g−1, Langmuir pressure (PL) is 2.16–3.28 MPa, and shale adsorption capacity is small and easy to desorb. A quartz content less than 25% is negatively correlated with the specific surface area (SSA); otherwise, it is positively correlated. A clay mineral content less than 45% is negatively correlated with SSA; otherwise, it is positively correlated. The relationship between the carbonate content and pore structure is not obvious. Pyrite content less than 2% is positively correlated with SSA; otherwise, it is negatively correlated. The SSA is positively correlated with TOC, inertinite, and exinite and negatively correlated with vitrinite. The adsorbed gas content is positively correlated with the TOC content, SSA, inertinite content, and exinite content and negatively correlated with vitrinite.
Introduction
Shale gas is a clean energy source and is an important unconventional oil and gas resource. It has attracted attention in the field of oil and gas exploration and development and has become one of the hot spots of oil and gas exploration. Shale is not only a source rock but also an in situ-rich reservoir after the generation of natural gas. Shale gas is dominated by adsorbed gas, which accounts for approximately 20–85% of the shale gas content [1]. Shale gas accumulation factors include the thickness of shale, the content of organic matter, mineral content and composition, thermal maturity, reservoir properties, and preservation conditions [2]. China’s continental shale gas exploration started in the Yanchang petroleum exploration area of the Ordos Basin. [3] studied the gas content of continental shale in the Yanchang Formation and its correlation with organic carbon content, vitrinite reflectance, clay mineral content, and microscopic pore structure, taking Liuping-171 well in the Ordos Basin as an example. [4] studied the microporous structural characteristics and influencing factors of terrestrial shale in the Ordos Basin and compared them with marine shale. [5] analyzed the pore structure of silty laminae and shale in terrestrial shale of the Ordos Basin by using the mercury injection method, nitrogen adsorption, carbon dioxide adsorption, and other experimental means. The study of continental shale gas in the Ordos Basin is still in a primary stage. The study of microscopic pore structure and influencing factors of terrestrial shale is of great significance to the development of abundant shale gas resources in the Ordos Basin.
Based on the observations of outcrop lithology, shale samples were collected for rock pyrolysis, liquid nitrogen adsorption, carbon dioxide adsorption, and X-ray diffraction analysis. The microscopic pore structure and controlling factors of shale were examined, and the controlling factors of shale adsorption gas content were discussed, which laid a foundation for the exploration and development of continental shale gas.
Samples and Experiments
Geological Setting and Samples
According to the present structural morphology, basement rock properties, and basin evolutionary history, the Ordos Basin is divided into six first-order structural units: the Yimeng uplift, Yishan slope, Weibei uplift, western edge thrust belt, Tianhuan depression, and Jinxi folding belt. The Chang 7 period was the heyday of lacustrine development in the Ordos Basin, and the oil shale was mainly distributed in the southern part of the basin, with a single layer thickness of 10–40 m [6]. In this study, six samples (X-1∼X-6) were collected from the Yanchang Formation, the X1 well-drilling core, Tongchuan area. Sample location: N: 35°18′ 21″, E: 108°40′ 20″. In this study, one sample (B-7) was collected from the Yanchang Formation, the Bawangzhuang outcrop, Tongchuan area. Sample location: N: 35°14 ′01.7 ″, E: 109°02′ 10.5″ (Figure 1 and Table 1).
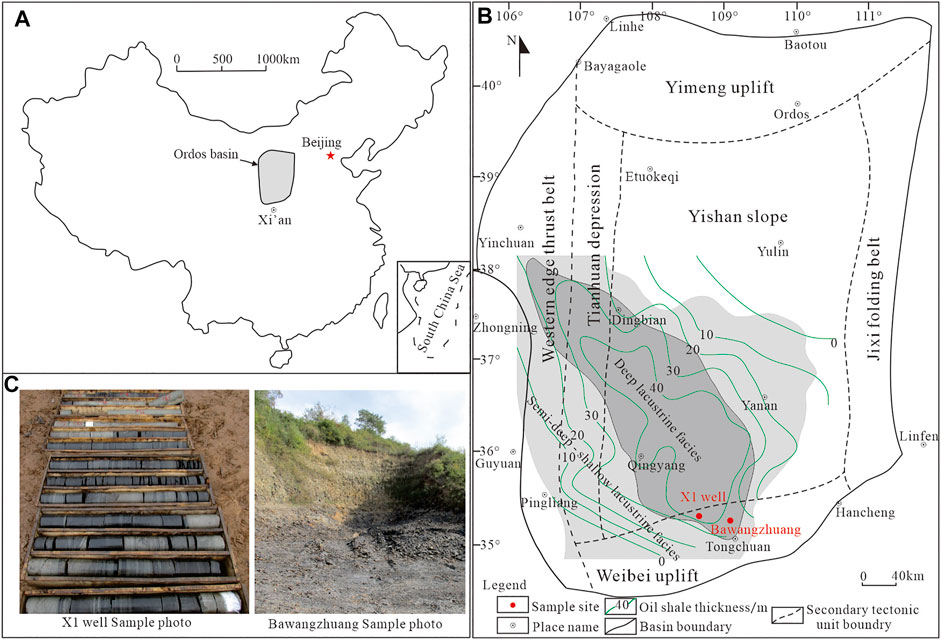
FIGURE 1. Tectonic characteristics and sample location of the Ordos Basin (Modified by [6, 7]. (A) Locations of the Ordos Basin, (B) Tectonic division and sampling location of Ordos Basin, (C) Sample photo.
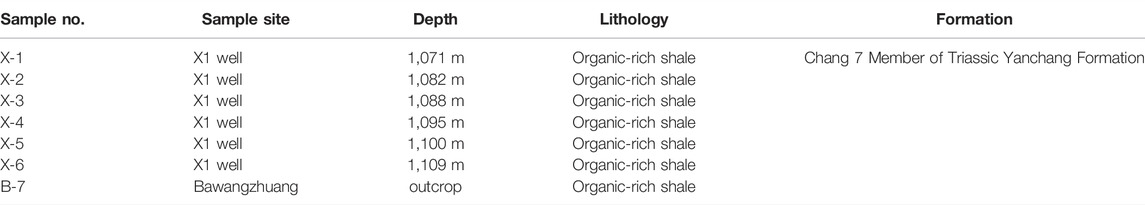
TABLE 1. Sample location and characteristics.
Experimental Analysis
Organic Maceral Analysis
The organic maceral analysis was carried out according to China Oil and Gas Industry Standard SY/T 5125-2014. The vitrinite reflectance (Ro) was measured according to Chinese National Standard GB/T 6948-2008, and the standard substance was yttrium aluminum garnet. The microscope utilized was Leitz ORTHOLUX-POL BK.
Rock-Eval Analysis
The measurement methods were based on Chinese National Standard GB/T 6948-2008 and included an OGE-VI oil and gas evaluation workstation for free hydrocarbon (S1), pyrolysis hydrocarbon (S2), maximum pyrolysis temperature (Tmax), total organic carbon (TOC), hydrogen index (HI), potential hydrocarbon generation capacity (S1+S2), and other parameters.
X-Ray Diffraction Analysis
The measurement method was based on China Petroleum Industry Standard GB/T 6948-2008, and the instrument was a D/MAX2400 X-ray diffractometer manufactured by RIGAKU. The mineral content was calculated by using the “K-value method”.
Low-Pressure CO2/N2 Adsorption
The measurement method was completed according to the standards of ISO 15901-2:2006 and ISO 15901-3:2007 issued by the International Organization for Standardization. A micromeritics ASAP 2460 automatic surface area and porosity analyzer in the United States measured the pore size parameters of low-temperature liquid nitrogen adsorption and low-temperature carbon dioxide adsorption. The instrument measures a specific surface area <0.0005 m2/g and a lower limit of pore volume (PV) < 0.0001 cm3/g. A 10 g sample was crushed to 0.177–0.25 mm. The moisture and volatile gas of the sample were removed from a vacuum at 100°C for 12 h. The instrument was vacuumed at 110°C for 8 h, and N2 protective gas was injected for the experimental test. The low-temperature liquid nitrogen adsorption is most suitable for the measurement of pores with a width of about 0.4–50 nm. The low-temperature carbon dioxide adsorption pressure up to 101 kPa detects from the smallest micropores to about 1.5 nm pores.
Isothermal Adsorption
The measurement method was based on the China National Standard GB/T 35210.1-2017. The GAI-100 isothermal gas adsorption instrument used in the experiment was manufactured by American Core Corporation. The shale samples with a particle size of 0.180–0.425 mm in dry or equilibrium water were placed in a closed container to measure the adsorption volume of methane gas when the shale samples reached adsorption equilibrium at constant temperature and different pressures. Langmuir monolayer adsorption theory calculated the characteristic parameters of methane gas adsorption, including Langmuir volume (VL) and Langmuir pressure (PL).
Results
Organic Maceral Characteristics
The contents of vitrinite in macerals ranged from 28 to 43% and included mainly perhydrous vitrinite. The inertinite content is 4–7%, and the inertinite is mainly fusinite. The exinite content is 52–69%, in which the cutinite content is 4–9%, the sporopollenite content is 1–3%, and the humic amorphogen content is 44–58%. The content of sapropelinite is 3–20%, of which the content of planktonic alginite is 3–16%, and the content of sapropelic amorphous alginite is 0–4%. Ro is 0.85–0.88%, indicating a low maturation-maturity. The organic matter type is II (Table 2).
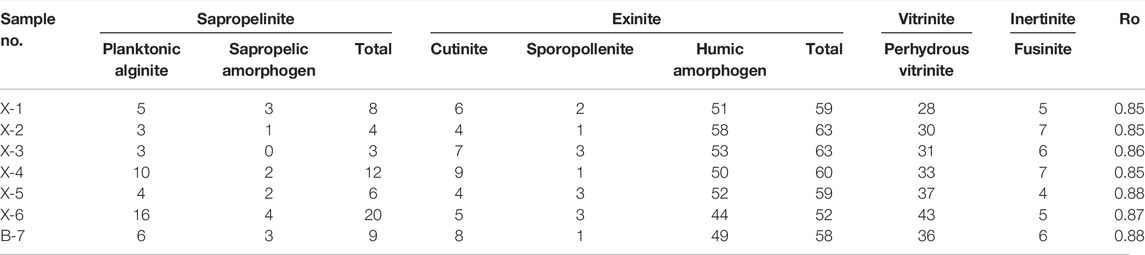
TABLE 2. Maceral content of shale samples (%).
Characteristics of Rock-Eval
The pyrolysis parameters of the sample rocks are shown in Table 3. TOC is 9.75–29.92%, S1 is 3.21–12.14%, S2 is 41.86–165.39%, S1+S2 is 47.66–176.56 mg/g, HI is 313–553 mg/g, HCI is 19.59–67.76%, and Tmax is 439–445°C. The TOC of shale in North America is generally in a range of 1.5–20%, while the TOC of Lewis shale in San Juan Basin, New Mexico, is relatively low in the range of 0.45–2.50% [8].
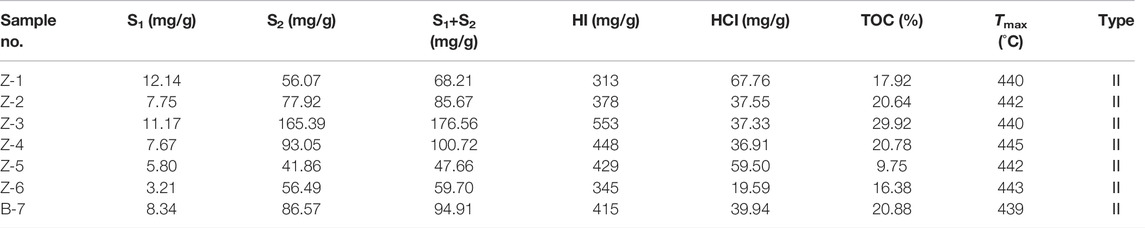
TABLE 3. Pyrolysis parameters of shale samples.
Mineral Composition
The mineral composition of the samples (excluding Z-2) is dominated by quartz, feldspar, and clay minerals. The quartz content is 3.94–43.27%, feldspar content is 9.65–30.07%, and clay mineral content is 13.46–59%. The contents of calcite 0.24–2.24%, iron dolomite 0–2.58%, apatite 0–3.42%, and pyrite 0–2.85% are small. In the clay minerals, I/S is 47–69%, illite is 20–28%, chlorite is 5–26%, and kaolinite contents are small and are distributed only in Z-3, Z-4, and Z-6 (Table 4).
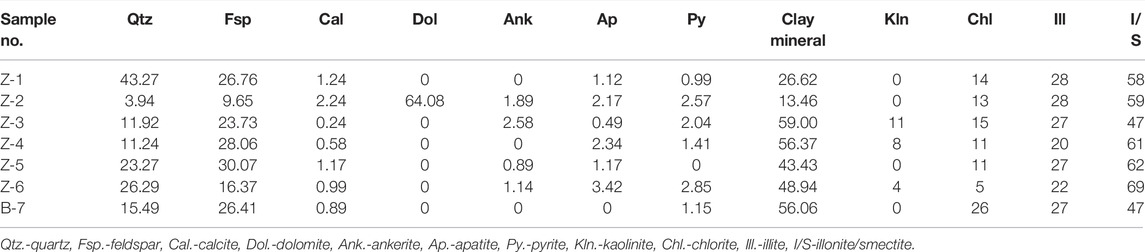
TABLE 4. Pyrolysis parameters of shale samples (%).
Characteristics of the Microscopic Pore Structure
Low-Temperature N2 Adsorption
The characteristics of the low-temperature nitrogen adsorption–desorption curve and its related parameters are effective methods to study the pore structure. The morphology of nitrogen adsorption and desorption curves and the “hysteresis loop” formed between them can effectively distinguish the pore geometry [9–12]. The nitrogen adsorption isotherms of shale samples show H3 and H4 types. The adsorption capacity of Z-5 is the smallest, and that of Z-7 was the largest (Figure 2).
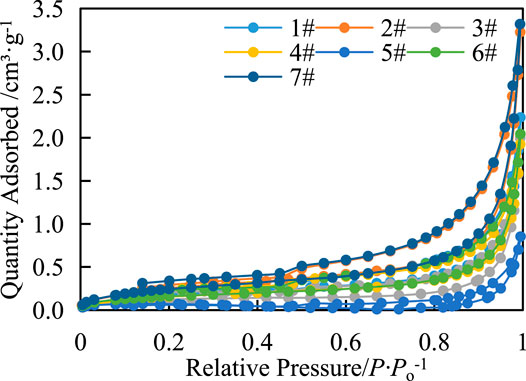
FIGURE 2. Characteristics of the adsorption–desorption curve of shale liquid nitrogen in the study area.
According to the classification of IUPAC, the shape of the adsorption curve of the samples is slightly different, and the whole is an inverted S type, which is a Type II adsorption isotherm. When the relative pressure (P/P0) is less than 0.1, the adsorption curve rises rapidly, and the proportion of micropores in the reaction sample is larger, which indicates strong adsorption capacity. The inflection point of the desorption curve decreases sharply when the relative pressure (P/P0) is 0.4–0.5, indicating that the sample has “small-necked bottle” or “inkbottle” pores. The pore size corresponding to the relative pressure at the inflection point is 3 nm according to the Kelvin equation, indicating that the pores with pore sizes <3 nm may be closed at one end. When the relative pressure (P/P0) is less than 0.4, the decline rate decreases further and almost coincides with the adsorption curve. When the relative pressure (P/P0) is greater than 0.4–0.5, a “hysteresis loop” is formed (Figure 2), indicating that the pores in the shale are mainly open pores at both ends. The pore types are mainly tubular pores and slit pores with parallel walls, providing favorable storage space for adsorbed and free shale gas.
The pore structural parameters reflected by liquid nitrogen adsorption are shown in Table 5. The results show that the proportion of micropores ranges from 0.0 to 7.8%, that of mesoporous pores ranges from 43.6 to 82.4%, and that of macroporous pores ranges from 9.8 to 56.4%. The SSA of the samples ranges from 0.058 to 0.493 m2/g, and the mesoporous contribution is dominant, followed by the macroporous contribution. The PV distribution ranges from 0.0013 to 0.004 9 cm3/g, and the PV contribution is mainly macropores, followed by mesopores.
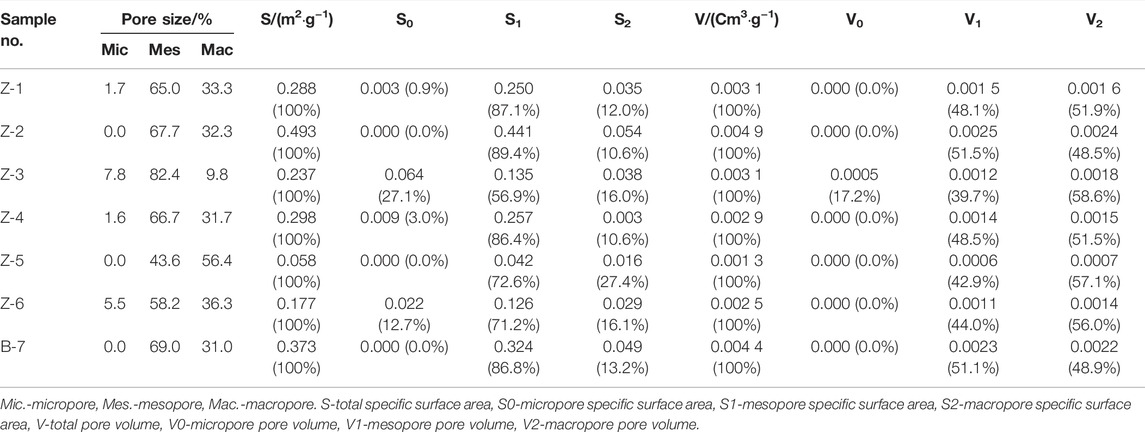
TABLE 5. Pore size parameters of liquid nitrogen adsorption and desorption in shale in the study area.
In this article, the pore size distribution and logarithmic coordinates of the SSA increase and PV increase are used to reflect the change characteristics of the SSA and PV in different pore size ranges. The figure of SSA vs. pore size of liquid nitrogen adsorption (Figure 3A) shows that with the increase in pore size, the increase of SSA presents a trend of increasing—decreasing—increasing—decreasing, and the mesopores contribute a large amount of SSA. The variation trend of PV is similar to that of SSA (Figure 3B) but is mainly concentrated between 20 and 200 nm.
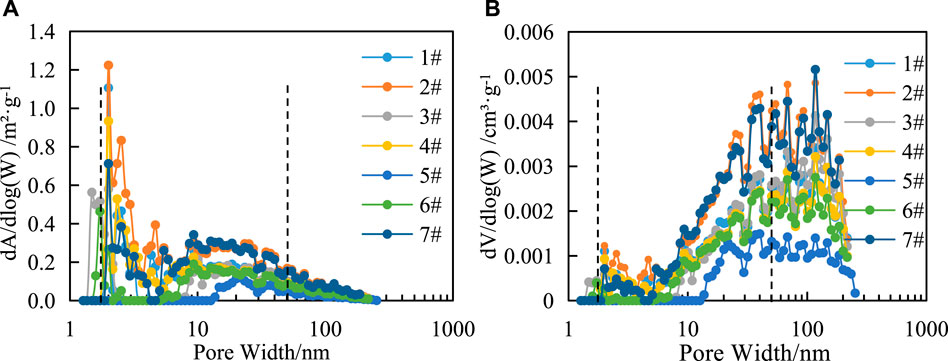
FIGURE 3. Relationship between the pore size distribution of liquid nitrogen adsorption and the specific surface area increment (A) and PV increment (B) of shale in the study area.
Low-Temperature CO2 Adsorption
The CO2 adsorption isotherm of the samples (Figure 4) shows that the adsorption isotherms have slightly different morphologies. In the microporous stage, CO2 on the shale surface presents as monolayer adsorption or microporous filling, and the adsorption curve and desorption curve coincide.
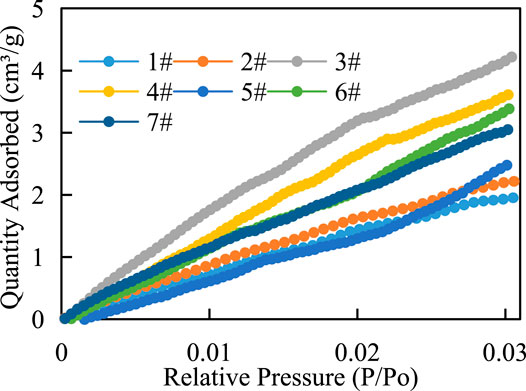
FIGURE 4. Characteristics of the low-temperature CO2 adsorption–desorption curve of shale in the study area.
The SSA of samples is 17.846–31.624 m2/g, PV 0.000 12–0.009 62 cm3/g. As shown in Figure 5, the total SSA and PV of the samples are mainly concentrated in pore sizes of 0.48–0.66 nm and 0.75–0.85 nm, respectively, showing an overall trend of increasing—decreasing—increasing—decreasing.
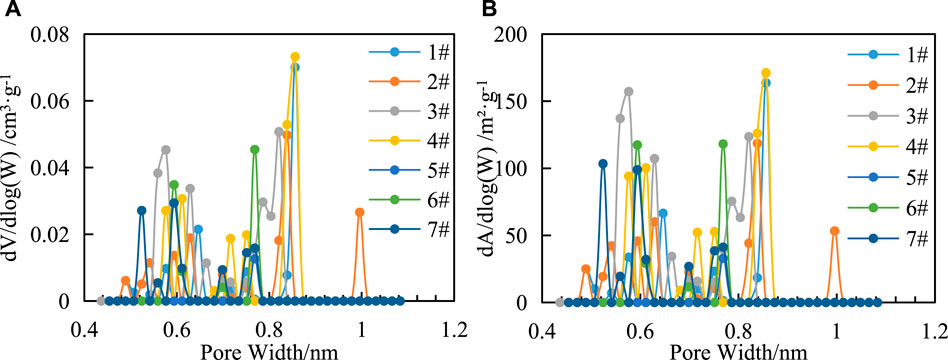
FIGURE 5. Relationship between pore size distribution of CO2 adsorption and SSA increment (A) and PV increment (B) of shale in the study area.
Adsorption Capacity
There are three states of gas in shale, including adsorbed gas, free gas and dissolved gas. Adsorbed gas mainly exists on the surface of organic matter and clay minerals, while free gas mainly exists in matrix pores and fractures. In this article, the adsorption capacity of shale in Chang 7 was studied by isothermal adsorption experiments. Figure 6 shows that under the same temperature condition, the adsorption capacity of shale increases with the increase of pressure but the increase rate is different in each period, with a rapid increase in the early stage and a slow increase in the late stage. The results show that Langmuir volume (VL) was 2.06–5.57 cm3 g−1, and Langmuir pressure (PL) was 2.16–3.28 MPa (Figure 6), methane adsorption capacity of shale is average.
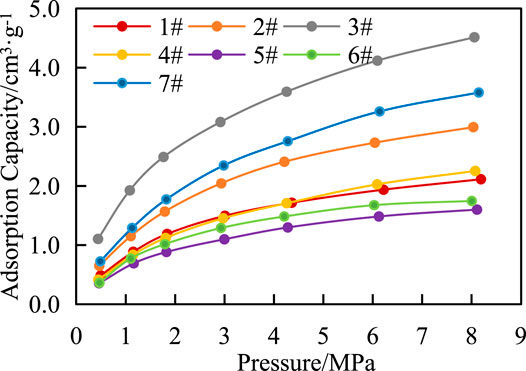
FIGURE 6. Isothermal adsorption curve characteristics of shale samples in the study area.
Discussion
Influencing Factors of Microscopic Pore Structure
Mineral Composition Affects Pore Structure
The results show that the relationship between quartz content, clay mineral content percentage, and pore SSA decreased first and then increased. The PV also showed similar variation characteristics. The quartz content of the samples was bound by 25% (Figure 7A). If the quartz content was less than 25%, it was negatively correlated with the SSA or PV; if the quartz content was greater than 25%, it was positively correlated. The SSA and PV of quartz are much smaller than those of organic matter and clay minerals [13], so the SSA and PV of the sample will decrease with the increase of quartz. However, quartz is a rigid mineral with good compaction resistance compared with organic matter and clay minerals, which is conducive to the preservation of primary pores and easy to produce micro-cracks under pressure, resulting in the increase of PV.
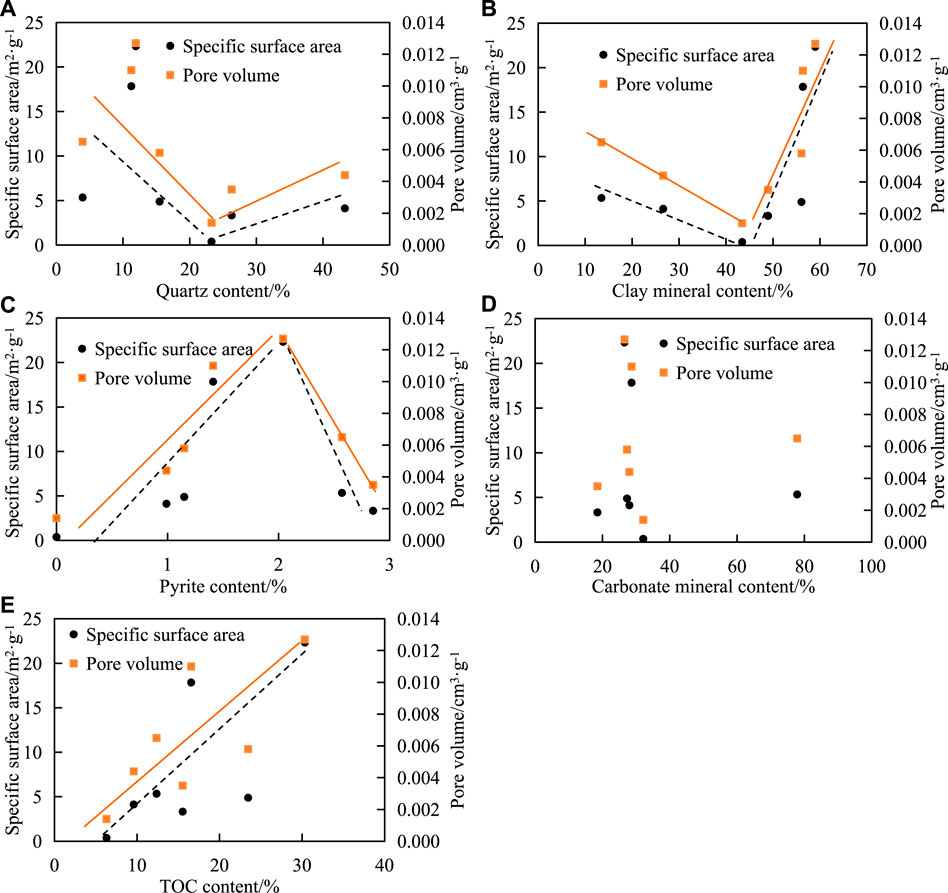
FIGURE 7. Correlation between mineral composition, TOC content, and pore structure in shale. The correlation between SSA,PV and (A) quartz content, (B) clay mineral content, (C) pyrite content, (D) carbonate mineral content, (E) TOC content.
The clay mineral content of the samples was bound by 45% (Figure 7B). If the clay mineral content was less than 45%, it was negatively correlated with the SSA or PV; if the clay mineral content was greater than 45%, it was positively correlated. There was no obvious correlation between carbonate content and SSA and PV in the shale (Figure 7C).
The pyrite content of the samples was delimited by 2% (Figure 7D). If the pyrite content was less than 2%, it was positively correlated with the SSA or PV; if the quartz content was greater than 2%, it was negatively correlated. Due to dissolution, several pores are easily formed between the crystal particles in pyrite, providing a larger SSA and PV. However, more pyrite tends to fill the original intergranular pores or intragranular pores. The research results of marine shale also show the same characteristics [14].
The dissolution pores of feldspar, calcite, and other easily dissolved minerals found in and on the surface of mineral particles under field emission scanning electron microscopy, with uneven distribution of pore sizes ranging from ten to hundreds of nanometers, are important seepage space in the shale. The characteristics of clay minerals influence the pore structure and gas-bearing properties of shale reservoirs. [15] believed that chlorite in shale clay minerals can block shale pores and reduce the SSA of shale, while the clay mineral content is low and porosity is low. [16] pointed out that the nanoscale pores and adsorption capacity of different types of clay minerals are different, and the degree of pore development and adsorption capacity are as follows: mectite, illonite/smectite, kaolinite, chlorite, and illite. [17] believed that the higher the content of I/S is, the more developed the shale reservoir and the higher the adsorbed gas of shale. [18] found that clay minerals have more nanoscale pores and larger SSAs, which is favorable for shale gas adsorption. When the TOC is low, clay minerals contribute significantly to the adsorption capacity of gas. The shale clay minerals in Chang 7 are mainly composed of I/S, which is favorable for the development of nanoscale pores.
TOC Affects Pore Structure
In this study, the correlation between TOC and pore SSA and PV was positive, and the correlation coefficient between TOC and micropore SSA and PV was high (Figure 7E).
Macerals Affect Pore Structure
The influence of macerals on pore SSA and PV is complex, and some scholars believe that there is a positive correlation between them, while others believe that there is no correlation between them. The relationship between maceral and pore structure of shale samples in this study is shown in Figure 8. The results show that there is a negative correlation between vitrinite content and pore SSA, and the correlation coefficient between vitrinite content and micropores is higher than that between mesopores and macropores (Figures 8A-C). There is a positive correlation between inertinite content and pore SSA, and the correlation coefficient between inertinite content and mesopores is higher than that of micropores and macropores (Figures 8D-F). There is a positive correlation between exinite content and pore SSA, and the correlation coefficient between exinite content and micropores is higher than that of mesopores and macropores (Figures 8G-I). The shale content has a positive correlation with the SSA of the pore structure, and the correlation coefficient with micropores is higher than that of mesopores and macropores.
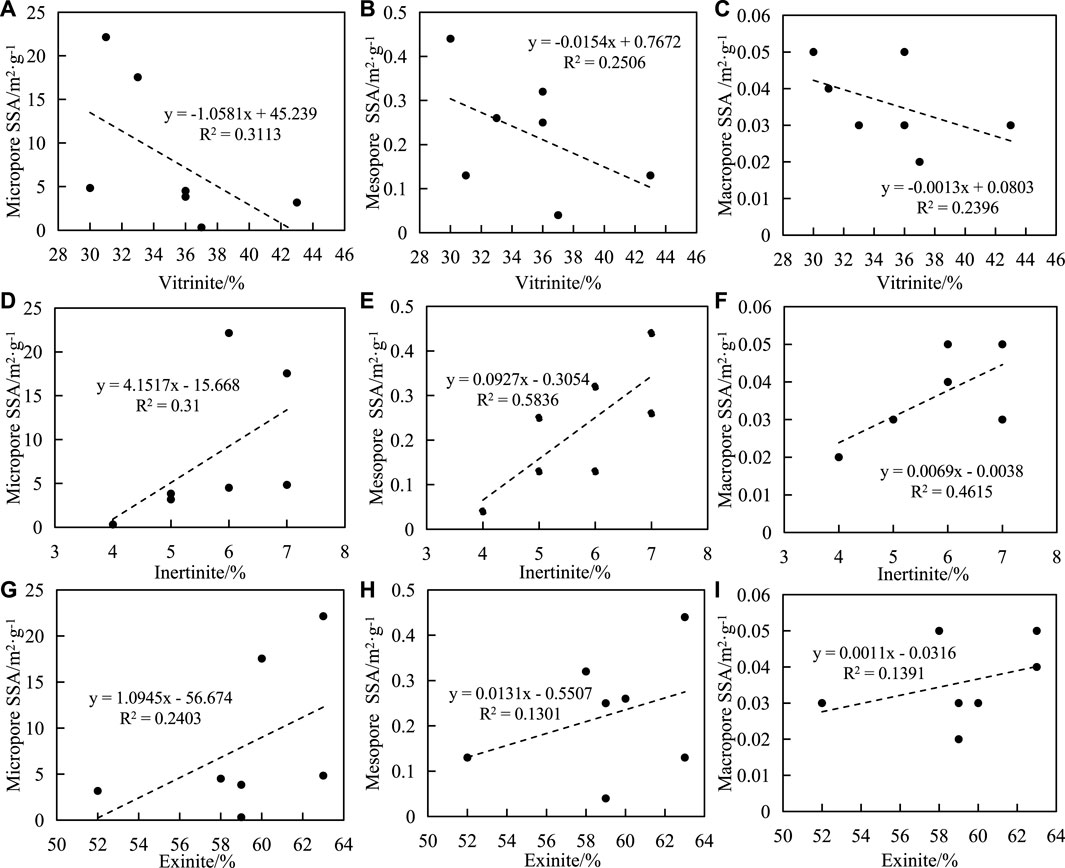
FIGURE 8. Correlation between macerals and SSA of shale. (A) vitrinite and micripore SSA, (B) vitrinite and mesopore SSA, (C) vitrinite and macropore SSA, (D) inertinite and micropore SSA, (E) inertinite and mesopore SSA, (F) inertinite and macropore SSA, (G) exinite and micropore SSA, (H) exinite and mesopore SSA, (I) exiniteand macropore SSA.
Previous studies have shown that pore sizes less than 2 nm in organic-rich shale are closely related to organic matter. However, some scholars have found that the pore structure parameters of organic-rich shale do not simply increase with changes in organic matter content. Within a certain range, the higher the organic matter content is, the more micropores develop. When the organic matter content exceeds this range, the effect of organic matter content on the pore structure of organic-rich shale may be the opposite. For example, [19] evaluated the nanopore structure of organic-rich shale in the Longmaxi Formation in a certain area of southern Sichuan-northern Guizhou and found that when TOC was less than 2.2%, the micropore volume was positively correlated with TOC. However, when TOC was greater than 5.21%, there was a negative correlation between micropore volume and TOC. [20] found that the pore SSA, PV, and porosity of Permian shales in the Sichuan Basin had no or a weak negative correlation with TOC, while the pore SSA, PV, and porosity of Silurian shales had a good positive correlation with TOC. [21] found that TOC had no significant effect on pore structure in samples with TOC less than 2% in the Shanxi and Taiyuan formations in Carboniferous and Permian shales and the middle Proterozoic Hongshuizhuang and Xiamaling formations in North China. However, when TOC was in a range of 2–4.58%, there was a weak negative correlation between TOC and PV and pore SSA. When TOC was greater than 4.58%, TOC was negatively correlated with PV and pore SSA. [22] studied marine organic-rich shale in the Longmaxi Shale, Sichuan Basin, and they believed that organic pores contributed more than 60% of porosity, and TOC was the main controlling factor of shale porosity. There was a positive correlation between clay mineral content and porosity due to the existence of widely developed pores and intergranular pores in the organic clay complex. Carbonate and quartz mainly dilute TOC and are negatively correlated with porosity. To date, there has been no conclusion about the effect of organic matter content on the pore structure of organic-rich shale. Although the contribution of organic matter to shale porosity is large, it is mainly based on rock samples from the same geological background. In other words, when the influence of organic matter content on the pore structure of shale was considered, other factors, such as the thermal evolutionary degree of organic matter, type of organic matter and mineral composition, were investigated.
The shale samples collected in this study are from the Triassic Yanchang Formation. The vitrinite reflectance of the samples is 0.8–0.95%, and the thermal evolutionary degree is low, which limits the development of organic pores. The clay mineral content of the samples is higher than that of marine shale, and a large number of 1–2 nm micropores are developed in the clay minerals providing more pore SSA [23–26].
The relationship between the quartz content and total SSA and the total PV of the shale samples shows a trend of decreasing first and then increasing. In this study, although quartz can fill organic pores, with the increase in its content, it provides certain support for the development of pores, and quartz particles are prone to produce cracks at the edges when subjected to stress, which improves the conditions of porosity and permeability. Carbonate minerals easily contact acid and alkaline fluids during the maturation of organic matter to form dissolution pores in grains. All the aforementioned results show the complex diversity of the microscopic pore structure of the shale.
Influencing Factors of Methane Adsorption Capacity
TOC Affects Methane Adsorption
It is shown that gas content increases with the increase of total organic carbon content in shale [27]. In this study, the TOC content of samples is positively correlated with VL, and the correlation coefficient is high (Figure 9), indicating that shale with high TOC content has better methane adsorption.

FIGURE 9. Correlation between TOC content and VL in shale.
Pore Structure Affects Methane Adsorption
The relationship between the SSA and PV of samples and VL is as follows: 1) The SSA of micropores, mesopores, and macropores are positively correlated with VL, and the correlation coefficients are 0.58, 0.37, and 0.71, respectively (Figures 10A–C). 2) There is a positive correlation between the micropore volume, mesopores volume and macropores volume, and VL, with correlation coefficients of 0.53, 0.52, and 0.73, respectively (Figures 10D–F).
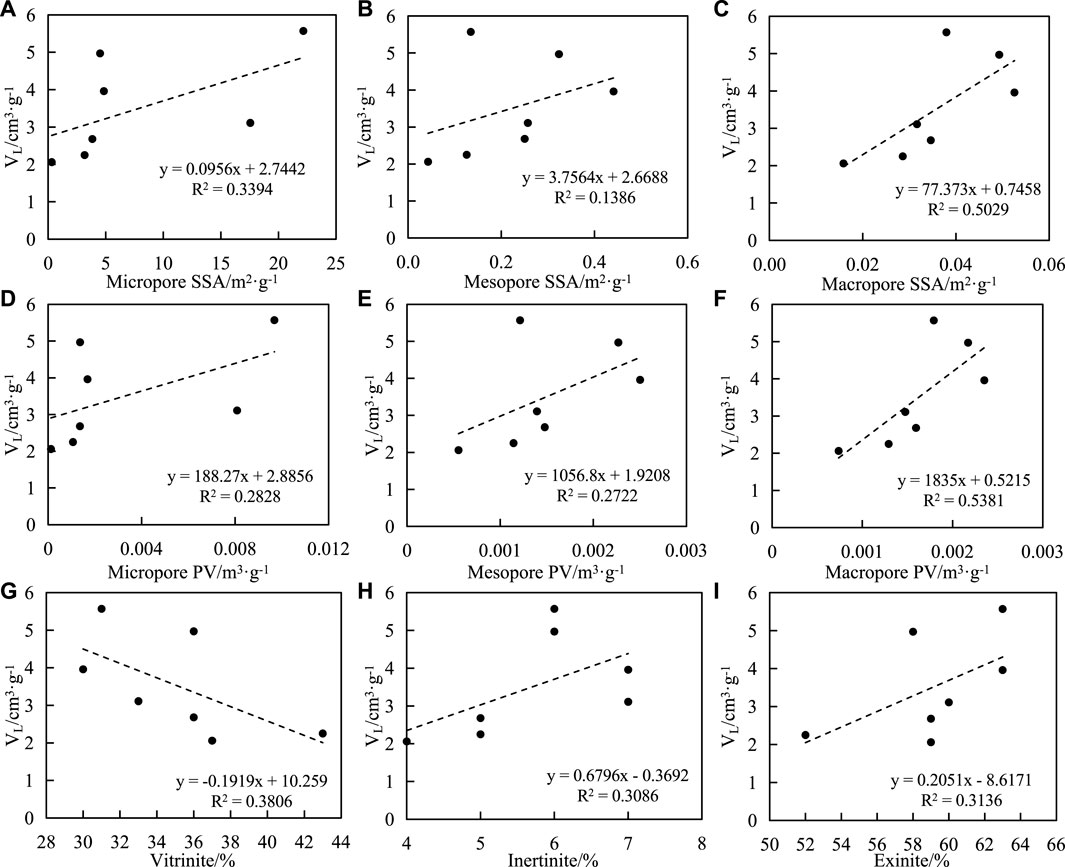
FIGURE 10. Correlation between Langmuir volume (VL), macerals and pore structure of shale. (A) VL and micripore SSA, (B) VL and mesopore SSA, (C) VL and macropore SSA, (D) VL and micropore PV, (E) VL and mesopore PV, (F) VL and macropore PV, (G) VL and vitrinite, (H) VL and inertinite, (I) VL and exinite.
Macerals Affects Methane Adsorption
The correlations between the contents of macerals (vitrinite, inertinite, and exitinite) and VL in samples are as follows: 1) the correlations between the contents of vitrinite and VL are negative, the correlation coefficient is 0.62; 2) It was positively correlated with inertinite content and exitinite content, with correlation coefficients of 0.56 (Figures 10G–I).
The aforementioned results show that there is a positive correlation between VL and SSA of the sample, indicating that the SSA of shale is the storage site of adsorbed gas. The larger the SSA is, the more points are available for methane molecule adsorption, so the stronger the adsorption capacity is, the larger the VL is [28–31].
Among the macerals of organic-rich shale in the study area, humic amorphoge is the main component of exinite, perhydrous vitrinite is the main component of vitrinite, and fusinite is the main component of inertinite. The maturity index of organic-rich shale Ro ≈ 0.85–0.88% enters the “oil generation window”. Under the influence of thermal evolution, vitrinite is dominated by oil generation and assisted by gas generation. The generated bitumen fills the pores and cannot be discharged effectively, resulting in the decrease of pores in vitrinite, which is negatively correlated with SSA and PV. Generally, inertinite produces neither gas nor oil, but it is different from ordinary “dead carbon” [4] and retains the original pores. However, some studies believe that inertinite can be used as gas [32] to support the understanding of this article. The exinite mainly produces gas, and the pores are favorable for methane storage. The increase of pores in inertinite and exinite has a positive effect on the storage of methane.
In this study, the research results are different from the characteristics of marine shale. According to previous studies on marine shale, when the TOC is above 0.5%, the SSA of shale is mainly contributed by organic matter, followed by clay minerals (Chen et al., 2012). The maturity of organic matter in terrestrial shale is lower than that in marine shale, and the development of organic matter pores is less. At the same time, the content of clay minerals is higher than that in marine shale, generally exceeding 35%. The clay mineral pores provide specific surfaces and adsorption sites for methane adsorption, and the methane molecules mainly exist on the clay minerals. [29] found that there was a positive correlation between the maximum adsorbed gas volume and the total PV of shale, which was consistent with the research results in this study. Although micropores and mesopores have larger SSA than macropores, the macropores can also store methane. The results show that there is a good positive correlation between VL and micropore volume of continental shale and a complex relationship between VL and volume of mesopores and macropores. The adsorption of methane from shale is mainly affected by microscopic pore structure, which is controlled by TOC content and mineral composition and macerals.
Conclusion
The TOC of the organic-rich shale in Chang 7 is 9.75–29.92%, and the organic matter types are mainly Type II in the study area. The thermal evolutionary degree of organic matter is a low mature–mature stage, which provides the geological conditions for the formation of shale gas. The pore size of the shale reservoir is mainly medium pores; dissolution pores and pyrite intergranular pores are developed, and the pore type is mainly tubular pores and parallel wall slit pores.
The relationship between the mineral content and pore specific surface area decreases first and then increases, mainly affected by quartz content, clay mineral content, and pyrite content. The PV also shows the same trend.
The TOC content is positively correlated with pore SSA and PV and has a high correlation with micropore SSA and PV. The correlation between vitrinite content and pore SSA is negative, and the correlation coefficient with micropores is higher than that with mesopores and macropores. The inertinite content is positively correlated with the specific pore surface area, and the correlation coefficient between inertinite content and mesopores is higher than that between micropores and macropores. The exinite content is positively correlated with the SSA of the pore structure, and the correlation coefficient with micropores is higher than that of mesopores and macropores.
Shale gas content is mainly affected by TOC, microscopic pore structure, and macerals, among which there is a positive correlation with TOC and microscopic pore structure. The relationship between shale gas content and macerals is complex, with a negative correlation with vitrinite and a positive correlation with inertinite and exinite.
Data Availability Statement
The original contributions presented in the study are included in the article/Supplementary Material, further inquiries can be directed to the corresponding author.
Author Contributions
FY: conceptualization, methodology, and writing—original draft. DM: validation and writing—review and editing. ZD: resources and investigation. DR: investigation and formal analysis. TT: data curation and visualization. DF: writing—review and editing.
Funding
The Natural Science Foundation of Shaanxi Province (2020JQ-1000), the Postdoctoral Fund Project of Shaanxi Province (2018BSHQYXMZZ08), and the Project of the Key Laboratory of Coal Exploration and Comprehensive Utilization, MNR (KF2021-3), supported this study.
Conflict of Interest
Author FY was employed by Shaanxi Coal Geology Group Co., Ltd., China.
The remaining authors declare that the research was conducted in the absence of any commercial or financial relationships that could be construed as a potential conflict of interest.
Publisher’s Note
All claims expressed in this article are solely those of the authors and do not necessarily represent those of their affiliated organizations, or those of the publisher, the editors, and the reviewers. Any product that may be evaluated in this article, or claim that may be made by its manufacturer, is not guaranteed or endorsed by the publisher.
References
1. Curtis JB. Fractured Shale-Gas Systems. AAPG Bull (2002) 86:1921–38. doi:10.1306/61eeddbe-173e-11d7-8645000102c1865d
2. Jarve DM, Hill RJ, Pollastro RM. A Ssessment of the Gas Potential and Yields from Shales: The Barnett Shale Mode. In: BJ Cardott, editor. Proceedings of the Unconventional Energy Resources in the Southern Mid-continent. Conference: Oklahoma Geological Survey Circular; March 9, 2004; Oklahoma City, Oklahoma (2005). p. 37–50.
3. Zeng WT, Zhang JC, Ding WL, Wang XZ, Zhu DW. The Gas Content of continental Yanchang Shale and its Main Controlling Factors: A Case Study of Liuping-171 Well in Ordos Basin. Nat Gas Geosci (2014) 25(2):291–301. doi:10.11764/j.issn.1672-1926.2014.02.291
4. Jiang F, Chen D, Wang Z, Xu Z, Chen J, Liu L, et al. Pore Characteristic Analysis of a Lacustrine Shale: A Case Study in the Ordos Basin, NW China. Mar Pet Geology (2016) 73:554–71. doi:10.1016/j.marpetgeo.2016.03.026
5. Yu YX, Luo XR, Lei YH, Ming C, Wang X-Z, Zhang L-X, et al. Characterization of Lacustrine Shale Pore structure:An Example from the Upper-Triassic Yanchang Formation, Ordos Basin. Nat Gas Geosci (2016) 27(4):716–26. doi:10.11764/j.issn.1672-1926.2016.04.0716
6. Lu JC, Li YH, Wei XY, Wei JS. Research on the Depositional Environment and Resources Potential of the Oil Shale in the Chang 7 Member, Triassic Yanchang Formation in the Ordos Basin. J Jilin Univ (Earth Sci Edition) (2006) 36(6):928–32. doi:10.13278/j.cnki.jjuese.2006.06.010
7. Liu CY, Zhao HG, Gui XJ, Yue L, Zhao J, Wang JQ. Space-Time Coordinate of the Evolution and Reformation and Mineralization Response in Ordos Basin. Acta Geologica Sinica (2006) 80(5):617–38. doi:10.3321/j.issn:0001-5717.2006.05.001
8. Montgomery SL, Jarvie DM, Bowker KA, Pollastro RM. Mississippian Barnett Shale, Fort Worth basin, north-central Texas: Gas-Shale Play with Multi–Trillion Cubic Foot Potential. AAPG Bull (2005) 89(2):155–75. doi:10.1306/09170404042
9. Labani MM, Rezaee R, Saeedi A, Hinai AA. Evaluation of Pore Size Spectrum of Gas Shale Reservoirs Using Low Pressure Nitrogen Adsorption, Gas Expansion and Mercury Porosimetry: A Case Study from the Perth and Canning Basins, Western Australia. J Pet Sci Eng (2013) 112(7):7–16. doi:10.1016/j.petrol.2013.11.022
10. Thommes M, Kaneko K, Neimark AV, Olivier JP, Rodriguez-Reinoso F, Rouquerol J, et al. Physisorption of Gases, with Special Reference to the Evaluation of Surface Area and Pore Size Distribution. Pure Appl Chem (2015) 87(9-10):1051–69. doi:10.1515/pac-2014-1117
11. Yu YX, Wang ZX, Zhang KX, Cheng M. Advances in Quantitative Characterization of Shale Pore Structure by Using Fluid Injection Methods. J Geomechanics (2020) 26(2):201–10. doi:10.12090/j.issn.1006-6616.2020.26.02.019
12. Liu D, Ren D, Du K, Qi Y, Ye F. Impacts of mineral Composition and Pore Structure on Spontaneous Imbibition in Tight sandstone. J Pet Sci Eng (2021) 201:108397. doi:10.1016/j.petrol.2021.108397
13. Tian H, Pan L, Zhang T, Xiao X, Meng Z, Huang B. Pore Characterization of Organic-Rich Lower Cambrian Shales in Qiannan Depression of Guizhou Province, Southwestern China. Mar Pet Geology (2015) 62:28–43. doi:10.1016/j.marpetgeo.2015.01.004
14. Tian T, Fu DL, Yang F, Duan ZH, Lin YB, Zhao YJ, et al. Relationship between mineral Composition and Micro-pores of Niutitang-Formation Shale in Micangshan-Hannan Uplift. J China Coal Soc (2018) 43(S1):236–44. doi:10.13225/j.cnki.jccs.2017.1646
15. Li HC, Liu DY, Peng PA, Wang QT. Tectonic Impact on Reservoir Character of Chongqing and its Neighbor Area. Nat Gas Geosci (2015) 26(9):1705–11. doi:10.11764/j.issn.1672-1926.2015.09.1705
16. Ji LM, Ma XX, Xia YQ, Qiu J-L. Relationship between Methane Adsorption Capacity of Clay Minerals and Micropore Volume. Nat Gas Geosci (2014) 25(2):141–52. doi:10.11764/j.issn.1672-1926.2014.02.0141
17. Wang XP, Mou CL, Wang QY, Ge XY, Chen XL, Zhou KK, et al. Diagenesis of Black Shale in Longmaxi Formation, Southern Sichuan Basin and its Periphery. Acta Petrolei Sinica (2015) 36(9):1035–47. doi:10.7623/syxb201509002
18. Zhang PH, Chen ZY, Xue L, Bao Y, Fang Y. The Differential Diagenetic Evolution and its Influencing Factors of Lower Cambrian Black Rock Series in the Northwestern Margin of Tarim Basin. Acta Petrologica Sinica (2020) 36(11):3463–76. doi:10.18654/1000-0569/2020.11.13
19. Wei XF, Liu RB, Zhang TS, Liang X. Micro-pores Structure Characteristics and Development Control Factors of Shale Gas Reservoir: A Case of Longmaxi Formation in XX Area of Southern Sichuan and Northern Guizhou. Nat Gas Geosci (2013) 24(5):1048–59. doi:10.11764/j.issn.1672-1926.2013.05.1048
20. Cao T, Song Z, Wang S, Cao X, Li Y, Xia J. Characterizing the Pore Structure in the Silurian and Permian Shales of the Sichuan Basin, China. Mar Pet Geology (2015) 61:140–50. doi:10.1016/j.marpetgeo.2014.12.007
21. Chen SY, Qin Y. Nanometer Pore Structure and Geological Controls of Shale Samples in Northern Hebei Province, China. Nat Gas Geosci (2017) 28(6):873–81.
22. Wang Q, Wang T, Liu W, Zhang J, Feng Q, Lu H, et al. Relationships Among Composition, Porosity and Permeability of Longmaxi Shale Reservoir in the Weiyuan Block, Sichuan Basin, China. Mar Pet Geology (2019) 102:33–47. doi:10.1016/j.marpetgeo.2018.12.026
23. Aringhieri R. Nanoporosity Characteristics of Some Natural Clay Minerals and Soils. Clays Clay Miner. (2004) 52(6):700–4. doi:10.1346/ccmn.2004.0520604
24. Chen L, Jiang ZX, Ji WN, Chen WT, Wang PF, Hu T, et al. Characteristics of Microscopic Pore Structures and Their Effect Impacts on Methane Adsorption Capacity in Continental Shales. Geol J China Universities (2016) 22(2):335–43. doi:10.16108/j.issn1006-7493.2015180
25. Chalmers GR, Bustin RM, Power IM. Characterization of Gas Shale Pore Systems by Porosimetry, Pycnometry, Surface Area, and Field Emission Scanning Electron Microscopy/transmission Electron Microscopy Image Analyses: Examples from the Barnett, Woodford, Haynesville, Marcellus, and Doig Units. Bulletin (2012) 96(6):1099–119. doi:10.1306/10171111052
26. Chalmers GRL, Ross DJK, Bustin RM. Geological Controls on Matrix Permeability of Devonian Gas Shales in the Horn River and Liard Basins, Northeastern British Columbia, Canada. Int J Coal Geology (2012) 103:120–31. doi:10.1016/j.coal.2012.05.006
27. Ma YZ, Holditch SA. Unconventional Oil and Gas Resources Handbook: Evaluation and Development. Houston, Texas: Gulf Professional Publishing (2016). p. 1–536.
28. Bi H, Jiang ZX, Li P, Cheng LJ, Zeng CL, Xu Y, et al. Adsorption Characteristic and Influence Factors of Longmaxi Shale in Southeastern Chongqing. Nat Gas Geosci (2014) 25(2):302–10. doi:10.11764/j.issn.1672-1926.2014.02.0302
29. Ren ZY, Liu LF, Gao XY, Xiao F, Wang Y, Wu K-J, et al. Adsorption Capacity and its Influence Factors of the Jurassic Shale in the Northeastern Kuqa Depression. Nat Gas Geosci (2014) 25(4):632–40. doi:10.11764/j.issn.1672-1926.2014.04.0632
30. Tang L, Song Y, Jiang Z, Pang X, Li Z, Li Q, et al. Influencing Factors and Mathematical Prediction of Shale Adsorbed Gas Content in the Upper Triassic Yanchang Formation in the Ordos Basin, China. Minerals (2019) 9(5):265–89. doi:10.3390/min9050265
31. Kong X, Lu S, Xiao D, Fan H, Mu P, Jiang S. Analysis of Adsorption Characteristics and Influencing Factors of Wufeng-Longmaxi Formation Shale in Sichuan Basin. Energy Fuels (2021) 35(6):4925–42. doi:10.1021/acs.energyfuels.1c00273
Keywords: Ordos Basin, shale gas, micropore structure, adsorption capacity, influence factor
Citation: Yang F, Ma D, Duan Z, Ren D, Tian T and Fu D (2022) Micropore Structural Characteristics and Influence Factors of Triassic Shale Gas Adsorption in the Ordos Basin. Front. Phys. 10:851131. doi: 10.3389/fphy.2022.851131
Received: 09 January 2022; Accepted: 14 March 2022;
Published: 26 April 2022.
Edited by:
Qingxiang Meng, Hohai University, ChinaReviewed by:
Jing Li, Northwest Institute of Eco-Environment and Resources (CAS), ChinaShixin Dai, Hunan University of Science and Technology, China
Copyright © 2022 Yang, Ma, Duan, Ren, Tian and Fu. This is an open-access article distributed under the terms of the Creative Commons Attribution License (CC BY). The use, distribution or reproduction in other forums is permitted, provided the original author(s) and the copyright owner(s) are credited and that the original publication in this journal is cited, in accordance with accepted academic practice. No use, distribution or reproduction is permitted which does not comply with these terms.
*Correspondence: Fu Yang, eWFuZ3B1NjY2QDE2My5jb20=