 Talha Erdem1,2*
 Thomas O’Neill1Mykolas Zupkauskas1Alessio Caciagli1Peicheng Xu1,3
 Yang Lan1,4
 Peter Bösecke5
 Erika Eiser1,6*
- 1Cavendish Laboratory, Department of Physics, University of Cambridge, Cambridge, United Kingdom
- 2Department of Electrical-Electronics Engineering, Abdullah Gül University, Kayseri, Turkey
- 3Institute of Physics, Chinese Academy of Sciences, Beijing, China
- 4Department of Chemical Engineering, University College London, London, United Kingdom
- 5European Synchrotron Radiation Facility, Grenoble, France
- 6PoreLaboratory, Department of Physics, Norwegian University of Science and Technology, Trondheim, Norway
Spatially ordered arrangements of spherical colloids are known to exhibit structural colours. The intensity and brilliance of these structural colours typically improve with colloidal monodispersity, low concentrations of point and line defects and with increasing refractive index contrast between the colloids and the embedding medium. Here we show that suspensions of charge stabilised, fluorinated latex particles with low refractive-index contrast to their aqueous background form Wigner crystals with FCC symmetry for volume fractions between 13 and 40%. In reflection they exhibit both strong, almost angle-independent structural colours and sharp, more brilliant Bragg peaks despite the particle polydispersity and bimodal distribution. Simultaneously, these suspensions appear transparent in transmission. Furthermore, binary AB, A2B and A13B type mixtures of these fluorinated and similarly sized polystyrene particles appeared predominantly white but with clear Bragg peaks indicating a CsCl-like BCC structure and more complex crystals. We characterised the suspensions using a combination of reflectivity measurements and small-angle x-ray scattering, complemented by reflectivity modelling.
1 Introduction
Colloidal particles are ubiquitous: they are a major ingredient in cosmetics [1], agriculture [2], bio-imaging [3] and electronics [4], to mention but a few. Due to their size, ranging from tens of nanometres to a few micrometres, they are also known to display structural colours when assembled into crystals [3,5–10]. For this reason, a lot of research effort has been devoted to the study of colloidal crystallisation [11–17]. The systematic study of colloidal crystals has been instrumental in enhancing our understanding of nucleation and growth phenomena and the design of systems with interesting optical, electronic, or mechanical properties [10,18–20]. Synthetic colloidal crystals can be made from a variety of materials, such as inorganic nanocrystals [21–24], biological materials [25,26] and polymers [27–30].
Hard, spherically symmetric colloids that are larger than 100 nm can form crystals with photonic activity in the visible range with either face-centred cubic (FCC), hexagonal close-packed (HCP), or random hexagonal closed-packed (RHCP) lattices [31–33]. On the other hand, softer spheres with long-range repulsive Coulomb interactions can form body-centred cubic (BCC) and other lattice structures, depending on the strength of the interaction [34–36]. Use of long polymers grafted to nanoparticles [37] is another means to introduce ‘soft’ interactions.
The type of lattice formed, as well as the size and refractive index of the colloids, govern the optical features of these photonic systems. For example, close-packed FCC lattices made of a single type of colloid cannot exhibit a full bandgap regardless of the refractive index difference between the medium and the colloids [38]. However, strong Bragg reflections can be observed at certain angles [39]. The refractive index contrast Δn between the colloid and the surrounding medium is an essential parameter for designing materials with structural colour. Finlayson and co-workers [40] demonstrated that while the strength of the reflection in photonic crystals is expected to have a (Δn)2 dependence due to Fresnel reflections, the distortions in the lattice structure and the size distribution of the colloids change this dependence to a linear variation in Δn [40]. They also showed that when Δn = 0.05, the reflectance from the solid colloidal photonic crystals is less than 10% and strongly angle dependent [41]. In contrast, photonic crystals with strong structural colour tend to have very low transmission. In other words, it is challenging to make photonic crystals that have strong structural colours and yet are not opaque.
With the motivation of overcoming this transparency problem of photonic crystals, here we employed the fluorinated latex (FL) particles that possess a low refractive index difference with the aqueous background. We observed that at low concentrations the FL particle dispersion is opaque, but as the concentration of the particles increases, the dispersion turns to transparent accompanied by first a red reflection then by a green and blue reflections that are almost angle-independent. The reflection spectra show strong, sharp, and clear Bragg peaks despite the particle polydispersity and bimodal distribution. We found that these FL particles form Wigner crystals with FCC symmetry for volume fractions between 13 and 40% leading to a concentration-dependent iridescent appearance. Furthermore, upon mixing these FL particles with polystyrene particles with similar sizes we obtained binary AB, A2B and A13B type crystals that appeared predominantly white but with clear Bragg peaks indicating a CsCl-like BCC structure and more complex crystals.
2 Materials and Methods
2.1 Synthesis of Particles
FL particles were synthesised using an emulsion polymerisation based on a receipt detailed by Zupkauskas et al. [42]: 2 mg sodium dodecyl sulphate (SDS; purchased from Sigma-Aldrich and used without further purification) was dissolved in 12 ml of deionised (di-)water. Next, 325 mg of 2,2,3,3,4,4,4-Heptafluorobutyl methacrylate monomer (HFBMA; obtained from Alfa Aesar and used without further purification) was added and emulsified at 70°C under nitrogen atmosphere while stirring at 600 rpm for 1 h. A solution of potassium persulfate (KPS; purchased from Sigma-Aldrich and used without further purification; 7.75 mg dissolved in 500 μL deionised water) was injected into the mixture while stirring at reduced speed. The reaction continued for 18 h at 70°C. The synthesised particles were purified by dialysis and then stored in a refrigerator. Negatively charged polystyrene (PS) particles used here were obtained from Cambridge Bespoke Colloids LLC.
2.2 Scanning and Transmission Electron Microscopy Imaging
The FL particles were imaged using a Zeiss scanning electron microscope (SIGMA VP field emission SEM), while the PS particles were imaged with a transmission electron microscope (TEM, TECNAI 20 from FEI). Size analysis based on the SEM measurements was carried out using ImageJ software by calculating the diameter of 100 particles.
2.3 DLS and Zeta Potential Measurements
We used a Malvern ZetaSizer Nano ZSP to measure the particle size and size-distribution. In order to determine the Zeta potential, we dispersed the particles in 10 mM phosphate buffer, while all other results were obtained from suspensions in deionized water.
2.4 Transmission Measurements
The transmission measurements were taken using a Cary UV-Vis spectrometer. A cuvette whose path length is 1 cm was filled with the sample and in-line transmission results were recorded starting with the sample of 40% concentration. Measurements at lower concentrations were taken by diluting the sample.
2.5 Reflectivity Measurements
The reflectivity measurements were taken using a reflection-probe bundle equipped with different LED light sources and a spectrometer. Illumination and collection were done at normal angle. The green and red samples were illuminated with a fibre-coupled white LED (Thorlabs MCWHF2) and the blue sample was illuminated with a cyan LED emitting at 490 nm (Thorlabs M490F3). The samples were illuminated by using a collimator to provide unidirectional lighting. The spectra were measured using a Thorlabs CCS 100 spectrometer. Reference measurements were taken using a Thorlabs BB1-E02 dielectric mirror. The angle-dependent scattering measurements were taken by illuminating the samples at normal angle and changing the angle of the optical fiber collecting the reflection.
2.6 Small-Angle X-Ray Scattering Measurements
SAXS measurements were carried out at the ID02 beamline of the European Synchrotron Radiation Facility (ESRF) in Grenoble, France [43] and at the B21 beamline of the Diamond Light Source, United Kingdom. The 2D spectra measured at the ESRF were obtained using X-rays with a wavelength of 0.1 nm and a beam size of 50 μm by 50 μm on the sample. The sample to detector distance was 10 m and the camera used was a Rayonix MX170 detector. The setup at Diamond used the same wavelength X-rays but a beam size of 1 mm by 1 mm, a sample to detector distance of 4 m and a Pilatus 300 K detector. The scattering vector was set to a range of q = 0.0032 to 0.38 Å-1. All spectra were background corrected and normalized to the intensity of the transmitted primary beam. The scattering of the empty cell was subtracted. Flat, 1 mm-wide capillaries with a thickness of 200 nm were employed for the measurements. All of the samples were placed such that the beam hits the sample at normal angle.
2.7 Electromagnetic Simulations
Electromagnetic simulations were carried out using a commercially available finite-difference time-domain simulator in three dimensions (Lumerical Inc., FDTD). Here, latex particles were modelled as dielectric spheres with a refractive index of 1.37 while the background index was set to 1.33 to mimic the water. The colloidal lattice constant was varied between 300 and 450 nm in 25 nm intervals. The structure was illuminated at normal angle by a broadband plane-wave source. Bloch-boundary conditions were applied at the x- and y-boundaries of the simulation region while the z-boundary was set as a perfectly matched layer. The effect of the refractive index was tested by changing the refractive index of the particles in the photonic crystals between 1.33 and 1.54.
3 Results
3.1 Particle Synthesis and Characterisation
The FL particles were synthesised using an emulsion polymerisation technique reported previously [43]. Our FL particles have a refractive index of 1.37 [44], which is very close to the refractive index of water (1.33 at 20°C). We measured a zeta potential of (-82 ± 4) mV and an average hydrodynamic diameter of 196 nm with a polydispersity index of 1.6% (Figures 1A,B). Note that SEM images of the dried colloidal samples suggested an average particle size of (160±25) nm (inset in Figure 1A). In Figures 1C,D, we present the characterisation of the PS particles used: Their Zeta potential was (-30 ± 4) mV and their hydrodynamic diameter, determined in DLS measurements of highly dilute samples, was 220 nm with a polydispersity index of 1.4%. TEM images give a dry particle size of (190 ± 5) nm. These PS particles were synthesised by Cambridge Bespoke Colloids LLC using KPS as initiator and were surfactant free.
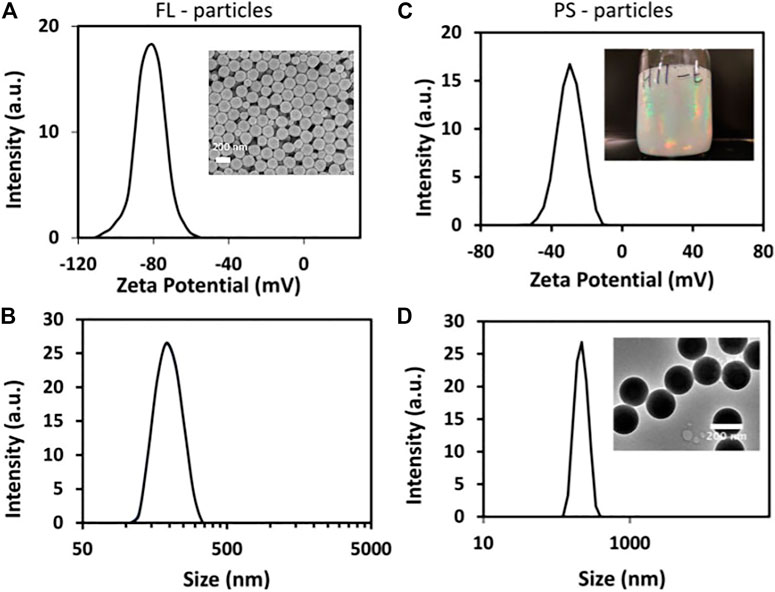
FIGURE 1. (A) Zeta-potential measurement of the synthesised FL particles suspended in 10 mM phosphate buffer. The inset shows an SEM image of the dried particles. (B) Size distribution of the FL particles measured using DLS. (C) Zeta-potential measurement of the PS particles suspended in 10 mM phosphate buffer. The inset shows a photograph of these PS particles after synthesis and washing. The particle content is roughly 2%, but the strongly scattering dispersion still shows iridescent colours. (D) Size distribution of the PS particles measured using DLS. The inset shows a TEM micrograph of the dried PS particles.
3.2 Reflectivity and Transmission of FL and FL + PS Suspensions
Both dilute aqueous suspensions of FL and PS particles appear white, with the dilute solutions of PS particles (2% v/v) showing some iridescent colour when left at rest (see inset in Figure 1C). Figures 2A,B show that upon concentrating the solutions by centrifugation, the FL suspensions became significantly more transparent and strongly coloured throughout, while both pure PS and mixed PS + FL suspensions remained predominantly white and opaque, showing intense colours only within a relatively narrow window of angles, which were due to Bragg reflection. The concentration process via centrifugation was fully reversible. For better visualisation and for the SAXS measurements shown later, we filled the concentrated samples into flat glass capillaries (25 × 4 × 0.2 mm) that were subsequently sealed with a two-component epoxy glue. In Figure 2A the images of FL samples display a strong blue reflection at 40% (v/v), green at volume fractions of around 26–33% (v/v) and red for 20–23% (v/v). Their spectra showed that the transmission decreased with decreasing concentration in the range of 40–20% (v/v) (Figure 2B). Below around 15% (v/v), the FL samples turned into whitish suspensions again with very little transmission in the visible. For comparison, the aqueous PS suspensions with a refractive index difference Δnw-PS ≈ 0.23 remained predominantly opaque at concentrations between 2% and 40%. In fact, for PS volume fractions of 26% and higher the transmission dropped almost to zero in the visible range. Spectra of the 1:1 FL + PS particles mixtures in Figure 2B showed slightly enhanced transmission with respect to the pure PS suspensions but remained opaque. Despite the opaqueness of the PS and the PS + FL suspensions they displayed strong Bragg reflections within a very narrow angular range (not shown here).
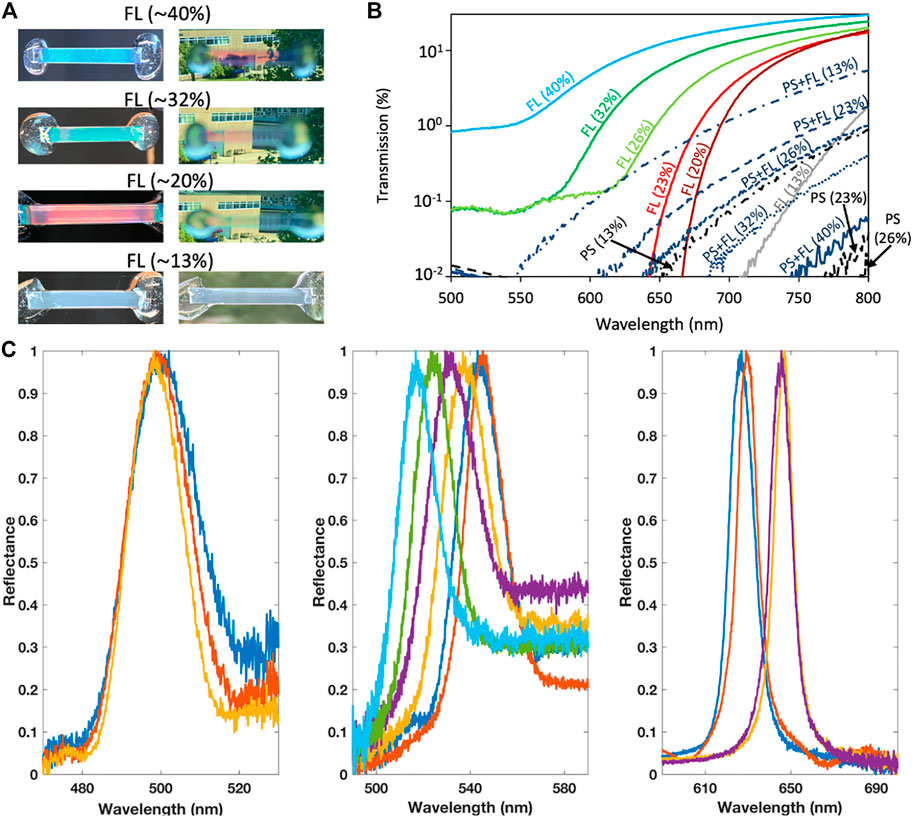
FIGURE 2. (A) Photographs of flat cuvettes containing aqueous suspensions of about 196 nm large FL particles at different concentrations, taken in reflection (right) and transmission (left). (B) Transmission spectra measured using a UV-Vis spectrometer over a path length of 1 cm containing different volume fractions of FL, FL + PS and only PS particles. The numbers in parentheses indicate the v/v concentration of colloids. (C) Normalized reflectivity measured at different positions in the (left) blue (middle) green and (right) red sample of the FL suspensions shown in (A). The reflection peaks of the blue sample occur around 495–500 nm, those of the green sample vary between 510 and 560 nm, and the red sample has various reflection peaks located between 615 and 650 nm.
3.3 Small-Angle X-Ray Scattering
Following the reflectivity measurements indicating that the charge-stabilised FL and PS + FL colloidal suspensions form ordered structures, we performed SAXS measurements at the ID02 beamline at the ESRF. In Figure 3 we present the two-dimensional SAXS patterns and their corresponding structure factors, S(q), for FL and PS + FL particle suspensions with a volume fraction of ∼ 30% (v/v); the PS + FL samples were prepared with a 1:1 volume-fraction ratio to obtain an AB-type crystal. The S(q) curves were obtained by azimuthally integrating the two-dimensional scattering intensities, I(q), and dividing these with their form factor, F(q). Latter was obtained form scattering images taken for FL suspensions with a volume fraction of 0.1%. The indexing of the diffraction peaks in Figures 3B,C reveal that the FL particles packed in a face centred cubic (FCC) symmetry, while the 1:1 FL + PS suspension has a CsCl-like crystal.
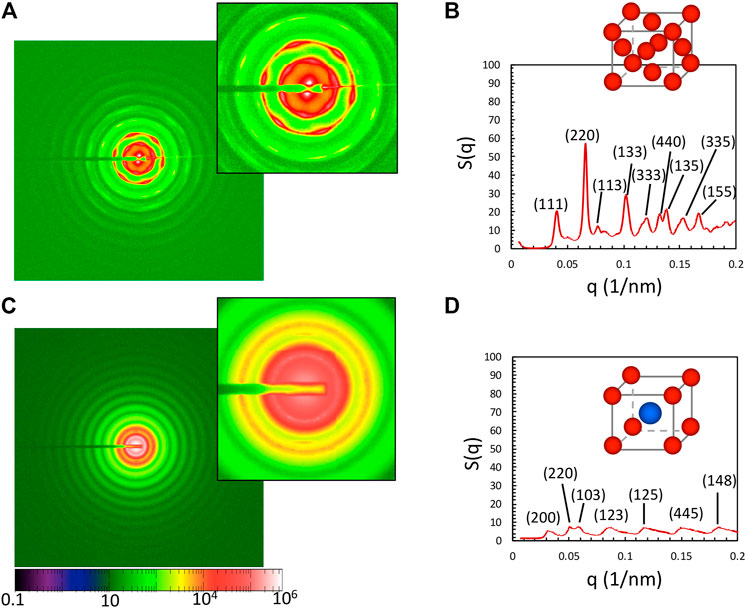
FIGURE 3. (A) SAXS spectrum taken of a 30% FL particle suspension. (B) Azimuthally integrated structure factor of this sample, after dividing by the form factor as measured in a 0.1% suspension. The peaks are assigned to the corresponding Miller indices (hkl). (C) Corresponding SAXS and (D) integrated spectrum of the 1:1 mixture made of FL and PS particles.
3.4 Simulated Reflection Spectra
Based on the SAXS measurement results, we carried out electromagnetic simulations to show that changing the lattice parameter of the FCC crystal sets the reflection colour observed. For this purpose, we formed FCC lattices of dielectric spheres having a refractive index of 1.37, mimicking the FL colloids. The simulations were done for various diameters of the particles and for various lattice parameters. Our simulations prove that despite the low refractive index contrast between the medium and the colloids, this system can still reflect the incoming radiation at a certain range of wavelengths, which is determined by the lattice constant (Figure 4). We observed that with increasing lattice constant there is a clear red-shift in the reflection peaks. Increasing the particle diameter also caused a slight red-shift in the reflection spectra which is a direct consequence of the Bragg condition. These results indicate that in our samples there are crystal grains with varying lattice parameters that leads to slightly different reflection peak wavelengths. Furthermore, different lattice parameters together with different grain sizes in the sample contribute to different absolute reflectance levels (Supplementary Figure S6). We also show that the whole visible regime can be covered using our colloids, which further proves the feasibility of using our materials in colour filters, reflectors, and optical coatings [45]. We have also analysed the effect of the particle refractive index on the reflection levels for perfect photonic crystals (Supplementary Figure S7). We see that the reflection becomes stronger with increasing refractive index contrast, which explains the difference of the transmission levels in FL and PS samples.
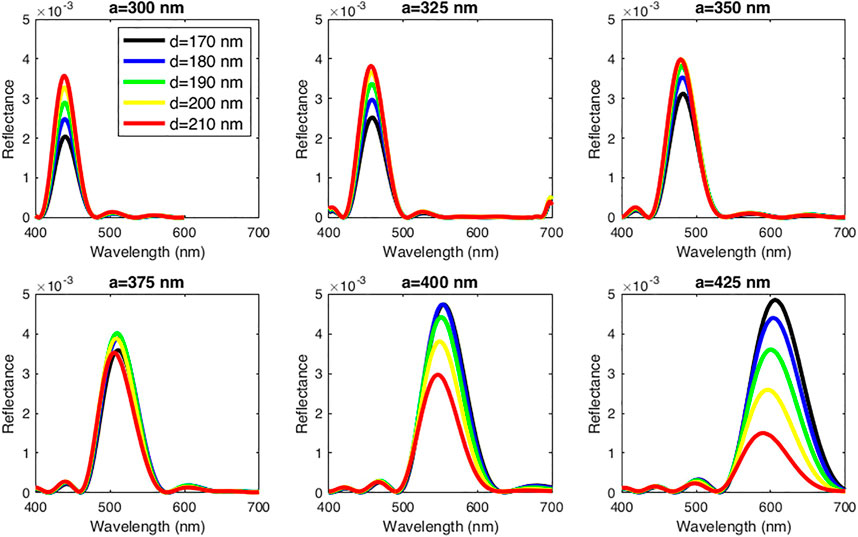
FIGURE 4. Simulated reflection spectra assuming an FCC crystal with different lattice constants a and particle diameters d.
4 Discussion
4.1 Particle Synthesis and Characterisation
Already early on, the synthesis of fluorinated colloids [46] was pursued in order to investigate the physics of dense colloidal solutions. The fluorination of the starting monomers provided the low refractive index of the colloids needed to match or be close to that of water. The group of Asher [45] refined the synthesis of these fluorinated latex particles using emulsion polymerization of 1H,1H-heptafluorobutyl methacrylate monomers to obtain highly charged, monodisperse colloids ranging in size from 50 to 250 nm. While using the same starting monomer as Pan et al. [45], we employed KPS as initiator and the surfactant SDS to control the particle size. This simple synthesis allowed us to use the FL colloids directly after washing with di-water. They showed consistent Zeta potentials around −82 mV and DLS measurements provided a single, average hydrodynamic diameter of 196 nm with a polydispersity index of 1.6% (Figures 1A,B). However, SEM images suggested that our synthesis produced a bimodal size distribution. Performing SAXS measurements on dilute suspensions of our FL particles provided us with the form factor (see Supplementary Figures S1, S2), which indeed revealed a bimodal distribution: 70% of the signal accounted for FL particles with a diameter of 183 nm while the remaining particles showed a rather narrow size distribution around 134 nm. The low fraction of the smaller colloids does not show up in the DLS measurements because of its relative lower intensity, thus falling inside the tail of the scattering intensity due to the larger particles. This bimodal size distribution had little effect on the overall crystallinity of the sample as will be discussed in the upcoming sections. At this point it needs to be stressed that the timing of the emulsification process in nitrogen atmosphere is important. If the nitrogen purging continued for too long before the polymerization starts, more monomer evaporated leading to smaller particles, and if the purging time was too short, larger particles formed. In both cases, the polydispersity was affected as well.
In Figures 1C,D we show that the PS particles had also a negative Zeta potential (-30 mV) and their average hydrodynamic diameter was 220 nm with a polydispersity index 1.4%. TEM images gave a dry particle size of (190 ± 5) nm suggesting that the PS particles “shrink” less strongly than the FL ones when dried. Hence in aqueous solution, the two average particle sizes were similar but still differed by more than 10%.
4.2 Reflectivity and Transmission of FL and FL + PS Suspensions
Ashers’ group [45] developed transparent near-UV notch filters with a narrow extinction band by embedding their 82 nm large FL particles in a photo-polymerised matrix. They obtained a diffraction peak at 436 nm for a colloidal volume fraction of 3.6%. The diffraction peak blue-shifted to 270 nm when the samples were concentrated to 17.8% accompanied by an increase in the transmission. Our data presented here for aqueous suspensions of ∼196 nm large FL particles shows the same trend in the transmission data upon concentration (Figure 2): First, the 40%, 32% and the 26% FL samples showed transparency for wavelengths between 500 and 800 nm, with the most concentrated sample showing the highest transparency at all wavelengths. Second, samples with smaller colloidal volume fractions became completely non-transparent for the lower wavelengths.
As Ashers’ group demonstrated [45] the transparency of a dielectric background decreases as more and more colloids are added, due to the increased scattering. However, when even higher colloidal volume fractions are reached, the average refractive index of the system also increases. In this case, the opposite, namely an increasing transparency, is to be expected owing to the ordering of the particles as discussed earlier [47–49], which is in agreement with our observations. Further, while Pan et al. [45] observed colloidal crystallinity even at volume fractions as low as 3.6% our samples turned turbid. This suggest that although our FL particles form highly charged colloidal Wigner crystals at larger ϕ, their Debye screening length was not long enough to maintain the crystallinity when diluted. Instead, the thermal motion of the FL particles lead to random motion and thus diffuse scattering, which we observe.
What further sets our system apart from a large volume of research and development of large scale colloidal crystals for optical applications is the fact that our FL suspensions show a relatively angle-independent colouring in addition to the sharp Bragg reflection that only occurs for specific angles. Even when placed in conic pipette tips, the FL samples display structural colour over a broad range of angles (Supplementary Figure S4). The sharp Bragg reflections simply stem from the preferred ordering of spherical colloids near flat surfaces leading to several, hexagonally densely packed layers that form an FCC crystal. However, this packing usually does not reach deep into the colloidal bulk solution, which is why most PS or silica bead suspensions appear whitish. The colour we observed by eye in reflection varied only slightly in wavelength (see Figure 2C; SupplementaryTable S1), depending on the position measured in the sample. Such a weak dependence of the peak reflection wavelengths on position suggests the existence of multiple crystalline domains having similar but slightly different lattice constants, most likely originating from fractionation due to small variations in the surface charge from colloid to colloid and the bimodal size distribution of our FL particles.
As shown in Supplementary Figure S4, the samples preserve their structural colour in pipette tips indicating that the samples scatter the light at a broad range of angles while preserving the colour. We quantitatively analysed this with the samples placed in rectangular capillary tubes by illuminating them at normal angle and collecting the light at various angles (Supplementary Figure S4C). The results show that there is a very strong reflection at normal angle whereas at other angles the light is also strongly scattered leading to the perception of the sample’s intense colour at a broad range of angles. The presence of multiple crystal domains of similar lattice parameter but different orientation allows for the scattering to be observed at different angles. Nevertheless, the presence of multiple large crystal domains is expected to increase the light scattering that would cause the sample to appear whitish at off-angles. This can be avoided if the refractive index difference between the colloids and the background solvent is very small, which is the case here (Δnw-FL ≈ 0.04 as opposed to Δnw-PS ≈ 0.23).
In our initial attempts, we also obtained non-iridescent colours for suspensions of FL particles that are 150 nm or 250 nm in diameter (data not shown here). Their scattered colours were blue- or red-shifted, respectively, relative to the 196 nm case, as expected. However, the strength of the reflected colours was most pronounced for the 190–200 nm large particles. Our experimental observation was supported by the simulated reflection data shown in Figure 4. These show that the intensity of the reflected light is strongest for a lattice spacing that is about twice the particle size, which is for the concentrations we used at around 180–210 nm. Additionally, suspensions with the smaller sized FL particles showed even higher transparency, as the scattering strength of the particles decreases with their size.
Finally, we were also able to prepare quasi ‘inverted opal’ structures by increasing the refractive index of the continuous phase to 1.4 by saturating it with sucrose. These structures displayed similar characteristics of enhanced transparency and isotropic structural colour (see Supplementary Figure S5). Unusually, these samples were less likely to show additional sharp Bragg peaks to the bare eye. One possible reason for this weaker crystallinity in the high sucrose solution is the possibility that the Zeta potential and thus the Debye screening length is reduced allowing for the thermal motion to introduce more disorder. Indeed, SAXS measurements revealed a predominantly liquid-like structure (Figure 5). This suggests also that there may be small crystallites forming near the flat container walls while the bulk sample is in a more glassy state. For comparison, below we also present separate spectra from FL and PS particles in deionized water (Figure 6), which generally show more crystallinity.
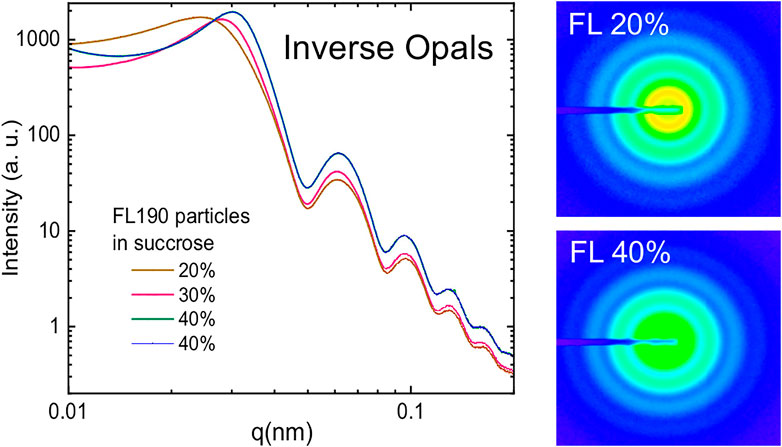
FIGURE 5. SAXS measurements of the inverse opals taken for 3 different volume fractions. The spectra were obtained by radially integrating the 2D-spectra, shown for a 20% and 40% FL sample in aqueous sucrose solution with a refractive index n =1.4. The two spectra for 40% were taken from the sample capillary shown in the Supplementary Figure S5, but measured in different spots.
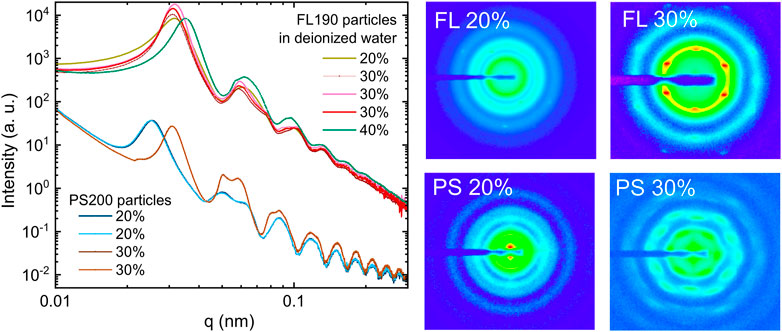
FIGURE 6. Two dimensional SAXS spectra and the corresponding, radially integrated scattering intensities for different volume fractions of FL190 particles and for PS200 particles in deionized water.
4.3 Small-Angle X-Ray Scattering
4.3.1 One-Component Colloidal Crystals
As expected, the 30% FL suspension displayed numerous Bragg peaks, arising from the scattering planes of an FCC lattice: the azimuthally integrated two-dimensional SAXS spectrum in Figure 3B reveals a first peak at q0 = 0.0403 nm−1. From this, we compute the lattice parameter to be 270 nm and the nearest-neighbour separation to be 195 nm. This correlates with our hypothesis that the suspension forms a Wigner crystal, as the particle hydrodynamic diameter is only 196 nm. The strong hexagonal symmetry of the peaks stems from the alignment of the close-packed (111) planes to the flat top wall of the capillary. While well-defined Bragg peaks normally imply the presence of a single crystal, closer inspection of the 2D spectrum and its radially integrated scattering intensity reveals three additional characteristics. First, the Bragg peaks are slightly blurred radially, which indicates a slight spread of the rotational orientation of the (111) planes with respect to the confining walls. It would be surprising to have a single crystal in the sample considering the sample thickness was 200 μm and the beam size is 150×150 μm. In fact, using the Scherrer Equation we found that the crystal domains have a typical size of ca. 5.6 μm. Similar scattering patterns were obtained when the measurements were taken at different positions along the same sample capillary.
Second, there are also faint hexagonal scattering patterns like rotated shadows of the strong peaks but at slightly higher q values. This may be due to the formation of secondary crystalline domains with slightly smaller lattice spacing. The difference in lattice spacing can be understood in terms of the bimodal size distribution across all FL colloids, leading to local fractionation. Although it is known that FCC crystals of hard spheres never form in suspensions with a size distribution larger than 6%, it will have minimal effect on the formation of a Wigner crystal [17,50]. Since the colloids in a Wigner crystal are not in hard contact, the suspensions are able to rearrange, allowing for the coarsening of individual crystalline domains and both size and charge fractionation of colloids.
Further, we initially estimated the sample volume fraction to be roughly 30% (v/v), but from the lattice parameter of 270 nm, we calculate a particle concentration of 50% v/v and a gap of 30 nm between adjacent particles. We attribute this difference to the error in measured colloidal diameter and the method used to determine suspension concentrations, which relies on dry mass weighing and the assumption that the colloidal density is the same as the monomer. Interestingly, the integrated spectra show many weaker peaks which could not be assigned to a FCC but a BCC structure with Bragg peak positions at q = 0.049, 0.083, and 0.117 nm−1 corresponding to the (200), (222), and (224) planes, respectively, and a lattice constant of 260 nm. This is very similar to the situation observed by Sirota et al. [36], who measured a coexistence between FCC and BCC crystals. This coexistence of different crystal structures and lattice variation within the same sample that must be due to size or charge polydispersity in combination with a small refractive index variation may explain the observed iridescent colours at specific angles, the angle-independent structural colour overall and the significant transparency. To prove the generality of our observations we performed additional SAXS measurements on a different batch of FL particles with a hydrodynamic radius of 190 nm, denoted as FL190, and on PS200 nm particles. Both were dispersed in deionized water with volume fractions of 20% and 30%. The measured spectra, shown in Figure 6, all display FCC symmetry.
Indeed, Sirota et al. [36] performed systematic SAXS measurements of charged PS-particle suspensions, establishing a phase diagram by plotting the measured structure as a function of the ionic strength in the sample. At very low ionic strengths, they observe a first transition from a liquid, disordered phase to a BCC crystal followed by a coexistence region between BCC and FCC structure as the colloid volume fraction is increased from
4.3.2 Binary Colloidal Crystals
The integrated SAXS intensities measured for the 30% FL + PS suspensions with 1:1 ratio also showed many scattering peaks but appear initially to indicate a predominantly liquid structure (Figures 3C,D). Macroscopically, these AB-type colloidal mixtures look white, but on closer inspection we observe iridescence under certain angles in reflection, which can only arise from local order. Indeed, when zooming into the 2D scattering image, we observe small but clear Bragg peaks (Figure 3D). After dividing out the form factor (here using F(q) measured for the FL particles) we assigned the Miller indices (hkl) to the peaks in the resulting S(q), using again the fact that scattering vectors are related to the lattice parameter a via
As discussed above, we considered AB crystals to possibly enhance the overall reflectivity of the system by exploiting the much stronger scattering PS particles. However, the AB samples appeared completely white in reflection except for specific Bragg angles. To lower the effect of the strong PS scattering we also examined A2B, AB2, A13B and AB13 suspensions in deionized water, with A being the FL190 and B the PS200 particles. Their two-dimensional and integrated spectra are shown in Figure 7. While they all appeared mostly white as well, it was remarkable that the samples containing the higher fraction of FL190 particles showed systematically significantly higher degrees of order superposed on a diffuse, liquid-like background. Here we did not attempt to index the numerous peaks for the A2B sample, but leave it to further studies.
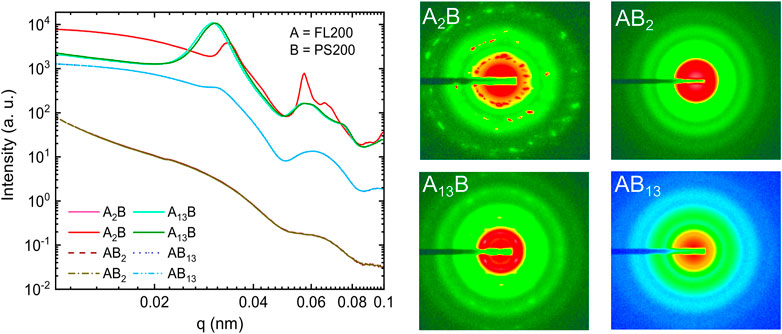
FIGURE 7. SAXS measurements of mixed FL190 and PS200 in deionized water with a total volume fraction of about 30%. All four samples were measured in two different places, reflected by the two different lines for each mixture. They are almost identical and fall on top of each other. The intensities were corrected for background but the Form Factor was not divided out.
5 Conclusion
We show that charged, fluorinated particle suspensions form regular Wigner crystals in the volume fraction range of 13% to about 40%. In this concentration range the suspensions show strong, almost angle-independent colours in reflection, that could be tuned continuously in the visible spectrum. We argue that the angle-independence of the colours seen is due to the presence of multiple crystal domains having different orientations. Since the low refractive-index contrast partly weakened the scattering from the crystal defects, the crystallinity and the low refractive index contrast together contributed to the samples being partially transparent. In addition these samples showed brilliant Bragg peaks, underlying the strong crystallinity near the container walls. Below 13% the FL suspensions became turbid and non-transparent, when the Debye screening length became shorter than the inter-particle distance and thus thermal motion causing colloidal disorder. Interestingly, mixing similarly sized and equally charged PS particles with the FL particles to form AB, A2B, AB2, A13B and AB13 type crystals we obtain only opaque samples that, nevertheless, showed Bragg reflections at specific angles. Interestingly, the binary mixtures containing a higher fraction of FL particles showed a greater degree of order. By playing with the surface charges and sizes of the colloids can obtain more complex structures than simple FFC symmetry. We conclude that such systems could be ideal for the development of filters with robust structure.
Permission to Reuse and Copyright
Figures, tables, and images will be published under a Creative Commons CC-BY licence and permission must be obtained for use of copyrighted material from other sources (including re-published/adapted/modified/partial figures and images from the internet).
Data Availability Statement
The original contributions presented in the study are included in the article/Supplementary Material, further inquiries can be directed to the corresponding authors.
Author Contributions
TE, TO’N, EE have led the study together, organised the experiments, conducted them, and wrote the manuscript. They contributed equally. MZ and YL optimised the synthesis procedure of the colloids, AC carried out the theoretical analyses together with TE, TO’N, PX, and PB conducted the SAXS measurements and helped the data analyses.
Funding
TE is grateful to the Royal Society for supporting his Newton International Fellowship (NF160409). MZ thanks the Engineering and Physical Science Research Council (EPSRC) and Unilever for the CASE award RG748000. TO’N acknowledges EPSRC NanoDTC Cambridge EP/L015978/1. AC and EE acknowledge the ETN-COLLDENSE (H2020-MCSA-ITN-2014, Grant No. 642774) and the Winton Program for the Physics of Sustainability. EE was partly supported by the Research Council of Norway through its Centers of Excellence funding scheme, project number 262644.
Conflict of Interest
The authors declare that the research was conducted in the absence of any commercial or financial relationships that could be construed as a potential conflict of interest.
Publisher’s Note
All claims expressed in this article are solely those of the authors and do not necessarily represent those of their affiliated organizations, or those of the publisher, the editors and the reviewers. Any product that may be evaluated in this article, or claim that may be made by its manufacturer, is not guaranteed or endorsed by the publisher.
Acknowledgments
We thank Katsuaki Inoue and Robert Rambo for their assistance at the Diamond B21 beamline.
Supplementary Material
The Supplementary Material for this article can be found online at: https://www.frontiersin.org/articles/10.3389/fphy.2022.847142/full#supplementary-material
References
1. Cosgrove T. Colloid Science: Principles, Methods and Applications. Hoboken, NJ, USA: Wiley (2005). doi:10.1002/9781444305395
2. Ryan JN, Elimelech M. Colloid Mobilization and Transport in Groundwater. Colloids Surf A: Physicochemical Eng Aspects (1996) 107:1–56. doi:10.1016/0927-7757(95)03384-X
3. Jamieson T, Bakhshi R, Petrova D, Pocock R, Imani M, Seifalian AM. Biological Applications of Quantum Dots. Biomaterials (2007) 28:4717–32. doi:10.1016/j.biomaterials.2007.07.014
4. Henglein A. Electronics of Colloidal Nanometer Particles. Berichte der Bunsengesellschaft für physikalische Chem (1995) 99:903–13. doi:10.1002/bbpc.199500003
5. Zhang J, Sun Z, Yang B. Self-assembly of Photonic Crystals from Polymer Colloids. Curr Opin Colloid Interf Sci (2009) 14:103–14. doi:10.1016/j.cocis.2008.09.001
6. Magkiriadou S, Park J-G, Kim Y-S, Manoharan VN. Disordered Packings of Core-Shell Particles with Angle-independent Structural Colors. Opt Mater Express (2012) 2:1343–52. doi:10.1364/OME.2.001343
7. Lee HS, Shim TS, Hwang H, Yang S-M, Kim S-H. Colloidal Photonic Crystals toward Structural Color Palettes for Security Materials. Chem Mater (2013) 25:2684–90. doi:10.1021/cm4012603
8. Lai C-F, Wang Y-C, Hsu H-C. High Transparency in the Structural Color Resin Films through Quasi-Amorphous Arrays of Colloidal Silica Nanospheres. J Mater Chem C (2016) 4:398–406. doi:10.1039/c5tc03063c
9. Kim S-H, Lee SY, Yang S-M, Yi G-R. Self-assembled Colloidal Structures for Photonics. NPG Asia Mater (2011) 3:25–33. doi:10.1038/asiamat.2010.192
10. Li B, Zhou D, Han Y. Assembly and Phase Transitions of Colloidal Crystals. Nat Rev Mater (2016) 1:1–13. doi:10.1038/natrevmats.2015.11
11. Yu K, Fan T, Lou S, Zhang D. Biomimetic Optical Materials: Integration of Nature's Design for Manipulation of Light. Prog Mater Sci (2013) 58:825–73. doi:10.1016/j.pmatsci.2013.03.003
12. Chung W-J, Oh J-W, Kwak K, Lee BY, Meyer J, Wang E, et al. Biomimetic Self-Templating Supramolecular Structures. Nature (2011) 478:364–8. doi:10.1038/nature10513
13. Liu Y, Li G. A New Method for Producing "Lotus Effect" on a Biomimetic Shark Skin. J Colloid Interf Sci (2012) 388:235–42. doi:10.1016/j.jcis.2012.08.033
14. Guo Z, Liu W, Su B-L. Superhydrophobic Surfaces: From Natural to Biomimetic to Functional. J Colloid Interf Sci (2011) 353:335–55. doi:10.1016/j.jcis.2010.08.047
15. Colvin VL. From Opals to Optics: Colloidal Photonic Crystals. MRS Bull (2001) 26:637–41. doi:10.1557/mrs2001.159
16. Larsen AE, Grier DG. Like-charge Attractions in Metastable Colloidal Crystallites. Nature (1997) 385:230–3. doi:10.1038/385230a0
18. Wang H, Zhang K-Q. Photonic crystal Structures with Tunable Structure Color as Colorimetric Sensors. Sensors (2013) 13:4192–213. doi:10.3390/s130404192
19. Diana FS, David A, Meinel I, Sharma R, Weisbuch C, Nakamura S, et al. Photonic crystal-assisted Light Extraction from a Colloidal Quantum Dot/GaN Hybrid Structure. Nano Lett (2006) 6:1116–20. doi:10.1021/nl060535b
20. Furumi S, Fudouzi H, Sawada T. Self-organized Colloidal Crystals for Photonics and Laser Applications. Laser Photon Rev (2010) 4:205–20. doi:10.1002/lpor.200910005
21. Murray CB, Kagan CR, Bawendi MG. Self-organization of CdSe Nanocrystallites into Three-Dimensional Quantum Dot Superlattices. Science (1995) 270:1335–8. doi:10.1126/science.270.5240.1335
22. Abramson J, Palma M, Wind SJ, Hone J. Quantum Dot Nanoarrays: Self-Assembly with Single-Particle Control and Resolution. Adv Mater (2012) 24:2207–11. doi:10.1002/adma.201104216
23. Kim H, Ge J, Kim J, Choi S-e., Lee H, Lee H, et al. Structural Colour Printing Using a Magnetically Tunable and Lithographically Fixable Photonic crystal. Nat Photon (2009) 3:534–40. doi:10.1038/nphoton.2009.141
24. Ge J, Hu Y, Yin Y. Highly Tunable Superparamagnetic Colloidal Photonic Crystals. Angew Chem Int Ed (2007) 46:7428–31. doi:10.1002/anie.200701992
26. Chayen NE, Saridakis E. Protein Crystallization: From Purified Protein to Diffraction-Quality crystal. Nat Methods (2008) 5:147–53. doi:10.1038/nmeth.f.203
27. Lang PR, Vlassopoulos D, Richtering W. Polymer/Colloid Interactions and Soft Polymer Colloids. Polym Sci A Compr Reference, 10 Volume Set (2012) 1:315–38. doi:10.1016/B978-0-444-53349-4.00007-8
28. Lekkerkerker HNW, Poon WC-K, Pusey PN, Stroobants A, Warren PB. Phase Behaviour of Colloid + Polymer Mixtures. Europhys Lett (1992) 20:559–64. doi:10.1209/0295-5075/20/6/015
29. Poon WCK. The Physics of a Model Colloid Polymer Mixture. J Phys Condens Matter (2002) 14:R859–R880. doi:10.1088/0953-8984/14/33/201
30. He L, Malik V, Wang M, Hu Y, Anson FE, Yin Y. Self-assembly and Magnetically Induced Phase Transition of Three-Dimensional Colloidal Photonic Crystals. Nanoscale (2012) 4:4438–42. doi:10.1039/C2NR31068F
31. Alder BJ, Wainwright TE. Phase Transition for a Hard Sphere System. J Chem Phys (1957) 27:1208–9. doi:10.1063/1.1743957
32. Pusey PN, Van Megen W. Phase Behaviour of Concentrated Suspensions of Nearly Hard Colloidal Spheres. Nature (1986) 320:340–2. doi:10.1038/320340a0
33. Manoharan VN. Colloidal Matter: Packing, Geometry, and Entropy. Science (2015) 349:1253751. doi:10.1126/science.1253751
34. Yethiraj A, Van Blaaderen A. A Colloidal Model System with an Interaction Tunable from Hard Sphere to Soft and Dipolar. Nature (2003) 421:513–7. doi:10.1038/nature01328
35. Gottwald D, Likos CN, Kahl G, Löwen H. Phase Behavior of Ionic Microgels. Phys Rev Lett (2004) 92:068301. doi:10.1103/PhysRevLett.92.068301
36. Sirota EB, Ou-Yang HD, Sinha SK, Chaikin PM, Axe JD, Fujii Y. Complete Phase Diagram of a Charged Colloidal System: A Synchro- Tron X-ray Scattering Study. Phys Rev Lett (1989) 62:1524–7. doi:10.1103/PhysRevLett.62.1524
37. Heyes DM, Brańka AC. Interactions between Microgel Particles. Soft Matter (2009) 5:2681. doi:10.1039/b901894h
38. Ngo TT, Liddell CM, Ghebrebrhan M, Joannopoulos JD. Tetrastack: Colloidal diamond-inspired Structure with Omnidirectional Photonic Band gap for Low Refractive index Contrast. Appl Phys Lett (2006) 88:241920–4. doi:10.1063/1.2206111
39. Tarhan İİ, Watson GH. Photonic Band Structure of Fcc Colloidal Crystals. Phys Rev Lett (1996) 76:315–8. doi:10.1103/PhysRevLett.76.315
40. Finlayson CE, Haines AI, Snoswell DRE, Kontogeorgos A, Vignolini S, Baumberg JJ, et al. Interplay of index Contrast with Periodicity in Polymer Photonic Crystals. Appl Phys Lett (2011) 99:261913–4. doi:10.1063/1.3672215
41. Lai C-F, Hsieh C-L, Wu C-J. Light-spectrum Modification of Warm white-light-emitting Diodes with 3D Colloidal Photonic Crystals to Approximate Candlelight. Opt Lett (2013) 38:3612–5. doi:10.1364/OL.38.003612
42. Zupkauskas M, Lan Y, Joshi D, Ruff Z, Eiser E. Optically Transparent Dense Colloidal Gels. Chem Sci (2017) 8:5559–66. doi:10.1039/C7SC00901A
43. Urban V, Panine P, Ponchut C, Boesecke P, Narayanan T. Two-dimensional Camera for Millisecond Range Time-Resolved Small- and Wide-Angle X-ray Scattering. J Appl Cryst (2003) 36:809–11. doi:10.1107/S0021889803000554
44. Cheng X, Chen Z, Shi T, Wang H. Synthesis and Characterization of Core-Shell LIPN-Fluorine-Containing Polyacrylate Latex. Colloids Surf A: Physicochemical Eng Aspects (2007) 292:119–24. doi:10.1016/j.colsurfa.2006.06.006
45. Pan G, Tse AS, Kesavamoorthy R, Asher SA. Synthesis of Highly Fluorinated Monodisperse Colloids for Low Refractive index Crystalline Colloidal Arrays. J Am Chem Soc (1998) 120:6518–24. doi:10.1021/ja9804823
46. Codding DW, Reid TS, Ahlbrecht AH, Smith GH, Husted DR. Fluorine-containing Polymers. II. 1, 1-dihydroperfluoroalkyl Acrylates: Preparation of Monomers1. J Polym Sci (1955) 15:515–9. doi:10.1002/pol.1955.120158018
47. Garnett JM. Xii. Colours in Metal Glasses and in Metallic Films. Philosophical Trans R Soc Lond Ser A, Containing Pap a Math or Phys Character (1904) 203:385–420.
48. Sheng P. Theory for the Dielectric Function of Granular Composite media. Phys Rev Lett (1980) 45:60–3. doi:10.1103/physrevlett.45.60
49. Wiederseiner S, Andreini N, Epely-Chauvin G, Ancey C. Refractive-index and Density Matching in Concentrated Particle Suspensions: a Review. Exp Fluids (2011) 50:1183–206. doi:10.1007/s00348-010-0996-8
Keywords: colloid, structural color, SAXS (small-angle X-ray scattering), latex particle, photonic crystals
Citation: Erdem T, O’Neill T, Zupkauskas M, Caciagli A, Xu P, Lan Y, Bösecke P and Eiser E (2022) Transparent Colloidal Crystals With Structural Colours. Front. Phys. 10:847142. doi: 10.3389/fphy.2022.847142
Received: 01 January 2022; Accepted: 15 February 2022;
Published: 07 March 2022.
Edited by:
Edward John Sambriski, Delaware Valley University, United StatesReviewed by:
Beatriz Marcela Millán Malo, National Autonomous University of Mexico, MexicoLing Li, Virginia Tech, United States
Copyright © 2022 Erdem, O’Neill, Zupkauskas, Caciagli, Xu, Lan, Bösecke and Eiser. This is an open-access article distributed under the terms of the Creative Commons Attribution License (CC BY). The use, distribution or reproduction in other forums is permitted, provided the original author(s) and the copyright owner(s) are credited and that the original publication in this journal is cited, in accordance with accepted academic practice. No use, distribution or reproduction is permitted which does not comply with these terms.
*Correspondence: Talha Erdem, ZXJkZW0udGFsaGFAYWd1LmVkdS50cg==; Erika Eiser, ZWUyNDdAY2FtLmFjLnVr