- 1Key Laboratory of Laser and Infrared System (Shandong University), Ministry of Education, Shandong University, Qingdao, China
- 2School of Information Science and Engineering, Shandong University, Qingdao, China
In this manuscript, we reconsider the amplitude and phase combination of the plane-wave generator (PWG) from an electromagnetic field inverse radiation perspective and further propose a new method based on the Gauss-Newton inversion (GNI) to perform the inverse design of PWG. Furthermore, the wideband antenna pattern is applied in the transfer function and makes the inversion results closer to the engineering implementation. Compared with the traditional least-squares method (LSM) and singular value decomposition (SVD) method, the proposed method owns the merits of less amplitude range of the input source and stronger robustness.
1 Introduction
With the comprehensive promotion of 5G communication, multiple-input multiple-output (MIMO) active antenna arrays are widely used as 5G base station antennas. The increased antenna scale places higher demands on antenna measurement techniques, and various measurement methods are developed continuously. Traditional antenna test solutions include far-field ranges, near-field ranges, and compact ranges [1].
The compact ranges have been widely used for a long time as an effective means to achieve antenna performance in close range. However, the application of this method is limited by the high precision machining necessary, the cost of manufacturing, and construction time. In this manuscript, the solution using a PWG was proposed. The amplitude and phase distribution of the antenna array is determined by amplitude and phase controller, and the superposition effect of the antenna array fields is used to achieve the plane wave with the same amplitude and phase at close range. Moreover, the construction cost of the anechoic chamber can be significantly reduced compared to the compact field ranges because only the amplitude and phase of the antenna array need to be adjusted [2, 3].
The key technique in the design of the PWG is to determine the amplitude and phase of each element in the antenna array. The planar waves with the same amplitude and phase can only be generated in the near-field ranges by calculating the correct amplitude and phase configurations. Currently, there are the determinations of the amplitude and phase such as the least-squares method (LSM) [4] and singular value decomposition (SVD) method [5], which are the most direct regression solution. There are also configuration parameter optimization methods such as the genetic optimization (GO) algorithm [6, 7] and particle swarm optimization (PSO) algorithm [8]. Currently, GO algorithm and PSO algorithm are just applied to linear array or small parameter optimization in PWG design. At present, these direct optimization algorithms cannot be applied to direct optimization of large-scale PWG. Furthermore, the array element position and amplitude-phase configuration can also be determined by the orthogonal matching pursuit (OMP) algorithm [9]. However, the energy radiation in the outer zone around the quiet zone using the OMP algorithm is different to engineer. All of the above literature does not consider the influence of the directionality of the wideband array element, which makes the difference between the theoretical inversion results and the actual antenna array. And the adjustment process to construct amplitude and phase configurations of PWG elements is complicated.
GNI method is usually applied to solve a nonlinear and ill-posed inverse scattering problem [10]. Considering that electric fields illuminated by PWG elements meet the superposition, we choose the GNI method to deal with this linear inverse radiation problem to get a more appropriate solution.
In this manuscript, we present an inverse design approach of the PWG based on the GNI method. GNI method is used to reconstruct the antenna array based on the expected plane waves and the space transfer function. The amplitude and phase distribution of the radiation array elements satisfying the expected plane waves are obtained by calculating the difference between the synthesized field and the expected field. It is worth noting that the engineering realizability is enhanced by adding a wideband antenna pattern to the transfer function. The numerical simulation results show that this method can reconstruct the amplitude and phase information of the array elements with high accuracy to obtain high-quality plane waves with robustness and reliability.
2 Model and Method
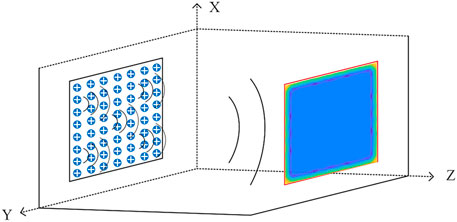
The PWG system based on an antenna array, including a rectangular PWG composed of uniformly spaced antenna arrays and a rectangular quiet zone space where the plane wave should be achieved, is shown in Figure 1. The method provided in this letter is equally applicable to the inversion of cylindrical and spherical quiet zone spaces. In our model, the array elements are evenly spaced at Δx and Δy for the simplicity of the installation. The apertures of the antenna array along the X and Y axes are Dx and Dy, and the lengths of the quiet zone space along the X and Y axes Qx and Qy. The number of array elements is set to M and the number of sampling points in the quiet zone is N. In addition, the cross-sectional centers of the PWG and the quiet zone should be kept parallel and separated by distance L.
The linear model of the PWG can be formulated as
X describes the amplitude-phase information of the M PWG excitation signals and the position coordinates of the mth (m = 1, 2, 3, … , M). PWG excitation signal can be expressed as (xm, ym, zm). Y describes the amplitude-phase information obtained from the N quiet zone sampling points and the position coordinates of the nth (n = 1, 2, 3, … , N) quiet zone sampling point can be expressed as (xn, yn, zn). T is a forward transmission function which can be expressed as
Unlike previous models, we add the antenna pattern amplitude information Fnm of the ultra-wideband array elements in the transmission function, where Fnm represents the pattern amplitude information from the mth PWG array element to the nth quiet zone sampling point. If Fnm are all equal to 1, the transmission matrix is the same as the classical free-space Green’s function model. And Gnm represents the free-space Green’s function, expressed as
where rnm denotes the distance from the mth plane wave generator array element to the nth quiet zone sampling point.
In the traditional model, the transmission matrix usually described as the classical free-space Green’s function model and the directivity of the antenna is ignored. The antenna has a certain directionality in practical applications; therefore, we added Fnm to correct the transfer matrix.
The amplitude and phase distribution obtained by using the traditional LS algorithm can be expressed as [5].
For the traditional SVD algorithm [5], we first perform a singular value decomposition of T as
so, the amplitude and phase distribution can be expressed as
The procedures to derive the amplitude and phase distribution of PWG elements by using the GNI algorithm are given as follows in Algorithm 1.
Algorithm 1 The GNI algorithm in PWG systems.
where J represents Jacobian matrix, σ represents regularization parameter [12], I represents unit matrix, ‖ ⋅‖2 denotes l2-norms, and (⋅)H represents conjugate transpose operator.To accurately obtain the PWG amplitude and phase distribution from the given expected field requirements and transmission function, we use the GNI method to solve this inverse design problem. The amplitude and phase distribution
3 Simulation and Results
We adopt the Vivaldi antennas to constitute the antenna array of the PWG and set the operating frequency from 1.7 to 4.9 GHz. The Vivaldi antenna is chosen because it has a wideband operating frequency and strong directionality compared with the waveguide and microstrip antenna, and these advantages are critical for PWG applications. The pattern of the selected wideband Vivaldi antenna is shown in Figure 2, where the red line represents 1.7 GHz, the green line represents 3.3 GHz, and the purple line represents 4.9 GHz.
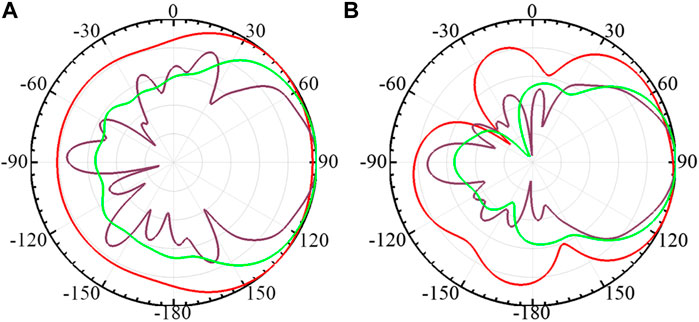
FIGURE 2. (A) E-plane (B) H-plane Vivaldi antenna radiation pattern (red line is 1.7 GHz, green line is 3.3 GHz, and purple line is 4.9 GHz).
The complete transmission function can be obtained by adding the antenna pattern information into the transmission function. Since the wideband Vivaldi antenna is selected, the inversion results at 1.7, 3.3, and 4.9 GHz are tested separately to verify that the corresponding amplitude and phase configurations can be found for each frequency using the GNI method.
In the inverse design, the size of PWG is 20λ × 20λ (Dx = Dy = 16λ), the size of quiet zone is 16λ × 16λ (Qx = Qy = 16λ). The size of the test field is kept as 20λ × 20λ. The distance L between the PWG and the quiet zone is set to 24λ.The spacing between the antenna array elements and the sampling points of the quiet zone is 1λ (Δx = Δy = 1λ). The number of array elements M = 441, the number of sampling points in the quiet zone N = 256. In order to observe the performance of the synthetic plane wave in the quiet zone, the sampling point interval of the test field is set to λ/8 to ensures the test accuracy. In the simulation, the algorithm is programmed and run in the environment of MATLAB2020a version, and the antenna pattern amplitude data Fnm is generated in the ANSYS Electronics Desktop software.
3.1 Ideal Condition Test
In the simulation experiment, LSM, SVD, and GNI algorithms are selected to conduct ideal simulation tests at the operating frequencies of 1.7, 3.3, and 4.9 GHz, respectively.
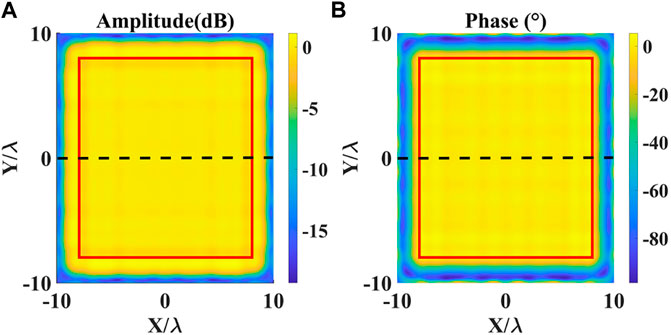
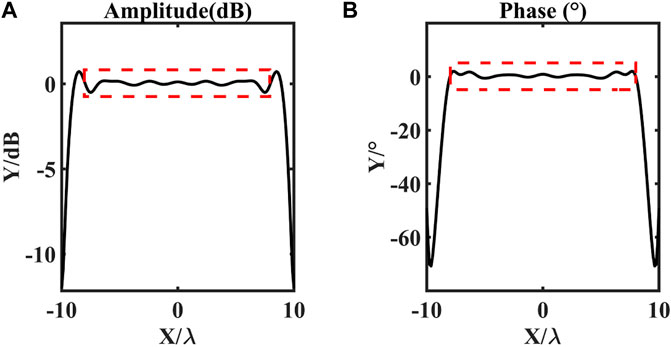
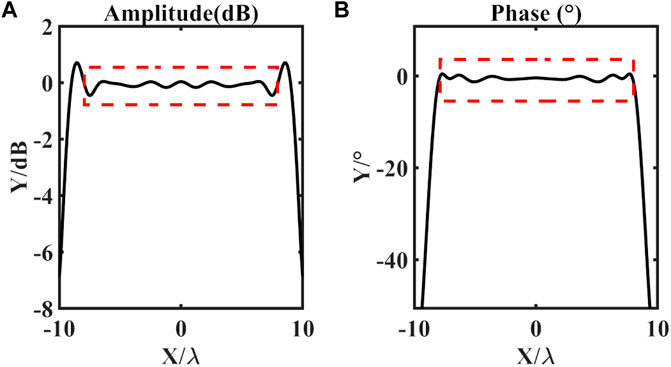
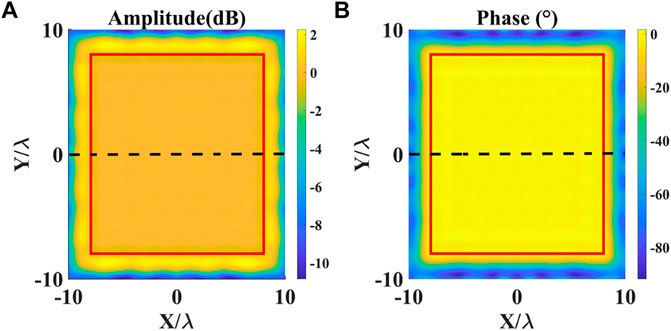
The amplitude-phase error of the test field at the working frequency of the PWG array at 1.7 GHz is shown in Figure 3, where the quiet zone is in the red line range. The test data is shown in Table 1. It can be seen from Table 1 that the amplitude error of the quiet zone obtained by the GNI algorithm is 1.02 dB and the phase error is 3.12°. In order to facilitate the observation of fluctuations, we selected a cross section indicated by the black dashed curve in Figure 3. And the cross-sectional amplitude error and phase error is shown in Figure 4.
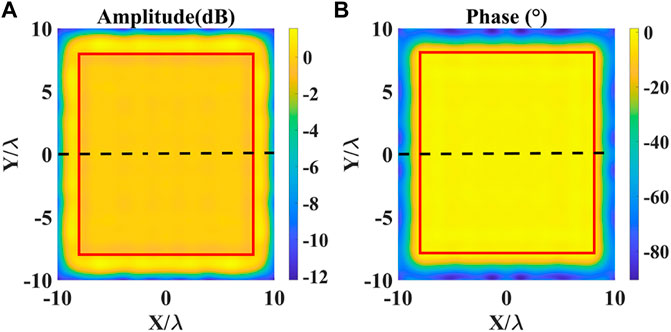
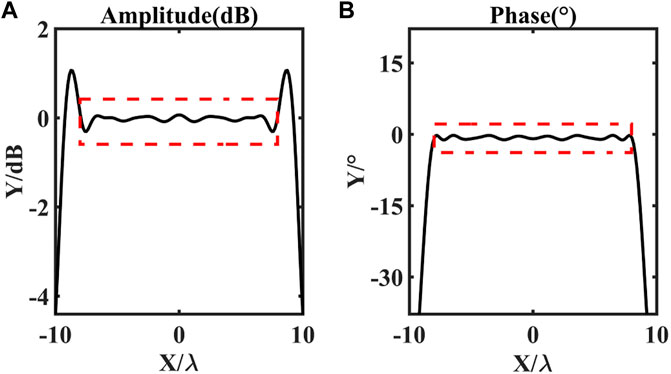
The amplitude-phase error of the test field at the working frequency of the PWG array at 3.3 GHz is shown in Figure 5, where the quiet zone is in the red line range. The test data is shown in Table 2. It can be seen from Table 2 that the amplitude error of the quiet zone obtained by the GNI algorithm is 1.04 dB and the phase error is 3.94°. In order to facilitate the observation of fluctuations, we selected a cross section indicated by the black dashed curve in Figure 5. And the cross-sectional amplitude error and phase error is shown in Figure 6.
The amplitude-phase error of the test field at the working frequency of the PWG array at 4.9 GHz is shown in Figure 7, where the quiet zone is in the red line range. The test data is shown in Table 3. It can be seen from Table 3 that the amplitude error of the quiet zone obtained by the GNI algorithm is 0.88 dB and the phase error is 3.86°. In order to facilitate the observation of fluctuations, we selected a cross section indicated by the black dashed curve in Figure 7. And the cross-sectional amplitude error and phase error is shown in Figure 8.
Based on Table 1, Table 2, and Table 3, the amplitude and phase distribution of PWG excitation inverted by the GNI algorithm satisfies the near-field condition at 1.2 times the aperture of the antenna array, and the plane wave synthesized in the quiet zone satisfies the design requirements of PWG. The amplitude and phase range of excitation is smaller than traditional LSM and SVD methods.
3.2 Robustness Test
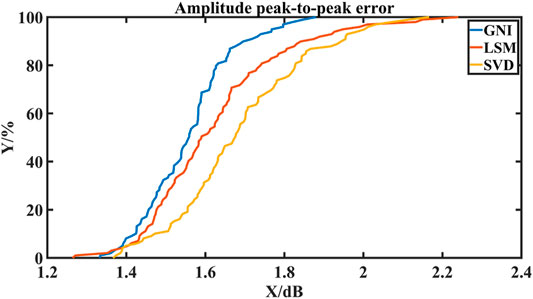
It is worth noting that the numerical simulation establishes completely ideal conditions. In practice, due to the uncertainty error of the amplitude-phase modulator controlling the PWG unit excitation [13], we add Gaussian noise signals of ±0.25 dB amplitude and ±2.5°phase into the amplitude-phase distribution obtained by inversion to simulate this uncertainty, and further verify the robustness of the results.
Gaussian noise signals is Xe =
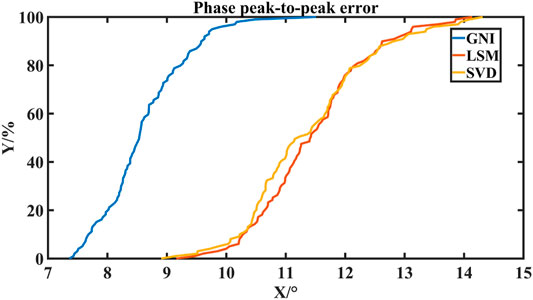
Table 4 records the upper limit of amplitude-phase peak-to-peak error of the three algorithms. From Table 4, we can see that the amplitude peak-to-peak error obtained by the GNI algorithm is 1.76dB, and the phase peak-to-peak error is 9.76°. They are smaller than 1.95 dB and 13.12°of the traditional LSM and 2.01 dB and 13.37° of SVD algorithm, which proves that GNI method is superior to traditional LSM and SVD algorithm in robustness test. And this test can statistically prove that our method can approach a more robust result.
4 Conclusion
In this manuscript, we propose a solution for the inverse design problem of the amplitude and phase configuration in the PWG using the GNI method. The wideband antenna pattern is introduced into the transmission function to approach the actual test environment. Numerical simulation results show that this method can accurately reconstruct the amplitude and phase distribution of PWG excitation, and synthesize high-quality plane waves in the test field. The introduction of random noise error proves that the method has stronger robustness than the other traditional regression algorithms. Based on this, the approach in this manuscript is more practical and feasible.
Data Availability Statement
The raw data supporting the conclusion of this article will be made available by the authors, without undue reservation.
Author Contributions
SHY, JZ, and LD contributed to conception and design of the study. SHY organized the database, performed the statistical analysis, and wrote the first draft of the manuscript. SHY, WC, SW, and LD wrote sections of the manuscript. All authors contributed to manuscript revision, read, and approved and submitted version.
Conflict of Interest
The authors declare that the research was conducted in the absence of any commercial or financial relationships that could be construed as a potential conflict of interest.
Publisher’s Note
All claims expressed in this article are solely those of the authors and do not necessarily represent those of their affiliated organizations, or those of the publisher, the editors, and the reviewers. Any product that may be evaluated in this article, or claim that may be made by its manufacturer, is not guaranteed or endorsed by the publisher.
References
1. Rodriguez V. Basic Rules for Indoor Anechoic Chamber Design [measurements Corner]. IEEE Antennas Propag Mag (2016) 58(6):82–93. doi:10.1109/map.2016.2609821
2. Mario Bucci O, Donald Migliore M, Panariello G, Pinchera D. Plane-wave Generators: Design Guidelines, Achievable Performances and Effective Synthesis. IEEE Trans Antennas Propagation (2018) 61(4):2005.
3. Capozzoli A, Curcio C, Liseno A. Time-harmonic echo Generation. IEEE Trans Antennas Propagat (2011) 59(9):3234–45. doi:10.1109/tap.2011.2161548
4. Xie R, Wang X, Wang R, Wang T, Chen D, Song T, et al. Synthesis of Plane Wave Applied to 5g Communication Antenna Measurement. In: 2017 Progress In Electromagnetics Research Symposium - Spring (PIERS) (2017). p. 195–8. doi:10.1109/piers.2017.8261732
5. Peng F, Chen X, Pei H, Zhang M, Zhang J, Ji Z. Investigation of Array-Based Plane Wave Generator for Compact Antenna Test Range Application. In: 2020 International Conference on Microwave and Millimeter Wave Technology (ICMMT) (2020). p. 1–3. doi:10.1109/icmmt49418.2020.9386411
6. D’Urso M, Prisco G, Cicolani M. Synthesis of Plane-Wave Generators via Nonredundant Sparse Arrays. IEEE Antennas Wireless Propagation Lett (2009) 8:449–52.
7. Haupt R. Generating a Plane Wave with a Linear Array of Line Sources. IEEE Trans Antennas Propagat (2003) 51(2):273–8. doi:10.1109/tap.2003.809082
8. Fan W, Zhang F, Kyosti P, Hentila L, Pedersen GF. Wireless cable Method for High-Order Mimo Terminals Based on Particle Swarm Optimization Algorithm. IEEE Trans Antennas Propagat (2018) 66(10):5536–45. doi:10.1109/tap.2018.2858193
9. Li Y, Gao L, Sun H, Zhang X. Plane-wave Synthesis: A Sparse Representation Perspective. Antennas Wirel Propag Lett (2020) 19(9):1644–8. doi:10.1109/lawp.2020.3013248
10. Mojabi P, LoVetri J. Microwave Biomedical Imaging Using the Multiplicative Regularized Gauss--Newton Inversion. Antennas Wirel Propag Lett (2009) 8:645–8. doi:10.1109/lawp.2009.2023602
11. Mirzaee H. Long-term Prediction of Chaotic Time Series with Multi-step Prediction Horizons by a Neural Network with Levenberg-Marquardt Learning Algorithm. Chaos, Solitons & Fractals (2009) 41(4):1975–9. doi:10.1016/j.chaos.2008.08.016
12. Marquardt DW. An Algorithm for Least-Squares Estimation of Nonlinear Parameters. J Soc Ind Appl Maths (1963) 11(2):431–41. doi:10.1137/0111030
Keywords: plane-wave generator, Gauss-Newton inversion, wideband antenna pattern, inverse design, robustness
Citation: HuYan S, Chen W, Wang S, Du L and Zhao J (2022) Design of Plane Wave Generator Based on Strong Robust Inverse Radiation Problem Solving Method. Front. Phys. 10:842691. doi: 10.3389/fphy.2022.842691
Received: 24 December 2021; Accepted: 21 February 2022;
Published: 23 March 2022.
Edited by:
Yangyang Chen, Hong Kong University of Science and Technology, Hong Kong SAR, ChinaReviewed by:
Yan-Feng Wang, Tianjin University, ChinaStepan Shakhno, Ivan Franko National University of Lviv, Ukraine
Copyright © 2022 HuYan, Chen, Wang, Du and Zhao. This is an open-access article distributed under the terms of the Creative Commons Attribution License (CC BY). The use, distribution or reproduction in other forums is permitted, provided the original author(s) and the copyright owner(s) are credited and that the original publication in this journal is cited, in accordance with accepted academic practice. No use, distribution or reproduction is permitted which does not comply with these terms.
*Correspondence: Liuge Du, bGdkdUBzZHUuZWR1LmNu
 Siteng HuYan
 Wei Chen1
 Shiquan Wang
 Liuge Du