- 1Key Laboratory of Atmospheric Optics, Anhui Institute of Optics and Fine Mechanics, HFIPS, Chinese Academy of Sciences, Hefei, China
- 2Science Island Branch of Graduate School, University of Science and Technology of China, Hefei, China
- 3Advanced Laser Technology Laboratory of Anhui Province, Hefei, China
- 4College of Electrical and Optoelectronic Engineering, West Anhui University, Luan, China
A passive optical fiber laser heterodyne radiometer prototype with a semiconductor laser near 1.316 μm as the local oscillator was built, parameters of the prototype have been optimized. Using the prototype, the water vapor concentration in the atmospheric column was measured with a spectral resolution of 0.009 cm−1 in late October and early November of 2020, the collection time was approximately 3 min, and the signal-to-noise ratio was better than 120. The water vapor column concentration and profiles were inversed based on the optimal estimation method. Compared with the measurement of the Fourier transform spectrometer (EM27/SUN) which was performed simultaneously, the inversion results deviated by less than 14%, and the variation trend of the water vapor concentration showed good consistency. It is demonstrated that the 1.316 μm optical fiber laser heterodyne radiometer possesses good stability and accuracy in the field measurement of atmospheric water vapor concentration.
Introduction
Water vapor is an important greenhouse gas (GHG) that absorbs the most radiation in the atmosphere and contributes approximately 60% of the total radiative forcing [1]. In the context of global warming, the water vapor concentration and temperature will rise due to the increase in each other, forming a positive feedback relationship. It will lead to changes in the water vapor concentration in the upper troposphere (5–10 km) [2]. Therefore, the measurement and long-term monitoring of water vapor concentration in the upper atmosphere are of great significance for the study of the above problems. In addition to global warming, in the field of optoelectronic engineering, besides the effect of scattering and refraction of atmospheric particles, the absorption of atmospheric molecules is also the key to the continuous decay of laser energy during the propagation process. The absorption of laser energy by water vapor will induce thermal blooming and laser nonlinear distortion, which can seriously affect the effect of laser propagation [3].
After decades of effort, several approaches have been proposed and played unique roles in the long-term monitoring of water vapor concentrations, such as satellite remote sensing, LIDAR, and sounding balloons [4–6], these approaches are suitable for different scenarios. The satellite detection range is wide, while the temporal and spatial resolution is low. Although LIDAR detection accuracy is high, the detection range is limited. The sounding balloon can simultaneously detect a variety of atmospheric parameters and detection heights up to 30 km, but the cost is high, and the path is not controllable [7]. A ground-based Fourier transform spectrometer with high resolution is capable of trace gas measurement in atmospheric columns, but the device is usually large and expensive.
Laser spectroscopy has been widely used in trace gas detection. The detection sensitivity is up to ppt level [8, 9] and the volume is getting smaller [10, 11]. In the measurement of atmospheric trace gases, laser heterodyne radiometers (LHRs) have been used extensively, because of their inherent high spectral resolution (υ/Δυ up to approximately 108), easy system integration, and other characteristics [12]. In the atmosphere, the spectral width of molecular spectroscopy is affected by temperature, pressure, etc. The spectral resolution of LHR is generally better than 0.01 cm−1. Therefore, the absorption information of atmospheric molecules in a low-pressure environment can be measured. On the other hand, the measurement results and assumptions about the high-altitude water vapor concentration can be verified.
With the development of optical fiber communication technology, the production process of near-infrared fiber is very mature, and its price is relatively low. This facilitates the development of compact optical fiber LHR. The optical fiber structure is convenient to build and adjust and has a strong vibration and deformation resistance, and the system will be more stable. In recent years, research on optical fiber LHR has made some progress. In 2014, Wilson EL et al. developed a 1,573.6 nm optical fiber LHR to achieve high sensitivity measurement of CO2 absorption spectra [13], and in 2019, they developed a portable and autonomous 1.64 μm LHR [14]. In 2014, Rodin A et al. used a 1.65 μm optical fiber LHR to achieve absorption measurements of CH4 and CO2 with a signal-to-noise ratio (SNR) of 120 with an exposure time of 10 min [15]. The groups of Gao X and Kan R also reported the study of optical fiber LHR [16, 17]. However, the above studies generally focus on the measurement of carbon-containing GHGs, and there are few studies on the content and characteristics of water vapor concentration. As a GHG whose concentration changes rapidly in the atmosphere, the measurement of water vapor concentration requires a high measurement rate while ensuring the SNR of the instrument.
We have accumulated some experience in the measurement of absorption spectra of various atmospheric molecules in several wavelengths [18–20]. In this paper, the semiconductor laser emitting at 1.316 μm was used as the local oscillator, according to our knowledge, the wavelength of the local oscillator is the shortest of all publications. The 1.316 μm region is rich in water vapor transitions with suitable line intensities, which provides a favorable condition for the measurement of water vapor concentration in the atmosphere column. The required optoelectronic devices are commercially available, which provides many options for the design and development of LHRs. To evaluate the accuracy of the LHR on water vapor concentration measurement, a Fourier transform infrared spectrometer (Brucker, EM27/SUN) with a resolution of 0.5 cm−1 [21] was used to perform simultaneous measurements.
Instrument Design and Data Processing
The principle of laser heterodyne is similar to that of radio. A laser beam is used as the local oscillator to beat with the signal containing information, and the heterodyne signal is generated on the mixer. It can realize the amplification of the signal by the local oscillator [12, 22, 23]. The basic principle is shown in Figure 1.
According to the principle of laser heterodyne, the power of the heterodyne signal is proportional to the power of the local oscillator and signal [22, 23].
In heterodyne detection, the signal is generally weak, while the intensity of the local oscillator is several orders of magnitude higher than that of the signal. Therefore, the local oscillator has a strong amplification effect on the signal, which can achieve highly sensitive spectral detection.
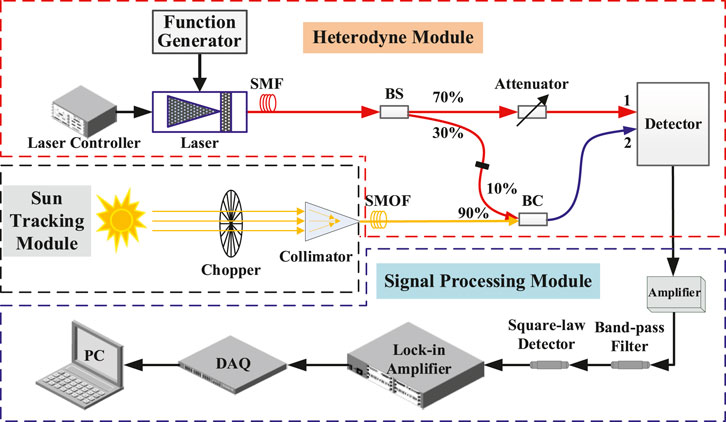
The system structure of the prototype is schematically shown in Figure 2. The solar tracker and the attached light collection devices realize the stable tracking and collection of sunlight, which contains the absorption information of atmospheric molecules. The heterodyne module combines the collected sunlight with the local oscillator to generate the heterodyne signal. The signal processing technology is used to amplify, bandpass filter, and square-law detect the heterodyne signal and finally realize the output and acquisition of the heterodyne spectral signal.
In the solar tracking module, the tracking accuracy of the solar tracker (EKO, STR21G) is higher than 0.01°. Its built-in GPS sensor provides precise position state parameters for the initial alignment to track the Sun, and a four-quadrant sensor compensates for geometric positioning deviations. The sunlight is amplitude modulated by a chopper (SCITEC, 300CD) with a chopping frequency of approximately 1 kHz. The modulated sunlight is collected by a collimator (Thorlabs, F810APC-1310) and coupled directly into the single-mode fiber (SMF-28e), the attenuation of the fiber at 1,316 nm is less than 0.32 dB/km. The fiber interface type is FC/APC, which has an 8° polished end face to reduce the additional interference caused by light return reflections on the system.
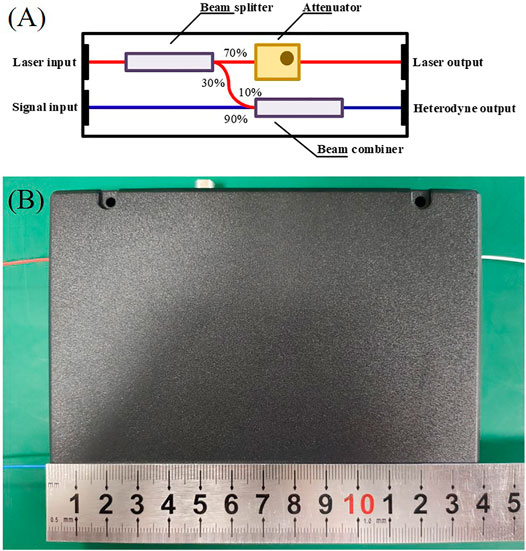
The heterodyne module consists of a laser, beam combiner, beam splitter, attenuator, and photodetector devices. The central wavelength of the semiconductor laser (NTT, NLK1B5EAAA) is 1,315 nm with an output power of 25 mW (T = 25°C, I = 90 mA). The spectral linewidth of the laser is approximately 2 MHz, and the side mode suppression ratio is greater than 40 dB. The wavelength stability of the local oscillator was recorded by a wavelength meter (Bristol Instruments, 621A). The wavelength fluctuation during sampling is less than 0.0007 cm−1. Through tests and considering the detector saturation threshold, the specific beam splitting ratio and beam combining ratio are shown in Figure 2. 70% of the local oscillator is attenuated by the attenuator and then enters input channel 1 of the balanced detector (Thorlabs, PDB470C-AC), and the remaining light passes through the 10% channel of the beam combiner and combines with sunlight from the 90% channel of the beam combiner, and the combined beam is fed into input channel 2 of the detector to yield the heterodyne signal. In LHR, the energy of the local oscillator is sufficient or even exceeds the demand, and the fiber it passes through generally needs to increase the attenuation ratio or add an adjustable attenuator. The intensity of the signal light is weak and insufficient, so the transmittance of the channel of signal light input in the combiner is 90%, which is done to reduce the attenuation of the signal light as much as possible. The bandwidth (3 dB) of radio frequency (RF) output of the balanced detector is 100 Hz–400 MHz. It can effectively suppress the common-mode signal and amplify the differential-mode signal, which is suitable for the measurement of weak signals. According to the theory of heterodyne detection, the spot of the local oscillator and signal light should be equal in size and completely coincide, otherwise, the noncoincidence part will generate noise and contribute nothing to the useful signal, optical fiber structure is able to avoid the noise caused by spot mismatch. Compared to traditional free space versions, optical fibers can make the LHR more stable, compact, and coupling efficient. Figure 3 shows the integrated design of the heterodyne module.
The signal processing module includes an RF amplifier, bandpass filter, square-law detector, lock-in amplifier, and acquisition card. The amplification gain of the RF amplifier (Spectrum, SPA.1411) is up to 100, and the bandwidth is 200 MHz. The electronic filter bandwidth is limited to 10–80 MHz by combining a high pass 10 MHz and a low pass 80 MHz filter. The spectral resolution of the system was approximately 0.009 cm−1 based on the instrument line function theory [18, 24]. The lock-in amplifier (Sine Scientific Instrument, OE1201) uses the chopping frequency of the chopper as the reference signal for signal demodulation, with an integration time of 30 ms and a sensitivity of 1 mV. The output signal of the lock-in amplifier is captured by the acquisition card and then recorded by a computer for real-time display and storage.
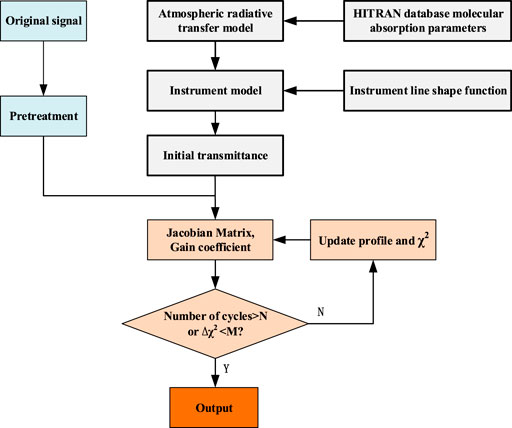
The inversion of gas concentration generally contains two processes: 1) constructing the atmospheric radiative transfer model (ARTM) and instrument model to simulate the convolution process of the solar spectrum with the atmospheric system and the spectral measurement system to obtain the simulated spectrum and 2) iterating the measured spectrum and the simulated spectrum in a loop according to the constraints to obtain the inversion results.
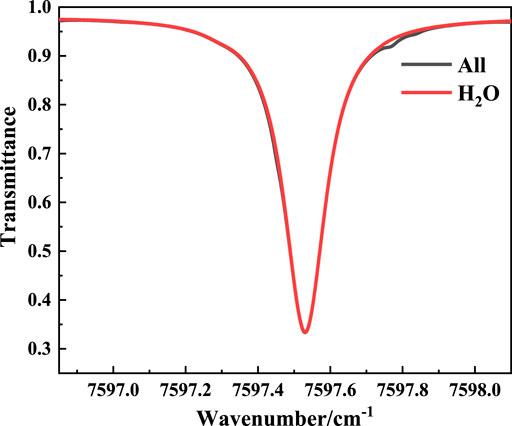
The ARTM can be obtained by processing molecular spectral line parameters from the HITRAN database with the line-by-line integrated radiative transfer model (LBLRTM), which is the prerequisite for spectral line selection and gas concentration inversion. The absorption of atmospheric molecules in the measurement range (7596.85–7598.10 cm−1) was simulated with the United States Standard Atmospheric (1976) at the zenith angle of 45°. The simulation results are shown in Figure 4. There is a suitable absorption feature of water vapor with a transition of 7597.53 cm−1 [S = 3.31 × 10⁻²⁴ cm−1/(molec·cm−2)] for measurement. Within the range, the absorption of other molecules only slightly affects the right wing range, and the impact is easily deducted during data processing.
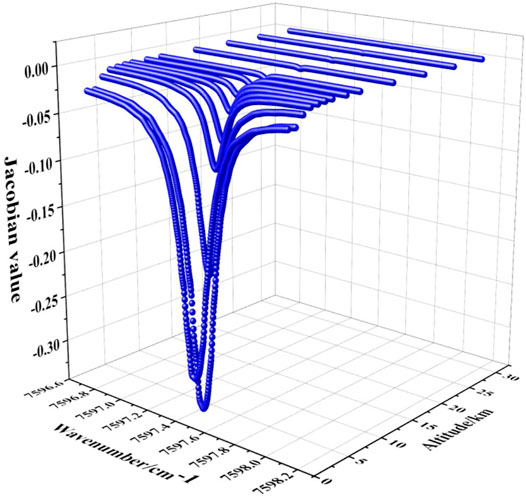
The water vapor concentration inversion algorithm adopts the principle of the optimal estimation method (OEM), which was proposed by Rodgers CD based on the Bayesian statistical method [25]. The measured spectral data need to be preprocessed before inversion by the OEM, which contains a noise component, background offset, and DC modulation component of the local oscillator. Therefore, it is necessary to remove the influence of these factors for concentration inversion. The flow of the inversion is shown in Figure 5. According to the OEM for the inversion of the spectral data, the Jacobian matrix and gain coefficient need to be calculated. The Jacobian matrix characterizes the sensitivity of the transmittance or optical thickness to the gas concentration, which is calculated by the LBLRTM. The gain coefficient is obtained from the preprocessed spectral data and the initial transmittance. The Jacobian matrix is updated with each iteration because the sensitivity of different optical thicknesses to gas concentration changes due to the change in gas concentration. If the loop residual reaches the exit condition, the loop will be terminated, and the result will be shown. If the exit condition is not satisfied, the loop iterations continue until the exit condition is fulfilled. The output result is the water vapor vertical profile, and the column concentration of water vapor is obtained by integrating the concentration profile.
Results and Comparison
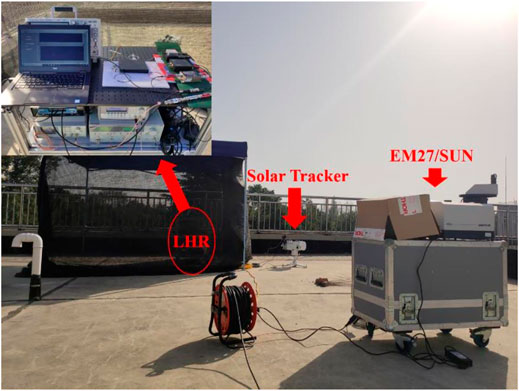
From 2020.10.23 to 2020.11.4, the water vapor absorption spectra were measured on Science Island in Hefei (N31.82°, E117.22°) by the 1.316 μm optical fiber LHR. Meanwhile, the EM27/SUN was used as a contrasting instrument to measure at the same place. Figure 6 shows the actual situation of the field experiment, with the LHR on the left and the EM27/SUN on the right. For the LHR, the time of the wavelength scanning was 30 s, and the data were averaged 6 times, so the acquisition time was approximately 3 min.
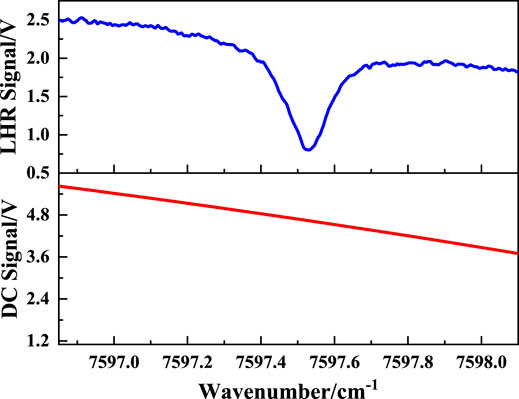
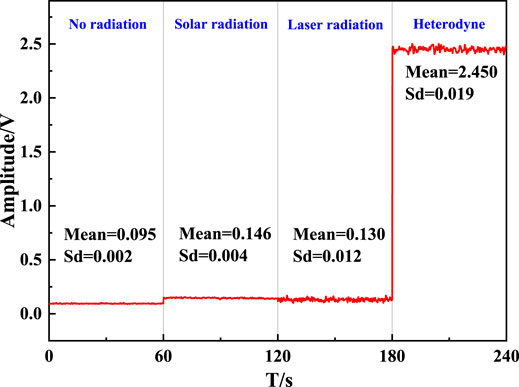
The measurements were interrupted for a few days by cloudy and rainy weather, but it also gave more interesting weather-related features to the water vapor concentration profiles and column concentration variations. Figure 7 shows the water vapor absorption spectral signal and the DC signal, and Figure 8 shows the noise level and the corresponding standard deviation of the LHR for the four different cases. It can be seen from Figure 7 that the change in the local oscillator power causes the skew of the spectral signal baseline, and this effect can be deducted in the data processing process. Overall, the SNR is better than 120. Of course, the SNR can be improved by increasing the average times of data appropriately, but in the case of the current SNR, the collection time of approximately 3 min is more conducive to the timely response to the concentration changes of water vapor. By comparing the noise in the four different cases, the main noise of the system is the shot noise caused by the local oscillator, which accounts for more than 60% of the total noise.
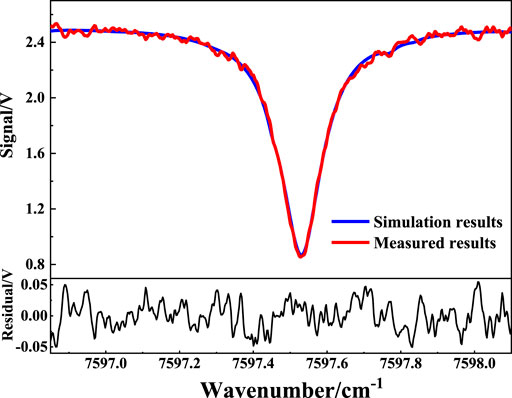
The DC modulation was subtracted from the spectral signal measured by the LHR and compared with the simulation results under the same conditions. The results are shown in Figure 9, where the red curve is the measured result, the blue curve is the simulated result, and the black curve is the residual between them. The measured results are in good agreement with the simulated results, and the maximum deviation is approximately 2%.
Since the gas concentration is negatively related to the transmittance, each element of the Jacobian matrix is nonpositive. The calculation results of the Jacobian matrix are shown in Figure 10. The atmosphere below 30 km is divided into 13 layers, each layer has different attenuation coefficients for water vapor. Since the water vapor is mainly concentrated near the ground, the attenuation of the transmission by water vapor is also greater, so the layers are relatively fine. The intervals of each layer below 6 km are set at 1 km, and that between 6 and 10 km is set at 2 km. The water vapor concentration above 10 km is very weak, so the interval is set at 5 km.
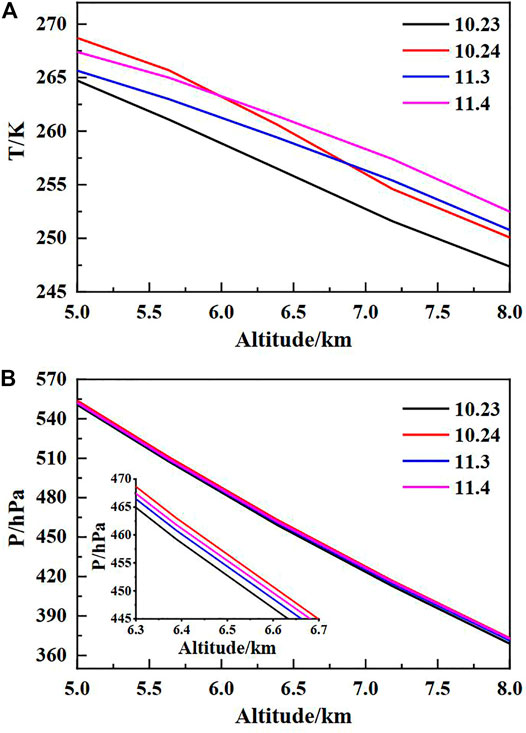
The water vapor concentration was inverted by the OEM. Figure 11 shows the variation of the water vapor concentration with altitude, i.e., the water vapor concentration profile. The black curve is the result obtained from the reanalysis data processing on the website of the European Centre for Medium-range Weather Forecasts (ECMWF), and the red curve is the inversion result. 10.24, 11.3, and 11.4 have obvious maximum water vapor concentrations at altitudes of 5–8 km. As mentioned earlier, rainy weather was interspersed during the measurement. Therefore, this may be due to the existence of a strong water vapor transport process at the corresponding altitude. As shown in Figure 12, the analysis of the temperature and pressure data (National Centers for Environmental Prediction, NCEP) reveals that anomalies are also reflected at the corresponding altitudes. The magnitude of the water vapor concentration maxima clearly corresponds to the temperature at altitudes of 5–8 km, with the highest average temperature at 11.4 and the lowest at 10.23. The maximum value of water vapor concentration and pressure value also have a similar trend, among which the pressure at 10.23 is the lowest. The increase in temperature and pressure may be due to the higher water vapor concentration that absorbed more radiation.
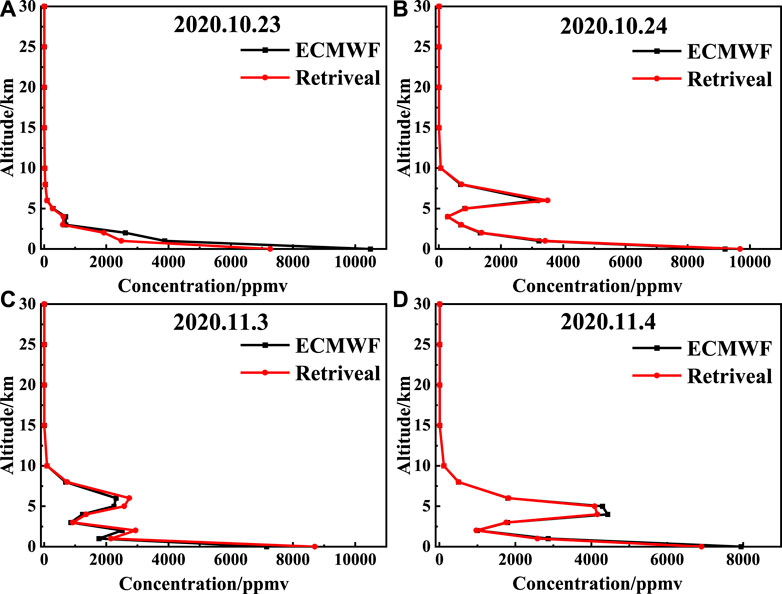
FIGURE 11. Profiles of water vapor concentration in the atmosphere. (A)The variation of water vapor concentration with altitude is smooth. The higher the altitude, the lower the water vapor concentration. (B–D) Water vapor concentration has a maximum value in 5–8 km, which may be due to the strong water vapor transport process in the high altitude.
Hefei is in the mid-latitude zone of the Northern Hemisphere, which has a subtropical monsoon climate. October to November is the late autumn and early winter; hence, the water vapor content is relatively low, and the column concentration is generally below 2000 ppm. Figure 13 shows the variation in water vapor concentration during the experiment. The red curve is the measurement result of the LHR, and the blue curve is the measurement result of the EM27/SUN. Table 1 shows the comparison of the two measurement results. Compared with the EM27/SUN results, the overall inversion results of the LHR are lower, with deviations of 13.5%, 9.9%, 12.4%, and 11.1%, respectively. This may be related to the inversion algorithms of the two measurement methods and the parameter settings in the algorithms. However, the trends of water vapor concentration are consistent. The correlation coefficients of the two measurement results are 0.660, 0.944, 0.898, and 0.928. During the measurement, the temperature near the ground rose, the evaporation of water vapor increased, and the concentration of water vapor showed an upward trend. On October 23, the water vapor concentration changed rapidly, and the overall state was unstable. Both instruments measured an obvious V-shaped fluctuation from 10:45 to 11:10.
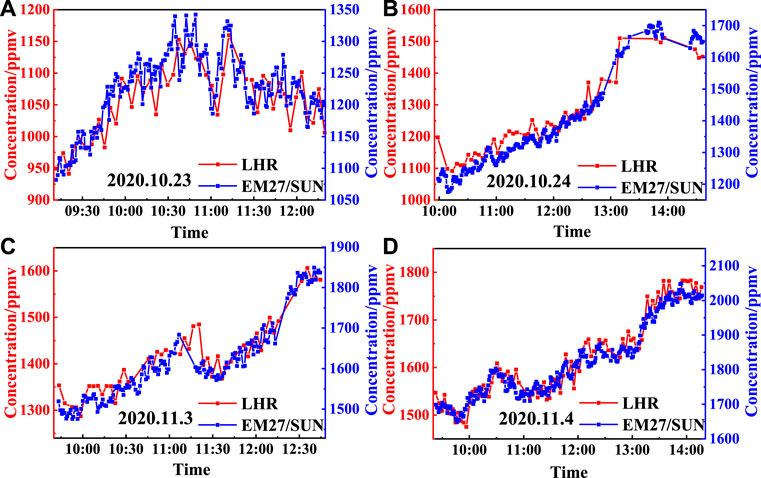
FIGURE 13. Inversion results of water vapor concentration in the atmosphere. (A) The water vapor concentration measured by LHR and EM27/SUN changed rapidly and showed an unstable state. (B–D) Water vapor concentration showed a stable increasing trend during the measurement period.
Conclusion
The 1.316 μm optical fiber LHR prototype was established, the heterodyne module was integrated and the system parameters were optimized, which made the prototype more compact and stable. The LHR was favorable in field measurements, and the SNR and spectral resolution were approximately 120 and 0.009 cm−1, respectively. The absorption spectrum of atmospheric water vapor in Hefei was measured, and the water vapor concentration was inverted by the OEM. The results were compared with the Fourier transform spectrometer which performed the measurements simultaneously, the variation trends of the two methods were consistent. This proves that the accuracy and practicality of the LHR are respectable in atmospheric molecular concentration measurements. Future work will focus on system integration and long-term monitoring of GHGs.
Data Availability Statement
The raw data supporting the conclusion of this article will be made available by the authors, without undue reservation.
Author Contributions
JH was responsible for the overall design and implementation of the experiment, data processing, and manuscript writing. YH and ZC provided inspiration for the theory and operation of the experiment and suggestions for the revision of manuscripts. XL guided the processing of laser heterodyne spectroscopy data, and DL was responsible for the processing of Fourier transform spectrometer data. ZY and GQ provided help for the construction of the experimental device and data collection.
Funding
This work was supported by the Strategic Priority Research Program of Chinese Academy of Sciences (Grant No. XDA17010104).
Conflict of Interest
The authors declare that the research was conducted in the absence of any commercial or financial relationships that could be construed as a potential conflict of interest.
Publisher’s Note
All claims expressed in this article are solely those of the authors and do not necessarily represent those of their affiliated organizations, or those of the publisher, the editors and the reviewers. Any product that may be evaluated in this article, or claim that may be made by its manufacturer, is not guaranteed or endorsed by the publisher.
References
1. Kiehl JT, Trenberth KE. Earth's Annual Global Mean Energy Budget. Bull Amer Meteorol Soc. (1997) 78(2):197–208. doi:10.1175/1520-0477(1997)078<0197:eagmeb>2.0.co;2
3. Smith DC. High-power Laser Propagation: Thermal Blooming. Proc IEEE (1977) 65(12):1679–1714. doi:10.1109/PROC.1977.10809
4. Chan KL, Valks P, Slijkhuis S, Köhler C, Loyola D. Total Column Water Vapor Retrieval for Global Ozone Monitoring Experience-2 (GOME-2) Visible Blue Observations. Atmos Meas Tech (2020) 13(8):4169–4193. doi:10.5194/amt-13-4169-2020
5. Lange D, Behrendt A, Wulfmeyer V. Compact Operational Tropospheric Water Vapor and Temperature Raman Lidar with Turbulence Resolution. Geophys Res Lett (2019) 46(24):14844–14853. doi:10.1029/2019GL085774
6. Brunamonti S, Jorge T, Oelsner P, Hanumanthu S, Singh BB, Kumar KR, et al. Balloon-borne Measurements of Temperature, Water Vapor, Ozone and Aerosol Backscatter at the Southern Slopes of the Himalayas during StratoClim 2016-2017. Atmos Chem Phys (2018) 18, 15937–15957. doi:10.5194/acp-18-15937-2018
7. Ren H-M, Li A, Li A, Hu Z-K, Huang Y-Y, Xu J, et al. Measurement of Atmospheric Water Vapor Vertical Column Concentration and Vertical Distribution in Qingdao Using Multi-axis Differential Optical Absorption Spectroscopy. Acta Phys Sin (2020) 69(20):204204. doi:10.7498/aps.69.20200588
8. Ma Y, Hong Y, Qiao S, Lang Z, xiaonan L. H-shaped Acoustic Micro-resonator Based Quartz-Enhanced Photoacoustic Spectroscopy. Opt Lett (2022). doi:10.1364/OL.449822
9. Liu X, Ma Y. Sensitive Carbon Monoxide Detection Based on Light-Induced Thermoelastic Spectroscopy with a Fiber-Coupled Multipass Cell[J]. Chin Opt Lett (2022) 20:031201. doi:10.3788/COL202220.031201
10. Ma Y, Hu Y, Qiao S, Lang Z, Liu X, He Y, et al. Quartz Tuning forks Resonance Frequency Matching for Laser Spectroscopy Sensing. Photoacoustics (2022) 25:100329. doi:10.1016/j.pacs.2022.100329
11. Liu X, Qiao S, Ma Y. Highly Sensitive Methane Detection Based on Light-Induced Thermoelastic Spectroscopy with a 2.33 µm Diode Laser and Adaptive Savitzky-Golay Filtering. Opt Express (2022) 30(2):1304–1313. doi:10.1364/OE.446294
12. Teich MC, Keyes RJ, Kingston RH. OPTIMUM HETERODYNE DETECTION AT 10.6 μm IN PHOTOCONDUCTIVE Ge:Cu. Appl Phys Lett (1966) 9(10):357–360. doi:10.1063/1.1754611
13. Wilson EL, Mclinden ML, Miller JH, Allan GR, Ott LE, Melroy HR, et al. Miniaturized Laser Heterodyne Radiometer for Measurements of CO2 in the Atmospheric Column. Appl Phys B (2014) 114(3):385–393. doi:10.1007/s00340-013-5531-1
14. Wilson EL, Digregorio AJ, Villanueva G, Grunberg CE, Souders Z, Miletti KM, et al. A Portable Miniaturized Laser Heterodyne Radiometer (Mini-LHR) for Remote Measurements of Column CH4 and CO2. Appl Phys B (2019) 125(211):1–9. doi:10.1007/s00340-019-7315-8
15. Rodin A, Klimchuk A, Nadezhdinskiy A, Churbanov D, Spiridonov M. High Resolution Heterodyne Spectroscopy of the Atmospheric Methane NIR Absorption. Opt Express (2014) 22(11):13825–34. doi:10.1364/OE.22.013825
16. Wang J, Sun C, Wang G, Zou M, Tan T, Liu K, et al. A Fibered Near-Infrared Laser Heterodyne Radiometer for Simultaneous Remote Sensing of Atmospheric CO2 and CH4. Opt Lasers Eng (2020) 129:106083. doi:10.1016/j.optlaseng.2020.106083
17. Deng H, Yang C, Xu Z, Li M, Huang A, Yao L, et al. Development of a Laser Heterodyne Spectroradiometer for High-Resolution Measurements of CO2, CH4, H2O and O2 in the Atmospheric Column. Opt Express (2021) 29(2):2003–2013. doi:10.1364/OE.413035
18. Lu X., Cao Z., Huang Y., Gao X., Rao R.. Laser Heterodyne Spectrometer for Solar Spectrum Measurement in the 3.53 μm Region. Opt Precision Eng (2018) 26(08):1846–1854. doi:10.3788/OPE.20182608.1846
19. Huang J, Huang Y, Lu X, Cao Z, Tan T, Liu D. Design of 3.66μm Laser Heterodyne Spectrometer and Retrieval of Water Vapor Column Concentration. J Infrared Millim Waves (2020) 39(05):610–618. doi:10.11972/j.issn.1001-9014.2020.05.012
20. Huang J., Huang Y., Lu X., Cao Z., Qi G., Yuan Z.. Measurement and Concentration Inversion of Ozone in Golmud by Laser Heterodyne Spectrometer. ACTA PHOTONICA SINICA (2021) 50(04):57–65. doi:10.3788/gzxb20215004.0401002
21. Gisi M. Setup of Precise Camera Based Solar Tracker Systems and Greenhouse Gas Measurements Using a Modified Portable Spectrometer. Eggenstein-Leopoldshafen, Germany: Institut für Meteorologie und Klimaforschung (2012). doi:10.5445/IR/1000031248
22. Melroy HR, Wilson EL, Clarke GB, Ott LE, Mao J, Ramanathan AK, et al. Autonomous Field Measurements of CO2 in the Atmospheric Column with the Miniaturized Laser Heterodyne Radiometer (Mini-LHR). Appl Phys B (2015) 120(4):609–615. doi:10.1007/s00340-015-6172-3
23. Tan T, Cao Z, Wang G, Wang L, Liu K, Huang Y, et al. Study on the Technology of the 4.4 μm Mid-infrared Laser Heterodyne Spectrum. Spectrosc Spectral Anal (2015) 35 1516–1519. doi:10.3964/j.issn.1000-0593(2015)06-1516-04
24. Lu X, Cao Z, Tan T, Huang Y, Gao X, Rao R. Instrument Line Shape Function of Laser Heterodyne Spectrometer. wlxb (2019) 68(06):064208–142. doi:10.7498/aps.68.20181620
Keywords: laser heterodyne, optical fiber, water vapor concentration, optimal estimation method, field experiment
Citation: Huang J, Huang Y, Lu X, Liu D, Yuan Z, Qi G and Cao Z (2022) Measurements of Atmospheric Water Vapor by a 1.316 μm Optical Fiber Laser Heterodyne Radiometer. Front. Phys. 10:835189. doi: 10.3389/fphy.2022.835189
Received: 14 December 2021; Accepted: 14 January 2022;
Published: 04 February 2022.
Edited by:
Yufei Ma, Harbin Institute of Technology, ChinaReviewed by:
Chuanliang Li, Taiyuan University of Science and Technology, ChinaYing He, Harbin Institute of Technology, China
Copyright © 2022 Huang, Huang, Lu, Liu, Yuan, Qi and Cao. This is an open-access article distributed under the terms of the Creative Commons Attribution License (CC BY). The use, distribution or reproduction in other forums is permitted, provided the original author(s) and the copyright owner(s) are credited and that the original publication in this journal is cited, in accordance with accepted academic practice. No use, distribution or reproduction is permitted which does not comply with these terms.
*Correspondence: Xingji Lu, eGpsdUBhaW9mbS5hYy5jbg==
 Jun Huang
 Yinbo Huang1,3
