 Brock Alan Le Cerf1,2
 Natasha Theresa Pyne2
 Jasreen Kular2
 Sarah Theresa Boyle2
 David Allan Beattie1
 Marta Krasowska1*
 Michael Susithiran Samuel2,3*
- 1Future Industries Institute, UniSA STEM, University of South Australia, Mawson Lakes, SA, Australia
- 2Centre for Cancer Biology, an alliance between SA Pathology and the University of South Australia, Adelaide, SA, Australia
- 3Faculty of Health and Medical Sciences, Adelaide Medical School, University of Adelaide, Adelaide, SA, Australia
While it is now well appreciated that the extracellular matrix (ECM) exerts biomechanical cues that direct critical cellular behavior, including cell proliferation, differentiation, migration, and survival, the molecular mechanisms underlying these cues remain mysterious. It has long been known that the ECM is also a source of biochemical cues that influence these processes, but the way these interact with ECM biomechanics also remains largely unknown. The systematic study of these relationships has been hampered by a paucity of models and the tools to interrogate them. Studies of complex models and tissue samples employing techniques such as atomic force microscopy (AFM) have informed much of our current understanding of how mechanical cues are transduced by the ECM and how cells respond to them. However, key observations made using such complex systems cannot be reliably assigned to the ECM or its components without a precise understanding of how these components respond to and exert mechanical force at the nanoscale – the scale at which individual cells respond. To address this knowledge gap, we used AFM to study the nanomechanical properties of a simple model, consisting only of type I collagen, the most abundant component of the ECM. Intriguingly, our data show bimodal distribution that is entirely attributable to type I collagen, greatly simplifying the interpretation of these studies. Furthermore, we examined the nanomechanical influence of tissue fixation by protein cross-linking, an approach commonly used in research and medical histopathology, revealing a significant and non-uniform distortion of the nanomechanical profile of fixed samples, which has the potential to introduce artifacts into the nanomechanical characterization of tissues. In contrast to the clear observation of mechanical differences induced by cross-linking, Fourier-transform infrared (FTIR) spectroscopy revealed only subtle alterations to the chemical signature of the collagen, highlighting the importance of nanomechanical approaches for the complete characterization of model systems and tissues.
Introduction
The most abundant macromolecule in animals is the fibrillar ECM protein collagen. The properties of the ECM are determined not only by which type of collagen is present, but also by how the collagen monomers are assembled into polymers, cross-linked and bundled into fibers [1, 2]. If it is associated in a loose network of fibrils, collagen will form a soft, anisotropic matrix such as that found in skin. When assembled into hierarchical fibrous bundles, isotropic, stiff but extensible tissue such as that found in tendons is generated, while a dense, highly polymerized network results in a strong, rigid, and anisotropic matrix such as that formed in bone. Due to the prevalence of collagen in ECM and its significance in determining mechanical characteristics, it has been a prime target for research into biophysical mechanisms that underpin ECM-cell crosstalk. The ECM is closely apposed to cells in tissues and strongly influences their behavior by way of mechanical signals transduced via receptors in the cell membrane. These include integrins, discoidin domain receptors (DDRs), leukocyte-associated IG-like receptor (LAIR) and mannose receptor family members such as CD206 [3]. Downstream signaling is mediated by mechanotransduction pathways such as those mediated by mitogen-activated protein kinases (MAPK) [4], Ras homology (RHO) family members [5], and the Yes-associated protein (YAP) and its paralogs such as TAZ [6]. Mechanotransduction can in turn activate more downstream chemical signaling pathways such as the Wnt/β-catenin pathways [7, 8]. Direct transduction of mechanical tension from the ECM to the cellular actin cytoskeleton can also lead to activation of mechanosensitive ion channels, which themselves mediate chemical signaling by regulating ion flux [9]. The vast majority of cellular functions can therefore be influenced by mechanical signals transduced via the ECM, both in development [10] as well as health and disease [11]. These mechanisms are nevertheless reciprocal, as mechanosensation and transduction can in turn induce the production and remodeling of the ECM, thereby modifying its mechanical properties [12, 13].
The dynamic nature of the ECM has led to the hypothesis that the changes in ECM structure, mechanical profile and chemistry caused by mechanotransduction, particularly in the context of cancer, can be quantified at the nanoscale, and compiled into a “nanomechanical profile” that can be linked to specific cancer types and subtypes. Over the past 15 years much research has been conducted to test this hypothesis. Here, two specific avenues of investigation into these changes will be discussed. The first is atomic force microscopy (AFM), a contact-based method of determining both morphology and mechanical properties at the nanoscale. The second is Fourier transform infrared spectroscopy (FTIR), a well-established non-contact-based method of evaluating key chemical characteristics.
AFM is now routinely used to assess the mechanical properties of thin films [14, 15], cells [16, 17] and tissue [7, 18, 19]. Plodinec et al. identified a clear connection between the stiffness profiles of various components of the tumor and the state of tissue pathology [20] - increasing core stiffness correlated inversely with invasiveness. They also found that the stiffest part of a tumour was at the invasive front where remodeling of the ECM takes place via increased collagen density and cross-linkage. They therefore postulated that the mechanical properties of the ECM were likely linked to specific properties of the cancer and could be used to determine the pathology of the disease. This postulation was supported by the detection of the emergence of bimodality of breast tissue as it transitioned from healthy to pre-malignant to early malignancy when compared to the unimodal nature of benign lesions. This was an important development in the use of AFM in quantifying this fundamental characteristic of cancers. Acerbi et al. assessed stiffness at the core and invasive front of tumors relative to healthy tissue [18]. They undertook a comprehensive analysis of different subtypes of breast cancer (luminal A, luminal B, basal-like and HER-2+) and the differences in the ECM stiffness profile at the invasive front in these subtypes. They found that it was possible to distinguish between subtypes using a combination of distribution and average of the elastic modulus map of the invasive front. The more aggressive of the four cancer subtypes investigated, basal-like and HER-2+, exhibited a stiffer and more mechanically heterogeneous elasticity map relative to the other less aggressive subtypes.
While AFM provides information about the nanomechanical properties of tissue, spectroscopic techniques can reveal complementary information on chemical composition, environment and structure. Proteins in particular have important characteristics that are reflected in both the subsequent levels of assembly including secondary, tertiary and quaternary structures, and the environments in which they are present (e.g., an aqueous environment with varied pH or ionic strength). Variations in these characteristics can be detected using FTIR, which is sensitive to changes in bond vibrational energy caused by changing chemical environments and conformational structures. Using FTIR to evaluate collagen is relatively common in the literature. The primary area of interest in the FTIR spectrum is the amide I band, a region in the 1700–1600 cm−1 that is attributed to the C=O stretching and N-H bending bond vibrational modes [21, 22]. A key modification of interest is the cross-linkage between tropocollagen molecules, which has been reported to be detectable by changes in this region [23, 24]. Several studies have suggested that for FTIR, measuring the ratio of the peaks at 1655 and 1690 cm−1 can allow for the degree of cross-linking in type I collagen to be inferred [21].
Using AFM nanomechanical mapping in conjunction with the FTIR spectroscopy in simple models should allow for greater specificity and accuracy in assigning key biophysical characteristics to the correct physiological features of more complex models. This manuscript focuses on the effect of chemical cross-linking of simple type I collagen gels on changes in their mechanical and chemical properties.
Materials
Real Architecture For 3D Tissue (RAFT™) cell culture systems were from Lonza, Switzerland. High density collagen solutions (8–11 mg/ml) were from Corning, USA. Ethanol (100% undenatured, 99.5% v/v, AR) was from Chem Supply, Australia. Phosphate-buffered saline (PBS) was from Gibco, Thermo Fisher Scientific. Gelatin crystals, glutaraldehyde (50% v/v in water), ethanolamine (AR, >98% v/v), ammonium hydroxide (30% NH3 basis), Triton X-100 surfactant and ascorbic acid used in cell culture experiments were from Sigma Aldrich, Australia. Milli-Q water of a resistivity of 18.2 MΩ cm and an interfacial tension of 72.4 mN/m at 22°C, and a total organic carbon component of less than 4 ppb was produced by a Milli-QTM Advantage A10 (Millipore, United States) water purification system.
Glass coverslips (15- or 25-mm diameter) were rinsed in ethanol in a biosafety cabinet. Standard microscope slides were rinsed with ethanol prior to being cleaned using ∼2 M KOH solution followed by 2 min of air plasma cleaning (Harrick, United States).
Methods
Development of a Simple Biological Model System
Type I collagen was selected for this investigation as it is the archetypical form and the most common type of collagen in the body. Samples were prepared by compressing a gel composed of type I rat tail collagen. All reagents were maintained on an ice/water mixture to prevent gelation. Aliquots (1.6 ml) of the neutralized collagen solution were placed in 24 well plates each containing a cleaned (15 mm diameter) glass coverslip. Immediately after addition of the collagen gel solution to the wells, the plate was placed in an oven at 37°C for 15 min to facilitate gelation. RAFT™ absorbers designed for use with 24 well plates were placed on the gels for 15 min prior to being removed. Gels (15 mm in diameter and 1–2 mm thick) were carefully removed from 24 well plates and placed in a clean glass Petri dish containing PBS and stored at 4°C until analyzed. This procedure was repeated with 8–11 mg/ml collagen solution.
Gels were analyzed within 4–6 weeks of preparation and showed consistent results in this time frame, demonstrating sample stability. After 8 weeks of storage, nanomechanical analysis showed significant variation. Samples older than 6 weeks were therefore not included in this investigation.
Cross-linking of Samples
Samples were cross-linked by submerging for 30 min in 2.5% glutaraldehyde in PBS. Cross-linking is reversed by hydrolysis occurring in aqueous storage and significant changes were observable as a function of time, with the stiffness of 10-day-old samples reverted to near normal (i.e., non-cross-linked). All analyses on cross-linked samples were therefore conducted within 3 days of cross-linking, at which time only minimal variation was observed.
Nanomechanical Evaluation of Model Samples
A NanoWizard 3 BioScience AFM with a Vortis SPM controller with a closed loop in all three axes (JPK, Germany) mounted on an active anti-vibration table was used. Quantitative Imaging (QI™) mode was used to collect multiple 3 μm × 3 μm and 256 pixel × 256 pixel resolution scans using the liquid cell with PBS (JPK, Germany). A maximum loading force was selected to be 1 nN, allowing for indentation of 100–200 nm (i.e., 0.01–0.02% of sample thickness, enabling the modulus’ plateau of the sample to be identified without interference from the cover slip supporting the sample). ScanAsyst Fluid+ (Bruker, United States) silicon nitride cantilevers of a nominal spring constant of 0.7 N/m and resonance frequency of 150 kHz were used to collect the AFM images. The cantilever’s tip was of pyramidal geometry, however the indentation depths were much less than the height of the tip (100–200 nm << 2.5–8.0 µm), thus the geometry approximated that of a conical tip (at that scale) and was modelled as such. To approximate the pyramid as a cone, the geometries must have comparable surface area, which can be derived from the half angles to edge, β, for the pyramid (Eq. 1) and the conical half angle, α, (Eq. 2), at a given indentation, δ, as shown below. Pyramidal surface area, SP:
Conical surface area, SC:
Solving for α by using equivalency when β = 18.75° yields
Commonly the Hertz model of contact mechanics is used in the analysis of biological systems under physiological conditions. The original Hertzian model relates to the indentation of an entirely linear-elastic half-space of infinite size and spherical geometry for a homogenous and isotropic sample [25]. Since the biological samples are non-homogenous and anisotropic it should be noted that the Hertz model (and any other model developed for “ideal” systems) is merely an approximation. In the Hertz model, the applied loading force, F, is proportional to the elastic modulus E). Other variables in the equation below that defines this relationship are the Poisson’s ratio (ν), radius of the spherical indenter (R), the contact area (a) and the indentation depth (δ).
During indentation with a sharp probe however, the depth travelled would render the relevant geometry quite different to that of a sphere and this problem has been considered in the literature. As a result, the Hertz model can be extended to cover conical geometry, and this extension is generally referred to as the Sneddon model:
This Hertz/Sneddon model was used to compute the moduli values in this work. Please note that since we are not working with homogenous and isotropic samples, we will not refer to these moduli as “Young's moduli” but rather as effective moduli.
Spectroscopic Investigation
Attenuated total reflection (ATR) is a sampling technique used alongside traditional Fourier-transform infrared spectroscopy (FTIR) allowing investigation of the changes in the chemical environment of samples. A Nicolet Magna-Infrared 750 Spectrometer (Thermo-Fisher Scientific, Australia) was fitted with a fast IR single reflection attenuated total reflectance (ATR) accessory (Harrick Scientific, United States). The element mounted in the accessory was a zinc selenide (ZnSe) ATR crystal. Spectra were acquired from 512 scans over the range of 4000–600 cm−1 at a resolution of 4 cm−1.
Spectra were acquired in a specific order to facilitate processing at later stages: 1) a background spectrum of the ZnSe crystal was taken first after a 15-min purge of the chamber with compressed air 2) a water vapor scan after another 15-min purge of the chamber with compressed air 3) a scan of 1× PBS solution placed on the ZnSe crystal face 4) three successive scans of the collagen sample after an initial 15-min purge.
Collagen samples attached to the 15 mm glass coverslips were placed collagen side down on the ZnSe crystal element in PBS. The sample was pressed firmly against the surface to ensure good adhesion to the crystal face to maximize signal, but not so firmly as to squeeze the sample or the fluid from between the coverslip and ZnSe crystal. Samples were analyzed in triplicate.
Results and Discussion
Analysis of Low-Density and High-Density Collagen Matrices by AFM
After establishing the appropriate indentation depth and evaluation of the impact of viscoelasticity (see section “Impact of depth dependence and viscoelasticity” in Supporting Information) the effective modulus data were extracted from Quantitative Imaging (QI) AFM experiments using the Sneddon model for conical probe geometry. Collagen samples prepared from 2 mg/ml solutions were evaluated first, as they exhibited the simplest behavior, i.e., a simple bimodal distribution which could be modelled as a two term Gaussian function. An example of the fit for untreated collagen samples is presented in Figure 1. There was some variation of the intensities of the two Gaussian curves shown by differing a1:a2 ratios between independent repeats. Even though that alters the appearance of the histogram upon visual inspection, the centroids and spread remain similar between samples. The b values represent the peak effective elastic modulus values, which were held constant between samples in the untreated low-density group for both peaks (95% Confidence Interval: b1 = 38–58 kPa, b2 = 137–165 kPa). In all cases the spread, c, of the higher effective modulus peaks was larger than that for peaks of lower effective modulus i.e., c1<c2<…<ci.
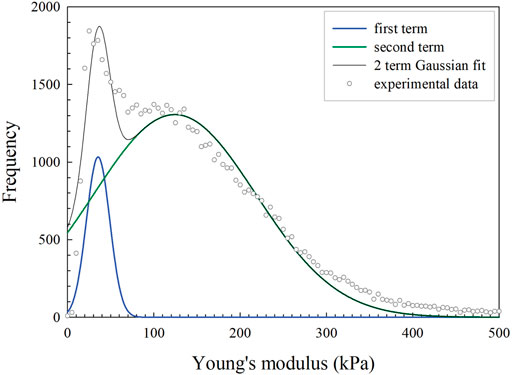
FIGURE 1. An example of a typical frequency set from histogram data of a single image of an untreated collagen prepared from 2 mg/ml solution (grey open circles). There are clearly two peaks and their approximate locations were used as initial guesses for b values for a two term Gaussian model (black line). The individual contributions from the softer peak (blue line) and the stiffer peak (green line) can be seen underneath the two term Gaussian model.
High density gels (i.e., those prepared from 8.56 mg/ml collagen solution) were evaluated identically and exhibited the same bimodal distribution as their lower density counterparts, similar variation in intensity ratios and an identical trend in spread. The peak effective modulus values for the model were then extracted for frequency set (95% Confidence Interval: b1 = 49–59 kPa, b2 = 159–217 kPa; see section “Modelling and statistical analysis of collagen I gels” in Supporting Information for more details). While the average values of effective modulus for the first peak are, within experimental error, the same for low (gels prepared from 2 mg/ml collagen solution) and high (gels prepared from 8.56 mg/ml collagen solution) density gels, there is a significant difference in the second peak with the average values of effective modulus for the second peak being higher for high density gel. Since the density of collagen fibers appears to influence the second peak, it follows that this peak is likely related to the way collagen fibers are assembled within the gels, while the first peak being the same (within the bounds of experimental error), irrelevant of collagen density gels, is likely related to the gaps between fibrils (or areas of very low collagen fibril concentration) filled with liquid. Similar bimodal distribution of moduli was recently observed by Gisbert et al. [26], who analyzed the changes in the mechanical properties associated with the early stages of collagen assembly on a mica surface (we note that the authors report much higher modulus values, which are most likely due to the effect of the substrate stiffness as only single fibers rather than a thick collagen gel layer were analyzed). Gisbert et al. attributed the lowest moduli values to the gaps (between d-spacing) and the presence of monomers. The self-assembly of collagen and the formation of the overlap regions resulted in a modulus shift towards higher values.
Effects of Glutaraldehyde Cross-Linking on the Mechanical Properties of Collagen Matrices
Most cross-linked samples demonstrated very different effective modulus distribution to non-cross-linked samples, either showing discrete peaks or obvious shoulders at three to four places. Peaks could be observed at 17–61, 111–217, 298–393, and 590–1161 kPa. Cross-linked samples showed higher mean stiffness compared to non-cross-linked counterparts, but there was partial preservation of the peak contributions identified from the histograms of non-cross-linked samples. As such, a four term Gaussian equation was selected to model these contributions and the peak values of bi were recorded, where i is a number between 1 and 4 depending on the location of the peak. An example of this fitted model is provided in Figure 2A. There was a notable variation between profiles observed in the histograms both within and between samples that were analyzed. Fitting was successful for the more defined data sets and the values obtained were used to constrain the fitting coefficients for the more convoluted frequency sets, an example of which is shown in Figure 2B. It should be noted that not all image fields showed all four peaks, indicating substantial heterogeneity of cross-linking and consequent effects on the distribution of effective modulus values. More detailed analysis of the first two peaks is presented in the Supporting Information.
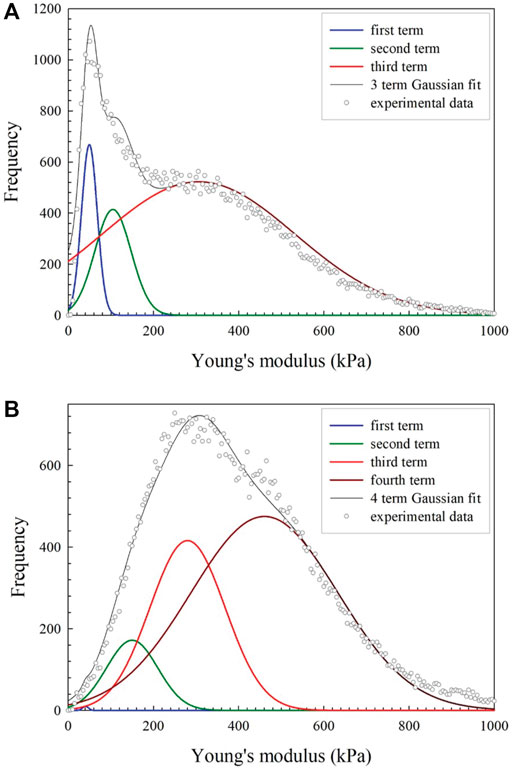
FIGURE 2. Examples of three and four term Gaussian models fit to (A) a simpler and more clearly defined frequency set which was used to set the bound for (B), a more complicated and convoluted frequency set.
AFM Image Analysis
To help with the comparison between untreated and cross-linked samples, QI AFM maps were processed (using ImageJ software) to clearly show effective modulus distribution by location in a particular field. For simplicity, three effective modulus ranges were selected to be used in all image processing. The ranges chosen were: 0–60, 61–225 and 226+ kPa, representing the bulk of the contributions from the first, second and third-fourth terms (if present in field) in histograms, respectively.
To harmonize the pixel value with the histogram bin numbers (i.e., 5 kPa increments) JPK DP was used to set image color to gray scale, and a set range from 0–1280 kPa. Since the program exports the map as an 8-bit image, each change in gray level corresponds to a 5 kPa change in effective modulus. This image file was then imported into ImageJ where the image was thresholded using the over-under approach with manually selected grey levels that correlate to the three ranges previously identified. The three images were then superimposed in a Red-Green-Blue (RGB) format with each range assigned a different color. The resulting image shows a topographical distribution of effective modulus ranges of interest. Representative images are provided in Figures 3–5 including the effective modulus map with fixed range, RGB image and corresponding height maps. The three figures correspond to the 2.0 mg/ml untreated group, 8.56 mg/ml untreated group, and the cross-linked groups. Since the two cross-linked groups were identical in the statistical analysis for all peaks, they are represented here by a single image.
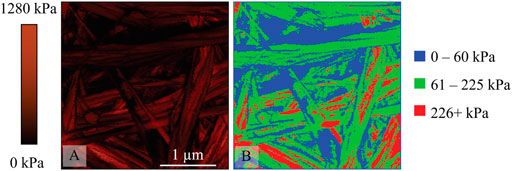
FIGURE 3. A non-cross-linked collagen sample prepared from 2 mg/ml solution (A) 3 μm × 3 μm effective modulus map from QI data with fixed range of 0–1280 kPa (B) 3 μm × 3 μm RGB image where blue represents 0–60 kPa regions, green 61–225 kPa regions, and red 226+ kPa regions.
When considering untreated groups (Figures 3, 4), it is apparent from the RGB map (panel B in both figures) that a majority of the collagen features are green, indicating that they belong to the 61–225 kPa range, approximating the spread of the second peak from the model. There are some areas of red that belong to the 226+ kPa range, with a higher proportion of red for the 8.56 mg/ml sample when compared to the 2 mg/ml sample. This is reflected in the peak shift of the second term detected in the data modelling (see Supporting Information). AFM images illustrate that there are points and segments on some collagen fibers and bundles that are relatively stiffer than the remainder of those features. The blue areas represent regions between the range 0–60 kPa (low stiffness) covered by the first term of the model. Additionally, there are areas within fibers and bundles that are softer than the surrounding fibrous structures.
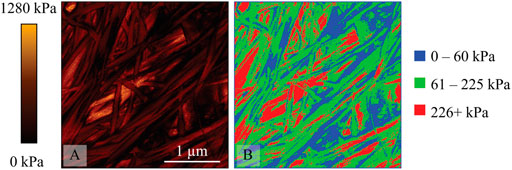
FIGURE 4. A non-cross-linked collagen sample prepared from 8.56 mg/ml solution (A) 3 μm × 3 μm effective modulus map from QI data with fixed range of 0–1280 kPa (B) 3 μm × 3 μm RGB image where blue represents 0–60 kPa regions, green 61–225 kPa regions, and red 226+ kPa regions.
Figure 5 shows a cross-linked group, and there are some interesting and notable differences between these data and that obtained from the non-cross-linked group. The most obvious is the substantial increase in the proportion of red (high stiffness) observed in collagen fibers and bundles, which now forms most collagen-related features. This shows a large increase in overall collagen effective elastic modulus in contrast with non-cross-linked groups, which is consistent with the expectation that cross-linking increases stiffness. Interestingly there are still significant areas of medium stiffness (green) present on collagen structures, showing that not all segments of the collagen have increased stiffness following cross-linking. Also of interest are the features that would normally be attributed to holes or soft spots based on the effective modulus and height map correlation. These appeared as areas of low stiffness (blue) in non-cross-linked groups. However, such areas of low stiffness on the fibers and bundles are rare in cross-linked samples, with low-density areas largely represented in green, denoting medium stiffness. Even in the case of a bimodal distribution for the untreated samples, there is a significant tail in the 226+ kPa region as seen in Figure 1. When considering the effect of the cross-linking on the distribution of effective modulus values, a heterogeneous effect is observed on the collagenous features within the samples indicated by the distribution of red vs. green (61–225 kPa). There could be a variety of factors influencing why certain segments and points of the collagenous features are more susceptible to the effects of cross-linking than others, including the distribution of amino acid residues, which can be subjected to aldol condensation or the formation of Schiff bases or other types of biochemical modifications. Of particular interest is the region of 0–60 kPa (blue) between all the groups and how they are reported in the literature. There are some studies discussing the non-cross-linked collagenous systems that have also detected this bimodal distribution of elastic moduli. In the older literature this is often attributed to the presence of proteoglycan (PG) networks throughout the extracellular matrix. Loparic et al investigated a tissue sample of articular cartilage using micro- and nanoscale indentation type AFM and modelled it with an agarose/chondroitin sulfate gel with an interwoven poly(ethyleneglycol)-terepthalate/poly(butylene)-terepthalate block copolymer fibril network [27]. The authors observed good agreement between the models indicating that AFM could detect the differences of composite networks in this way. In addition, they changed the ionic strength of the solution, which significantly shifted the softer effective modulus peaks providing further evidence that PG networks were detected in these low-density areas. Further, Loparic et al provided a convincing argument by substantiating their findings with a block copolymer gel model to mimic the interwoven PG and collagen network structures, which produced a similar finding of a bimodal effective modulus distribution at the nanoscale [27].
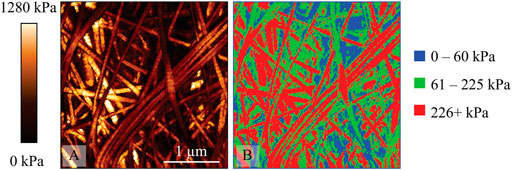
FIGURE 5. A cross-linked collagen sample prepared from 2 mg/ml solution (A) 3 μm × 3 μm effective modulus map from QI data with fixed range of 0–1280 kPa (B) 3 μm × 3 μm RGB image where blue represents 0–60 kPa regions, green 61–225 kPa regions, and red 226+ kPa regions.
Our data suggest that collagen alone could be the source of the two characteristic peaks that are present in these systems. When considering the experiments with the cross-linked collagen, several things become clear. The first is that the introduction of glutaraldehyde fixation significantly modifies the nanomechanical profile of the system. Consistent with previously reported findings, we also demonstrated that the disruption of the nanomechanical profile is never the same between samples or even fields within samples, and glutaraldehyde has a highly heterogeneous effect on the collagen fibers as shown not only in their greatly varying effective modulus histograms, but also graphically through the image analysis, which shows that the level of stiffening introduced by cross-linking is likely context dependent.
FTIR Spectroscopy of Untreated Collagen Samples
To establish the reliability of the spectra, the reproducibility between samples was evaluated. Spectra were normalized in the Omnic software to the intensity of the amide I peak (the highest absorbance value in all samples). Twelve spectra derived from four samples were superimposed to identify any characteristic differences, particularly in the amide I band. As can be seen in Figure 6, upon visual inspection there is no significant deviation from the general profile among the 11 FTIR spectra. There are, however, variations in the intensities of the peaks at certain locations, which is particularly noticeable in the 1100–1000 cm−1 region, indicating some heterogeneity in proportions of components between the samples (note: the three scans that are significantly lower belong to one sample, which appeared to have a lower proportion of carbohydrate moieties than other samples). The maximum absorbance values of all normalized spectral peaks were recorded, and descriptive statistics calculated, results of which are shown in Table 1. These results permit comparison with spectra from cross-linked samples, which will be detailed in the next section.
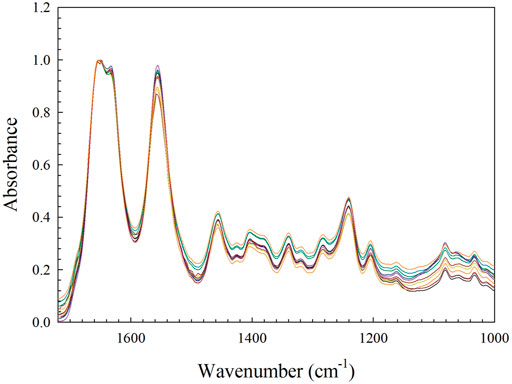
FIGURE 6. A sample of 11 normalized FTIR spectra of untreated collagen gels, superimposed to demonstrate reproducibility.
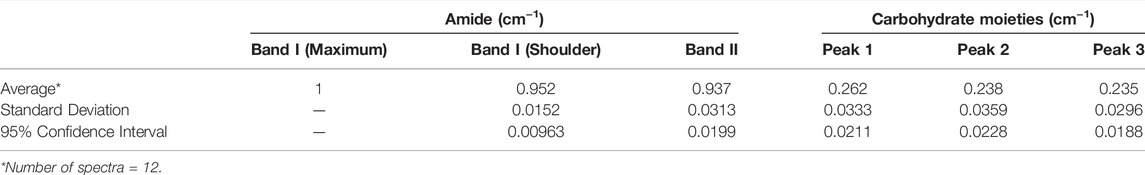
TABLE 1. Descriptive statistics of maximum infrared absorbance values obtained from normalized spectra acquired from non-cross-linked collagen gel samples.
The amide I region (1720–1500 cm−1) was used for detailed comparison between the spectra, as this region is the most studied and understood for proteinaceous samples. The second derivative of the data in this region was taken using the peak resolve feature in Omnic software and is shown in Figure 7. The five strongest peaks and shoulders in the second derivative spectrum peaks correspond to the locations of all five key protein secondary structural features identified in the literature. These values are summarized in Table 2. The amide I band was then modelled with five Gaussian/Lorentzian peaks at the locations of key protein secondary structural features identified in the second derivative spectrum with an applied constant baseline correction calculated by the software from the >1700 cm−1 region. An additional peak was placed at ∼1600 cm−1 to account for an absorption measured in the transition between the amide I and amide II bands, which was also modelled using peak assignments guided by the literature and the second derivative spectrum of the 1720–1500 cm−1 region, shown in Figure 8A. This peak is necessary, as using a linear fit to the baseline greatly perturbs the absorbance values at lower wavenumbers, which could potentially lead to unreliable ratios of the absorbance secondary features, and as such is not recommended by the software developer [28]. It should be noted that for the amide II peak, the deconvoluted component peaks converged on two locations at ∼1556 and ∼1525 cm−1. These locations correspond to the N-H bending and C-H stretching vibrational modes respectively. The ∼1556 cm−1 peak is a combination of the hydrogen bonding network of water bridges that form around the protein (∼1560 cm−1) and the N-H bend, and can be seen by a shoulder in the second derivative spectrum at ∼1540 cm−1. This peak did not converge and instead shifted to 1520 cm−1. This suggests that using this peak to evaluate the presence of glutaraldehyde cross-linking may not be practical given the strong signal of the hydration bridges. The third peak converges at ∼1500 cm−1 and is related to another transition region [29]. The resulting model (Figures 8A,B) fits quite well to the experimental data as shown in Figures 8C,D.
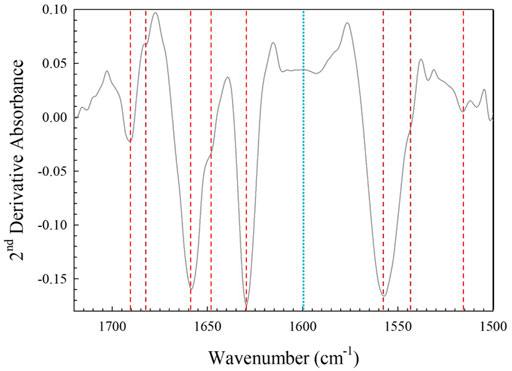
FIGURE 7. Second derivative spectrum of the amide I and II band region. The main peaks identified from amide I (1690, 1682, 1658, 1646 and 1630 cm−1) and II (1556, 1556, and ∼1525 cm−1) second derivative spectrum (red dashed lines) and peak corresponding to areas where absorbance is measured between main peaks (blue dotted line).
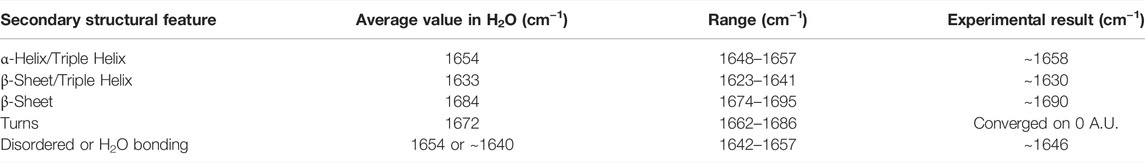
TABLE 2. Average peak values for spectra of hydrated collagen films after background electrolyte and water vapor spectral subtraction, determined experimentally and using corresponding values reported in the literature [21, 22].
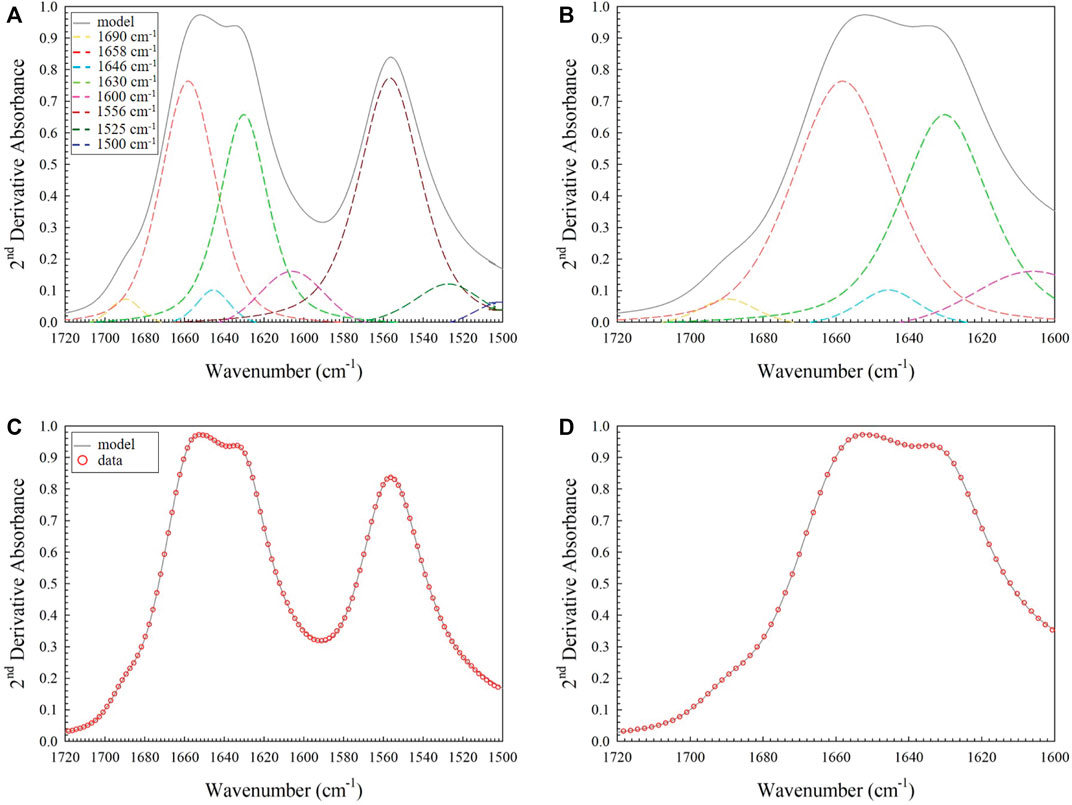
FIGURE 8. (A) Example spectrum of the amide I and II bands found in untreated collagen gels. Three peaks were introduced to generally account for the amide II band at ∼1556, ∼1525 and ∼1500 cm−1 with another peak at ∼1600 cm−1 in the transition region between amide I and amide II bands; (B) Fit of the four peaks with non-zero peak area identified in the amide I region only (1690, 1658, 1646 and 1630 cm−1 – the peak due to protein secondary structure termed “turns” did not produce a non-zero area in fitting); (C) Fit of the model (grey line) to the data (red open circles) for the amide I and II band region; (D) Fit of the model (grey line) to the data (red open circles) for the amide I only.
After applying this fit, four secondary feature peaks converged at non-zero absorbance values corresponding to component peaks of the deconvoluted amide I bands identified in the literature. The fifth converged on zero absorbance indicating that there were only four quantifiable component peaks in the amide I band of this data. Once the individual peaks of samples had been identified in the first sample, the process was repeated for all acquired spectra with the model fitting well in all cases. Normalized peak height values were recorded as a function of wavenumber.
Effects of Glutaraldehyde Cross-linking on Chemical Characteristics
To determine whether chemical cross-linking changed the secondary structural characteristics of collagen, the amide I band was deconvoluted using the same five component peak assignments from the non-cross-linked samples (Figures 9A,B). The peak ratio to be considered for evidence of the influence of cross-linking was the 1658/1690 cm−1 ratio. This was primarily due to a significant number of studies showing that the 1660/1690 cm−1 ratio correlates with the degree of cross-linking within a sample. There is evidence that this could be representative of the proportion of non-reducible pyridinoline (Pyr) to reducible dehydrodihydroxynorleucine (deH-DHLNL) cross-links within the collagen [21, 30]. Whilst glutaraldehyde-mediated cross-links may not precisely reflect the absorption profile when compared to Pyr, a reduction in the number of reducible deH-DHLNL cross-linked sites would still be expected as they would be consumed during the reaction with the glutaraldehyde. Therefore, we expect a higher ratio after cross-linking as the reducible cross-link sites would be consumed in the process. There is also evidence that the 1660/1690 cm−1 ratio is related to other aspects of secondary structural features and not Pyr/deH-DHLNL ratios. The set of peak values was analyzed statistically to produce the results in Table 3. Although there is a trend towards a higher peak ratio in the cross-linked samples compared to non-cross-linked collagen, the standard deviation values are large enough that they are within each other’s error bounds. FTIR spectroscopy therefore appears to be less sensitive to the effect of cross-linking on the properties of collagen compared to nanomechanical AFM measurement.
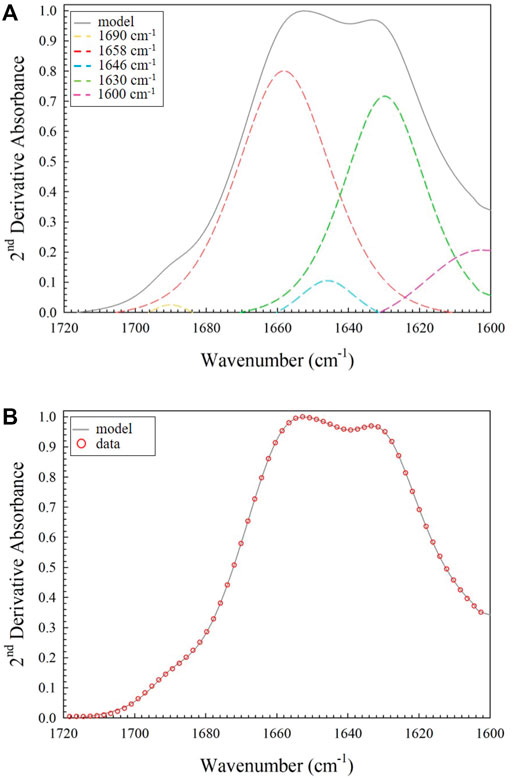
FIGURE 9. (A) Fit of the four non-zero area peaks identified in the amide I region only (1690, 1658, 1646 and 1630 cm−1 – also included is the 1600 cm−1 transition peak used to model the shape between the amide I and II regions); (B) Fit of the model (grey line) to the data (red open circles) for the amide I only. The most striking difference is the significantly smaller component peak in the 1690 cm−1 region.
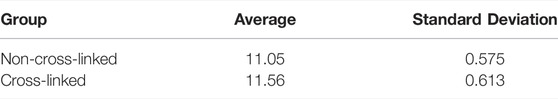
TABLE 3. Results from the 1658/1690 cm−1 ratio comparison between non-cross-linked and cross-linked, hydrated collagen gels.
Conclusion
The AFM nanomechanical mapping revealed that non-cross-linked collagen gels had a simple, bi-modal distribution of effective modulus values and that chemical cross-linking introduced stiffening as evidenced by a shift of effective modulus values higher, accompanied by a more heterogeneous distribution of peaks. Our experimental approach therefore establishes a methodological framework for the analysis of collagen-rich ECM structures from tissues using AFM nanomechanical mapping, and provides a reference modulus distribution for pure collagen structures to be used as a comparator in such analyses. Laboratory-based FTIR spectroscopy has proven to be less sensitive to the effects of cross-linking on the properties of collagen compared to nanomechanical AFM measurement. Although there was a trend towards a higher peak ratio for the relevant IR absorbances in the cross-linked samples compared to non-cross-linked collagen, the SD values were large enough that they are within each other’s error bounds. Imaging spectroscopy of collagen fibers may allow better correlation with nanomechanical imaging, but it is not possible using conventional FTIR microscopy to obtain spectra from specific strands of collagen, such as those visualized by AFM. More advanced forms of vibrational microscopy (such as tip-enhanced Raman spectroscopy) may be required to better correlate chemical and physical characterization of collagen.
Data Availability Statement
The raw data supporting the conclusions of this article will be made available by the authors, without undue reservation.
Author Contributions
BL: Methodology, Investigation, Writing; NP: Methodology, Investigation; JK: Methodology, Investigation; SB: Methodology, Investigation; DB: Conceptualization, Methodology, Investigation, Resources, Supervision; MK: Conceptualization, Methodology, Investigation, Resources, Supervision, Writing; MS: Conceptualization, Methodology, Investigation, Resources, Supervision, Writing.
Funding
BL was supported by a scholarship via the Australian Government’s Research Training Program; SB was supported by an early career fellowship from the Royal Adelaide Hospital Research Fund; DB, MK, and MS were supported by a Research Themes Investment Scheme seed funding grant from the University of South Australia. MS was supported by an ARC Future Fellowship (FT120100132) and project grant funding from the National Health and Medical Research Council (NHMRC, GNT1103712, GNT1103713, GNT1145319), the Beat Cancer Project of the Cancer Council of South Australia, the VONBRI Foundation and The Hospital Research Foundation.
Conflict of Interest
The authors declare that the research was conducted in the absence of any commercial or financial relationships that could be construed as a potential conflict of interest.
Publisher’s Note
All claims expressed in this article are solely those of the authors and do not necessarily represent those of their affiliated organizations, or those of the publisher, the editors and the reviewers. Any product that may be evaluated in this article, or claim that may be made by its manufacturer, is not guaranteed or endorsed by the publisher.
Acknowledgments
The authors wish to thank support staff at the Centre for Cancer Biology and the Future Industries Institute for their efforts in facilitating our research.
Supplementary Material
The Supplementary Material for this article can be found online at: https://www.frontiersin.org/articles/10.3389/fphy.2022.835038/full#supplementary-material
References
1. Gasiorowski JZ, Murphy CJ, Nealey PF. Biophysical Cues and Cell Behavior: the Big Impact of Little Things. Annu Rev Biomed Eng (2013) 15:155–76. doi:10.1146/annurev-bioeng-071811-150021
2. Mouw JK, Ou G, Weaver VM. Extracellular Matrix Assembly: a Multiscale Deconstruction. Nat Rev Mol Cel Biol (2014) 15(12):771–85. doi:10.1038/nrm3902
3. Leitinger B, Hohenester E. Mammalian Collagen Receptors. Matrix Biol (2007) 26(3):146–55. doi:10.1016/j.matbio.2006.10.007
4. Thompson WR, Rubin CT, Rubin J. Mechanical Regulation of Signaling Pathways in Bone. Gene (2012) 503(2):179–93. doi:10.1016/j.gene.2012.04.076
5. Johan MZ, Samuel MS. Rho-ROCK Signaling Regulates Tumor-Microenvironment Interactions. Biochem Soc Trans (2019) 47(1):101–8. doi:10.1042/bst20180334
6. Panciera T, Azzolin L, Cordenonsi M, Piccolo S. Mechanobiology of YAP and TAZ in Physiology and Disease. Nat Rev Mol Cel Biol (2017) 18(12):758–70. doi:10.1038/nrm.2017.87
7. Samuel MS, Lopez JI, McGhee EJ, Croft DR, Strachan D, Timpson P, et al. Actomyosin-Mediated Cellular Tension Drives Increased Tissue Stiffness and β-Catenin Activation to Induce Epidermal Hyperplasia and Tumor Growth. Cancer Cell (2011) 19(6):776–91. doi:10.1016/j.ccr.2011.05.008
8. Ibbetson SJ, Pyne NT, Pollard AN, Olson MF, Samuel MS. Mechanotransduction Pathways Promoting Tumor Progression Are Activated in Invasive Human Squamous Cell Carcinoma. Am J Pathol (2013) 183(3):930–7. doi:10.1016/j.ajpath.2013.05.014
9. Gaub BM, Müller DJ. Mechanical Stimulation of Piezo1 Receptors Depends on Extracellular Matrix Proteins and Directionality of Force. Nano Lett (2017) 17(3):2064–72. doi:10.1021/acs.nanolett.7b00177
10. Dzamba BJ, DeSimone DW. Extracellular Matrix (ECM) and the Sculpting of Embryonic Tissues. Curr Top Dev Biol (2018) 130:245–74. doi:10.1016/bs.ctdb.2018.03.006
11. Hayward M-K, Muncie JM, Weaver VM. Tissue Mechanics in Stem Cell Fate, Development, and Cancer. Dev Cell (2021) 56(13):1833–47. doi:10.1016/j.devcel.2021.05.011
12. Rath N, Morton JP, Julian L, Helbig L, Kadir S, McGhee EJ, et al. ROCK Signaling Promotes Collagen Remodeling to Facilitate Invasive Pancreatic Ductal Adenocarcinoma Tumor Cell Growth. EMBO Mol Med (2017) 9(2):198–218. doi:10.15252/emmm.201606743
13. Boyle ST, Mittal P, Kaur G, Hoffmann P, Samuel MS, Klingler-Hoffmann M. Uncovering Tumor-Stroma Inter-relationships Using MALDI Mass Spectrometry Imaging. J Proteome Res (2020) 19(10):4093–103. doi:10.1021/acs.jproteome.0c00511
14. Krasowska M, Niecikowska A, Beattie DA. Challenges in Imaging of Soft Layers and Structures at Solid Surfaces Using Atomic Force Microscopy. Surf Innov (2014) 2(3):151–9. doi:10.1680/si.13.00043
15. Benbow NL, Sebben DA, Karpiniec S, Stringer D, Krasowska M, Beattie DA. Lysozyme Uptake into Pharmaceutical Grade Fucoidan/chitosan Polyelectrolyte Multilayers under Physiological Conditions. J Colloid Interf Sci (2020) 565:555–66. doi:10.1016/j.jcis.2020.01.030
16. Li QS, Lee GYH, Ong CN, Lim CT. AFM Indentation Study of Breast Cancer Cells. Biochem Biophys Res Commun (2008) 374(4):609–13. doi:10.1016/j.bbrc.2008.07.078
17. Thomas G, Burnham NA, Camesano TA, Wen Q. Measuring the Mechanical Properties of Living Cells Using Atomic Force Microscopy. J Vis Exp (2013)(76):50497. doi:10.3791/50497
18. Acerbi I, Cassereau L, Dean I, Shi Q, Au A, Park C, et al. Human Breast Cancer Invasion and Aggression Correlates with ECM Stiffening and Immune Cell Infiltration. Integr Biol (2015) 7(10):1120–34. doi:10.1039/c5ib00040h
19. Lopez JI, Kang I, You W-K, McDonald DM, Weaver VM. In Situforce Mapping of Mammary Gland Transformation. Integr Biol (2011) 3(9):910–21. doi:10.1039/c1ib00043h
20. Plodinec M, Loparic M, Monnier CA, Obermann EC, Zanetti-Dallenbach R, Oertle P, et al. The Nanomechanical Signature of Breast Cancer. Nat Nanotech (2012) 7(11):757–65. doi:10.1038/nnano.2012.167
21. Vidal BC, Mello ML. Collagen Type I Amide I Band Infrared Spectroscopy. Micron (2011) 42(3):283–9. doi:10.1016/j.micron.2010.09.010
22. Barth A. Infrared Spectroscopy of Proteins. Biochim Biophys Acta (BBA) - Bioenerg (2007) 1767(9):1073–101. doi:10.1016/j.bbabio.2007.06.004
23. Depalle B, Qin Z, Shefelbine SJ, Buehler MJ. Influence of Cross-Link Structure, Density and Mechanical Properties in the Mesoscale Deformation Mechanisms of Collagen Fibrils. J Mech Behav Biomed Mater (2015) 52:1–13. doi:10.1016/j.jmbbm.2014.07.008
24. Yang L, van der Werf KO, Fitié CFC, Bennink ML, Dijkstra PJ, Feijen J. Mechanical Properties of Native and Cross-Linked Type I Collagen Fibrils. Biophys J (2008) 94(6):2204–11. doi:10.1529/biophysj.107.111013
26. Gisbert VG, Benaglia S, Uhlig MR, Proksch R, Garcia R. High-Speed Nanomechanical Mapping of the Early Stages of Collagen Growth by Bimodal Force Microscopy. ACS Nano (2021) 15(1):1850–7. doi:10.1021/acsnano.0c10159
27. Loparic M, Wirz D, Daniels AU, Raiteri R, Vanlandingham MR, Guex G, et al. Micro- and Nanomechanical Analysis of Articular Cartilage by Indentation-type Atomic Force Microscopy: Validation with a Gel-Microfiber Composite. Biophys J (2010) 98(11):2731–40. doi:10.1016/j.bpj.2010.02.013
28. Bradley M. Curve Fitting in Raman and IR Spectroscopy: Basic Theory of Line Shapes and Applications. Madison, USA: Thermo Fisher Scientific (2007). p. 50733. Application Note.
29. Mallamace F, Baglioni P, Corsaro C, Chen SH, Mallamace D, Vasi C, et al. The Influence of Water on Protein Properties. J Chem Phys (2014) 141(16):165104. doi:10.1063/1.4900500
Keywords: extracellular matrix, collagen, atomic force microscopy (AFM), fourier transform infrared spectroscopy (FTIR), nanomechanical properties
Citation: Le Cerf BA, Pyne NT, Kular J, Boyle ST, Beattie DA, Krasowska M and Samuel MS (2022) Nano-Mechanical Analyses of Native and Cross-Linked Collagen I Matrices Reveal the Mechanical Complexity of Homogenous Samples. Front. Phys. 10:835038. doi: 10.3389/fphy.2022.835038
Received: 14 December 2021; Accepted: 09 June 2022;
Published: 29 June 2022.
Edited by:
Arlette R.C. Baljon, San Diego State University, United StatesReviewed by:
Horacio Lopez-Menendez, Complutense University of Madrid, SpainRiaz Akhtar, University of Liverpool, United Kingdom
Aaron Elbourne, RMIT University, Australia
Copyright © 2022 Le Cerf, Pyne, Kular, Boyle, Beattie, Krasowska and Samuel. This is an open-access article distributed under the terms of the Creative Commons Attribution License (CC BY). The use, distribution or reproduction in other forums is permitted, provided the original author(s) and the copyright owner(s) are credited and that the original publication in this journal is cited, in accordance with accepted academic practice. No use, distribution or reproduction is permitted which does not comply with these terms.
*Correspondence: Marta Krasowska, TWFydGEuS3Jhc293c2thQHVuaXNhLmVkdS5hdQ==; Michael Susithiran Samuel, TWljaGFlbC5TYW11ZWxAdW5pc2EuZWR1LmF1