 Jiang Wu
 Lijun Mu1
 Dazhong Ren
 Zhenze Wang
- 1Changqing Oilfield Company, PetroChina, Xi’an, China
- 2Department of Petroleum Engineering, Xi’an Shiyou University, Xi’an, China
- 3State Key Laboratory of Continental Dynamics and Department of Geology, Northwest University, Xi’an, China
The main exploring technology of No.7 Yanchang Formation of the Triassic reservoir in the Ordos Basin adopts quasi-natural downhole energy driven by volume fracturing, and the region production thus cannot be improved by an injection well network. Enhanced oil recovery (EOR) has been carried out through an enhanced imbibition process during reservoir stimulation work. To further understand the oil-water displacement mechanism, a thin-cut chips of shale imbibition experimental study was carried out. Simultaneously, nuclear magnetic resonance (NMR) changes of the fluid within the pores of chips were measured. This method was used to evaluate the application effect of imbibition surfactant in use, and the field practice was compared and analyzed by means of a chemical tracer among dozens of clusters in the same horizontal well.
Introduction
The active No.7 Yanchang Formation of the Triassic source rock play, located in the west-central Ordos Basin region, is a significant unconventional reservoir that occupies more than 370 thousand square kilometers covering more than five provinces of Northwest China. No.7 Yanchang Formation is made of organic-rich fine sandstones, siltstones, and mudstones with present-day total organic carbon (TOC) values of up to 2–22 wt% with an average level of 13.8%. The formation ranges in depth from 2000 to 2,500 m with a downhole temperature between 57.2 and 75.2°C and pressure coefficient as low as 0.74–0.82.
Notably, decades ago, shales here were seldom considered valuable reservoirs. The petrophysical properties of shales, such as ultra-low permeability, heterogeneous mineralogy, and pole structure complexity made conventional water injection-production systems unavailable and resulted in recovery factors typically below 10%. Thus, horizontal drilling and multi-stage hydraulic stimulation technology has been employed for the last few decades to unlock significant hydrocarbon resources in low and ultra-low permeability (micro- and nano-Darcy) unconventional reservoirs.
To conquer the unavailability of effective water displacement exploration, surfactant solutions have been proposed to facilitate the imbibition of water into the shale matrix and thus enhance oil production [1–4]. As can be seen in Figure 1, the recovery mechanisms of surfactants are the rock-wettability change toward a more water-wet state and the comparation of interfacial tension (IFT) between the aqueous and oleic phases [5]. During the develop process of No.7 Yanchang Formation, surfactant assistant spontaneous imbibition (SASI) was introduced and an anionic-nonionic surfactant imbibition assistance reagent was applied in stimulation operation as the pad fluid [6, 7]. After the operation, wells were shut immediately for at least 10 days without flowback, to ensure the injected surfactant was thoroughly imbibed.
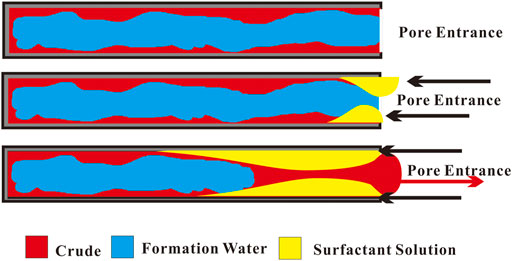
FIGURE 1. The hypothetical mechanism imbibition process.
In this work, three core chip samples were created and studied. Laboratory core flood experiments were performed on the chips with different permeability in the range 0.1–0.4 10−3 μm2. The core chips were enveloped and flooded with dyed oil or surfactant solution to experimentally simulate the imbibition process occurring downhole, and then each stage of the flood result was accumulated by color recognition software to calculate the residence volume. Nuclear magnetic resonance (NMR) measurements were conducted during every key status to image the imbibition quantity of the chips and confirm the visual interpretation values. Field application of the SASI operations vs. production rates was also compared and analyzed. The field practice of imbibition assistant reagent was compared by means of a chemical tracer among dozens of clusters in the same horizontal well.
Experiments
Core Chips Preparation
Several No.7 Yanchang Formation core chips with a range of permeability from 0.18 to 0.39 10−3 μm2 were used in this study. First, play rocks drilled from downhole were cut into same-sized rectangle chips to fit the flood item, and then were cleaned using toluene followed with methanol through the Soxhlet extraction apparatus at 65–70°C for 6 h. The dry weight, length, and diameter were measured. Basic petrophysical properties were measured by the same-positioned rock column core sample. The average petrophysical properties are listed in Table 1.
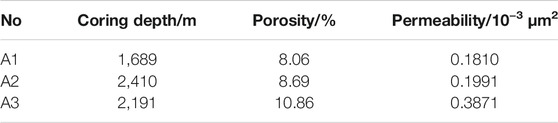
TABLE 1. Petrophysical properties of core chips used in imbibition test.
Surfactant
The amphiphilic structure of surfactant molecules can improve the wettability of the rock surface, increase hydrophilicity, and enhance imbibition efficiency. When reaching above the critical micelle concentration (CMC) value, the micelles make the rock become water wet. The performance of the imbibition assistance reagent applied in No.7 Yanchang Formation is mainly aimed at matching appropriate interfacial tension, rapidly changing wetting angle, and stabilizing adsorption, and its performance has been shown in Table 2 and described in detail within previous work [8, 9].
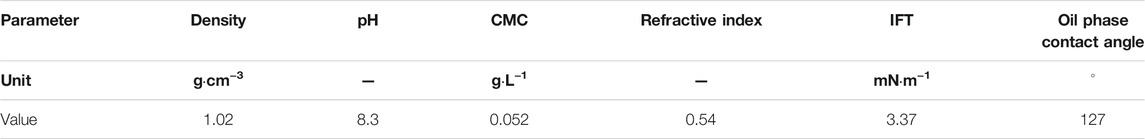
TABLE 2. Surfactant basic performance used for imbibition test.
Imbibition Runs Setup
The purpose of the experiment is to simulate the imbibition process of the reservoir during fracturing, shut-in, and production. In the field, surfactant solution is injected as pad fracturing fluid, which is then filtered into the matrix during the fracturing process, after that imbibition equilibrium is achieved by a shut-in well, and oil is recovered under normal formation energy. Hence an imbibition runs experiment consists of an imbibition cell with a photographic camera system to record and present each seepage step [10]. Two face-to-face pieces of glass are used to fix the core chips, with one end left on each side to connect the fluid, and both sides are vacuumed synchronously to ensure that the bond layer between glass and rock chip is as dense as possible. Then the imbibition unit is used to simulate the entire process through the following steps as shown in Figure 2, where capital letters W, V, S, O, and P stand for brine water, vacuum pump, surfactant solution, oil, and pressurize pump, respectively. An NMR scan of the core chips was conducted to detect water distribution in the pores of each step.
1) Vacuum. We clamped the A end hose with sealing pliers and connected the A end hose to a burette filled with brine water. Then, we connected the B end of the cell to the pump. We turned on the vacuum pump and vacuumed the cell for at least 5 h.
2) Saturate brine. We closed the sealing pliers at the B end of the cell, closed the vacuum pump, and then opened the sealing pliers at the A end of the cell to saturate the core chip with brine water, and shut A end when the water level of its container did not change significantly. This process simulates water filling rock pores first under geological conditions.
3) Saturate oil. We connected the A end of the cell with the oil (colored red), opened the sealing clamp of the B end of the cell, pressurized the oil of the A end of the cell, and made the oil enter the core chips. This step was finished when the B end of the cell produced oil and the color of the core did not change significantly. This process simulates the process of oil displacing water to occupy pores after oil generation.
4) Surfactant imbibition. We connected the A end of the cell with the colored surfactant solution, opened the sealing clamp of the B end of the cell, pressurized the waterway of the A end of the cell, and made the water enter the core chips. Then, we closed both ends for a certain time when the B end of the cell produced water and the color of chip did not change significantly. This step simulated the fracturing fluid entering the formation and remaining in the formation for a certain time during the development process (for shale cores in Ordos Basin, it is generally 50 h, which was obtained through the core weight change test in previous work).
5) Production process simulation (oil reverse flooding). We connected the B end of the cell with the oil, opened the sealing clamp of the B end of the cell, pressurized the oil, and made the oil enter the core chip reversely. The process was completed when the A end of the cell produced oil and the core color did not change significantly. This process simulates the process of oil entering the wellbore after fracturing.
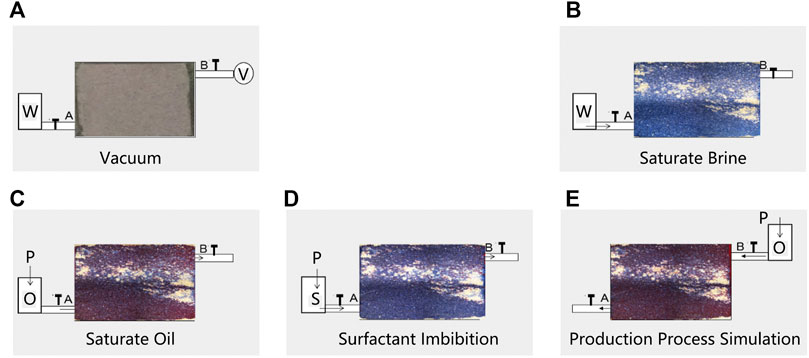
FIGURE 2. Core chips imbibition runs process steps: (A) Vacuum; (B) saturate brine; (C) saturate brine; (D) saturate oil; (E) production process simulation.
Results
By performing the imbibition process described above, the residual fluid in the core chips shows various colored points. By identifying the difference thresholds of contrary colors of water and oil—blue represents water, red represents oil—the chromatographic graph of water residence after oil reverse flooding was created by Nikon nis-Elements Documentation software. As the imbibition result detailed in Table 3, it can be concluded that the lower the core permeability, the greater the amount of imbibition retention.
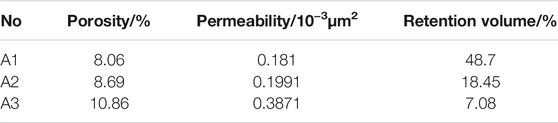
TABLE 3. Surfactant solution retention volume after imbibition process.
Figure 3 shows the T2 relaxation time spectra of typical cores under different circumstances. All curves reflect the distribution of water in the pores under every experimental condition. The curve between the saturated water state and saturated oil state is considered to be the distribution of original brine and oil in the pores, the curve between the saturated oil state and final state of water flooding is the distribution of movable oil in the pores [11].
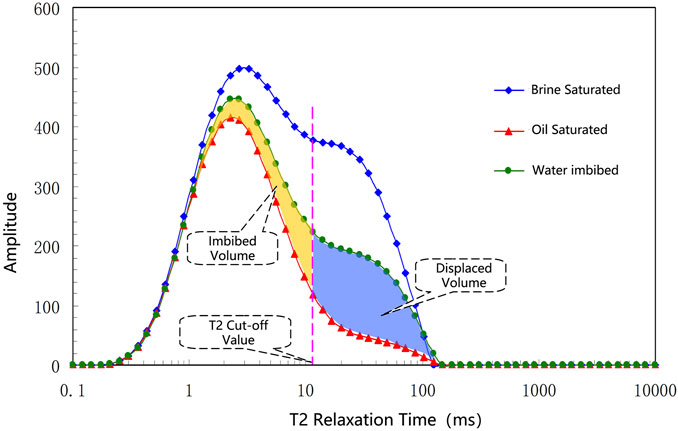
FIGURE 3. NMR map of movable fluid imbibition and displacement within typical cores.
During imbibition runs, T2 NMR scanning and pore size conversion were conducted, and the results are shown in Figure 4. After oil reverse flooding, the curve deviates to the right compared with the NMR map of surfactant flooding. In order to obtain comparison differences, A2 and A3 are selected for comparison on account of their permeability difference. This shows that medium and small pores were encroached by surfactant solution when imbibition was thoroughly processed. When oil reverse flooding the core chips, oil can only drain easily into the large pore throat. The entering of oil and water into the relatively smaller pores of the core chips is difficult when imbibition balance has been achieved, the long narrow holes have been filled with surfactant absorption. In Figure 4, as can be seen in both NMR maps, the saturation fraction of small pores decreased while that of large pores increased. At the same time, it can be found that this phenomenon is weakened in the relatively higher permeable A3 chip.
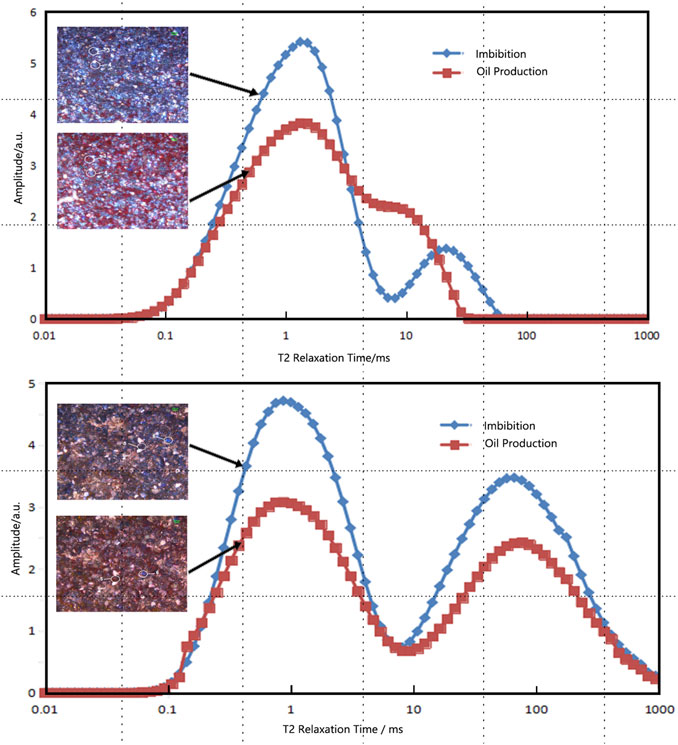
FIGURE 4. NMR comparison of rock chips after imbibition and after oil reverse flooding (upside A2、downside A3).
Case for Surfactant Imbibition With Liquid Chemical Tracer
In order to demonstrate the development effect of surfactant imbibition, seven stages of fracturing tracer monitoring were carried out to evaluate the productivity contribution of the imbibition agent within the horizontal section of the same well. Relatively, the effects of slickwater with no surfactant fluid on production under nearly the same downhole environment were compared for another seven stages using a chemical tracer to provide a basis of normal operation. The horizontal section was about 1,500 m long, and designed to fracture 97 clusters of 24 stages, among them 14 stages were monitored by the tracer. Seen from Table 4, surfactant imbibition has the role of enhancing oil recovery, when the optimal surfactant solution is used as pad fluid, it can enhance oil recovery by 22.9%.
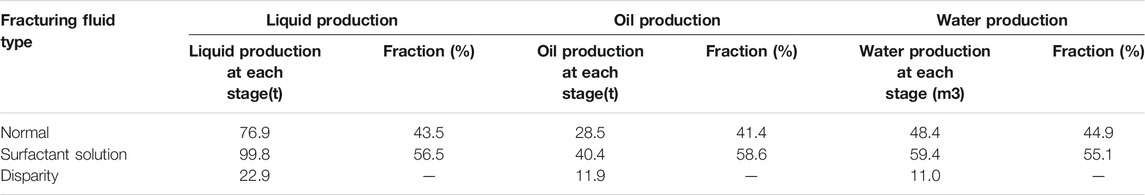
TABLE 4. Comparison of imbibition fluids on production.
Conclusion
1) The visualized core chips observation experiment and NMR statistical results quantitatively analyzed the imbibition process in the shale core. Residence water volume shows the lower the permeability of the core, the greater the efficiency of the surfactant imbibition agent.
2) Field cases showed that when the reservoir physical property parameters are very similar, the proper surfactant is helpful in boosting the average oil and water production, and the application effect in between fracturing stages in the same well also reflects this statistical result.
Data Availability Statement
The original contributions presented in the study are included in the article/Supplementary Material, further inquiries can be directed to the corresponding author.
Author Contributions
LM and DR contributed to the conception and design of the study. JW HH, and DR contributed to the analysis and/or interpretation of data. DR JL contributed to the drafting of the manuscript. ZW contributed to the manuscript revision.
Funding
This study is financially supported by the Shaanxi Province Key Research and Development Plan (2021GY-140), Open Fund of Key Laboratory of Coal Resources Exploration and Comprehensive Utilization, Ministry of Natural Resources (KF2021-3), and Open Fund of Shaanxi Key Laboratory of Advanced Stimulation Technology for Oil & Gas Reservoirs (20JS120).
Conflict of Interest
JW, LM, HH, and JL are employed by Changqing Oilfield Company, PetroChina, and DR is employed by Xi'an Shiyou University.
The remaining authors declare that the research was conducted in the absence of any commercial or financial relationships that could be construed as a potential conflict of interest.
Publisher’s Note
All claims expressed in this article are solely those of the authors and do not necessarily represent those of their affiliated organizations, or those of the publisher, the editors and the reviewers. Any product that may be evaluated in this article, or claim that may be made by its manufacturer, is not guaranteed or endorsed by the publisher.
References
1. Al-Harbi A, Schmitt DP, Ma SM. Toward Quantitative Remaining Oil Saturation (ROS): Determination Challenges and Techniques. SPE (2011) 147651:1–8. doi:10.2118/147651-MS
2. Zhang F, Saputra IW, Adel IA, Schechter DS. Numerical Investigation of EOR Applications in Unconventional Liquid Reservoirs through Surfactant-Assisted Spontaneous Imbibition SASI and Gas Injection Following Primary Depletion. SPE (2019) 196055:11–23. doi:10.2118/196055-MS
3. Liu J, Sheng JJ. Investigation of Countercurrent Imbibition in Oil-Wet Tight Cores Using NMR Technology. SPE (2020) 25 201099:2601–14. doi:10.2118/201099-PA
4. Alhashim HW, Zhang F, Schechter DS, Chen J-H. Investigation of the Effect of Pore Size Distribution on the Produced Oil from Surfactant-Assisted Spontaneous Imbibition in ULRs. SPE (2019) 195931:1–33. doi:10.2118/195931-MS
5. Argüelles-Vivas FJ, Wang M, Abeykoon GA, Okuno R. Enhancement of Water Imbibition in Shales by Use of Ketone Solvent. SPE (2020) 199322:2–21. doi:10.2118/199322-MS
6. Li X, Liu J, Guo G, Li K, Liu X. Mathematical Model of Imbibition and its Application in Tight Sandstone Reservoir. Spec Oil Gas Reservoirs (2017) 24:79–83. doi:10.3969/j.issn.1006-6535.2017.06.015
7. Guo G, Xue X, Li K, Fan H, Liu J, Wu J. Effect of Retained Fracturing Fluid on the Imbibition Oil Displacement Efficiency of Tight Oil Reservoir. Drilling Fluid & Completion Fluid (2016) 33:121–6. doi:10.3696/j.issn.1001-5620.2016.06.022
8. Fan H, Xue X, Li K, Zhou X, Wu S. Development and Application of Flooding Surfactant Fracturing Fluid. Chem Eng Oil Gas (2019) 48:74–9. doi:10.3969/j.issn.1007-3426.1019.01.013
9. Fan H, Xue X, Liu J, Guo G, Li K, Wu J. Preparation and Performance Evaluation of an Anionic-Nonionic Surfactant with High Imbibition Efficiency. Oilfield Chem (2019) 35:433–9. doi:10.19346/j.cnki.1000-4092.2018.03.011
10. Yu F, Jiang H, Ma M, Xu F, Su H, Jia J. Visualization the Surfactant Imbibition at Pore Scale by Using of Fractured Micromodels. SPE (2020) 200349:1-24. doi:10.2118/200349-MS
Keywords: hydraulic fracturing, fracturing stimulation, imbibition test, rock chips, surfactant imbibition
Citation: Wu J, Mu L, Ren D, Liu J, Hui H and Wang Z (2022) Experimental Study of Imbibition Within Core Chips of Shale in Ordos Basin. Front. Phys. 10:833497. doi: 10.3389/fphy.2022.833497
Received: 11 December 2021; Accepted: 14 February 2022;
Published: 14 March 2022.
Edited by:
Qingxiang Meng, Hohai University, ChinaReviewed by:
Liang Chen, China University of Petroleum, ChinaChenchen Wang, Yangtze University, China
Copyright © 2022 Wu, Mu, Ren, Liu, Hui and Wang. This is an open-access article distributed under the terms of the Creative Commons Attribution License (CC BY). The use, distribution or reproduction in other forums is permitted, provided the original author(s) and the copyright owner(s) are credited and that the original publication in this journal is cited, in accordance with accepted academic practice. No use, distribution or reproduction is permitted which does not comply with these terms.
*Correspondence: Jiang Wu, NjcwNTE5MDEyQHFxLmNvbQ==