- 1Institute of Physics, University of Greifswald, Greifswald, Germany
- 2Plasma Devices, Thales Deutschland GmbH, Ulm, Germany
Particle-in-Cell (PIC) simulations are used to model the MS4 test thruster of Thales Deutschland. Given as input the geometric shape, material components, magnetic field and the operating parameters of the experiment, the model is able to reproduce the experimentally observed emission pattern in the plume. This is determined by the magnetic field line structure and the resulting plasma dynamics in the near-field region close to the exit.
Introduction
Ion thrusters become increasingly beneficial for space missions. Their application is not only limited to Earth-centered orbits, but is especially useful in deep space missions, such as Deep Space 1 [1] and soon to be in the Psyche mission [2]. For such long lasting travels, these devices need to be experimentally well tested. Every iteration in the optimization process for such a thruster is long and consequently expensive [3]. The construction of new designs alone is hard and rather costly. Thus, cheaper methods for design optimization are needed. Computer simulations, such as the Particle-in-Cell (PIC) model, have shown successfully their potential for design optimization, especially in combination with simpler balance equation models using genetic algorithms [4,5].
The MS4 is a test thruster concept of the Thales Deutschland GmbH with a simple design. It is a grid less thruster where the magnetic field structure is such that the beam forming occurs outside the channel. Since probing the plasma can be difficult, this allows easy access for optical emission spectroscopy to compare with modeling in order to validate simulation results. In turn, this enables to check and possibly to adapt the model and its parameters.
In the next section, the setup of the simulation is explained. The results of the PIC simulations are introduced and discussed afterwards. Notably, a direct comparison of the experimental optical emission of the near-field plume is possible with the model. Finally, the findings are summarized.
Simulation
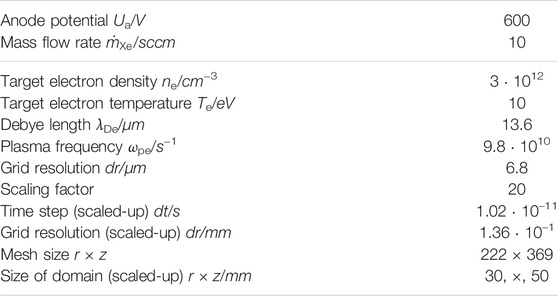
The two-dimensional (2D), cylinder-symmetric, electrostatic Particle-in-Cell (PIC) code used to simulate the MS4 has been widely applied to various ion thrusters [6–8]. The model follows super-particle trajectories of neutrals, ions, doubly charged ions and electrons. This PIC code is written in dimensionless variables for computational efficiency. Its results are normalized using the target electron density and temperature of Table 1. This approach fixes the Debye length, the collisional lengths and the plasma frequency. The resolution of the Debye length and of the plasma frequency are guaranteed as long as the electron densities and temperatures stay below the target values. To resolve the Debye length the grid size is set to half the targeted Debye length, which is in our case 6.8 μm. Still, the geometric dimensions of such systems are huge compared to the resolution of PIC simulations, which is of the order of the Debye length. In order to speed up the calculation, a similarity scaling scheme is used [9,10]. Two systems are called similar, if the invariants remain constant. Here, the scaling preserves the invariants for static electric and magnetic fields, force free motion and collisional effects. The problem is mapped to a smaller system, while keeping the Debye length constant. This reduces strongly the number of cells needed to resolve the system and by this the computational time. The similarity scaling is analytically correct for non-bounded (e.g. periodic) systems, but is limited in cases of systems with charge separation, like bounded plasmas with sheaths or extraction regions. Due to this, application of the similarity scaling to PIC simulations maintains core parameters like thrust and the plasma solution within the thruster channel. However, large scaling factors enhance charge separation effects because the ratio of the Debye length to the system size increases strongly. A sensitivity study showed deviations of the plasma solution for big scaling factors (about 100) [10], especially in the exit region of the studied HEMP thruster. In the present study the scaling factor is 20 (cf. Table 1).
Monte Carlo (MC) collisions are included, requiring a three-dimensional (3D) resolution of the velocities. Collision algorithms require dimensional values of density and temperature, since cross sections depend on these explicitly. The 2D3V PIC code includes Coulomb collisions, electron-neutral elastic, ion-neutral momentum transfer, charge exchange, excitation and ionization collisions as MC processes. The dynamics of the neutral gas is resolved self-consistently. A detailed description of the collision algorithms can be found in Matyash [11], Bronold et al. [12] and Tskhakaya et al. [13]. Xenon collision cross sections are taken from Hayashi [14]. Anomalous electron transport perpendicular to magnetic field is included in the model via a Bohm-type diffusion. The magnetic field is assumed static and solved once with the FEMM software [15]. Only the Poisson equation is solved every step on a structured grid for the electrostatic potential. A full description of the PIC model and its routines can be found in Matyash [11] and Kahnfeld et al. [8].
The routines of the code have been thoroughly tested. In Matyash et al. [16] and Matyash et al. [17] the SPT thruster was modelled and in good agreement with Taccogna et al. [18]. In addition, the same code was applied to low-temperature radio frequency (rf) plasmas with non-Maxwellian distribution functions [19]. Within the group there exist also 1D3V and 3D3V PIC models, where the routines share a common ancestor for particle push, boundary and collision handling. A 3D3V version is designed to calculate even dusty plasmas [20] and has been able to reproduce their complex behavior [21]. The 1D3V model was applied to study two experimentally observed electronegative modes in capacitively coupled rf plasmas [22].
The axisymmetric 2D model comprises the discharge channel and the near-field plume. At the upper and right domain boundary of the plane, spanned by the radial (r) and axial (z) directions, the potential is set to zero. When particles leave at these boundaries they are removed from the simulation. Symmetry axis is the bottom of the domain at r = 0. Particles leaving the domain at the symmetry axis are reflected. Wall processes, which include ion recombination, neutral reflection and secondary electron emission (SEE), are also implemented. The left domain boundary represents a metal anode in the channel. At metal surfaces electrons are absorbed. Neutrals are re-emitted thermally. Ions recycle as thermal neutrals. At the dielectrics the space charge is locally increased according to the charge of the impinging specie. There, secondary electron emission (SEE) is accounted for by a probabilistic MC model. For each impinging electron and independently of its energy a fixed SEE probability determines if a single secondary electron is emitted. In case of emission the particle reenters the system with 90% of its velocity. Emission yields can become quite high [18,23], i.e., even more than one particle can be emitted for the electron energy range in question. In this paper, the SEE value is set to 0.99. This is an estimate based on the energy distributions of the electrons reaching the walls. The contributions of electrons with energies above 10 eV at these locations result in rather high SEE coefficients.
The PIC simulation domain contains the geometry of the MS4 thruster. It stretches 30 mm in the radial (r) and 50 mm in the axial (z) direction and is shown in the plot of the magnetic field in Figure 1. The channel of the MS4 geometrically consists of two cylinders stacked together. The inner cylinder (z ≤ 7.45 mm) has a small radius of 5.825 mm, whereas the outer cylinder is nearly twice as large with a radial extent of 11.6 mm. The discharge channel is bounded by a dielectric material that has a high sputtering threshold. In all figures the thruster wall parts are indicated by transparent light gray and red polygons that resemble the dielectric and metallic components of the thruster, respectively. Figure 1 indicates additionally the position of the anode and the gas inlet. For clarification the inner and outer cylinder regions are marked. The Python library Matplotlib is used for all plots [24,25].
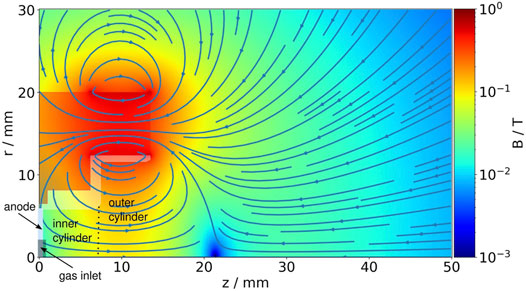
FIGURE 1. Magnetic field of the MS4 thruster. Field lines are plotted on top of the magnetic flux density B. The strength of the magnetic flux is color-coded. The metal casing (transparent red) and dielectric (transparent white) are also denoted. Anode and the neutral gas inlet are shown. The two thruster channel regions labelled inner and outer cylinder are also indicated.
Magnetic fields are calculated by the FEMM model and used as PIC code input. The magnetic field is generated by a single permanent ring magnet within the metal structure. A magnetic pole is at the metal surface above the thruster exit at about r = 12 mm and z = 15 mm. Starting from the pole, open field lines constitute most of the plume volume. “Open” here means the field lines which do not close within the simulation on a bounded surface. The other closed field lines enter the channel and hit the dielectric wall. Within the channel, the magnetic field lines are mostly parallel to the axis. Only for small values in z (z ≤ 3–4 mm) there is a significant inclination between surface and field lines. The acceleration voltage of 600 V is applied at the metal anode on the left side of the modeled thruster interior. The feed gas is Xenon (Xe), which is injected at the anode close to the symmetry axis with a flow rate of 10 sccm. More parameters of the simulation are summed up in Table 1. A cathode neutralizer injects electrons outside the thruster, such that an anode current of 0.35 A is reached. For convenience, in the simulation this source is spatially distributed in front of the right boundary.
Within the inner cylinder the electrostatic potential is rather smooth and then drops from the step in the cylindrical channel into the plume over a large axial extent. The potential gradient has not only axial but also smaller radial components (see Figure 2 for details). Electrons have a huge mobility along field lines and therefore tend to smooth gradients in this direction. If the mobility reduces, gradients will arise. Due to wall losses the densities decrease, reducing the conductivity and thus the radial potential drop is generated close to the wall. At the step and at the exit the confinement is reduced due to the magnetic fields and the electrostatic potential. With stronger losses the density drops even more. In turn, these losses lead to an increased local Debye length so that the potential drops from the geometric step towards the plume.
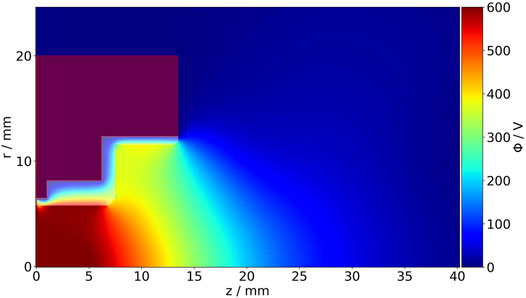
FIGURE 2. Electrostatic potential Φ of the MS4. The metal casing (transparent red) and dielectric (transparent white) are also denoted.
In Figure 3, the electron density distribution is shown in the
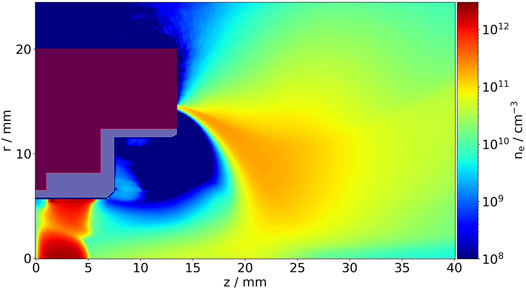
FIGURE 3. Electron (e) density distribution of the 2D axisymmetric PIC simulation for the MS4. The metal casing (transparent red) and dielectric (transparent white) are also denoted.
In the exterior cylinder (7.45 mm ≤ z ≤ 13.45 mm) there are much fewer electrons. For small radii (r ≤ 5.8 mm) the electrons are supplied by the high density region of the inner cylinder, whereas for larger radii an electron is short-circuited between the two confining walls along the magnetic field lines. Hence, the rather big hole in the electron density is generated for large radii in the exterior cylinder and at the thruster exit.
Singly charged Xenon ions Xe+ are not magnetized. In Figure 4 their density distribution is displayed. Their motion is hardly influenced by the magnetic field, but they follow the electron motion due to the quasi-neutrality constraint within the channel forcing the ion density within the inner channel to be similar to the electron density. Larger deviations from quasi-neutrality can occur only in the exterior channel and in the plume, because the charge densities are much smaller. The acceleration acts mostly at the geometric step from the channel to the plume. This electrostatic potential drop accelerates the ions out of the channel. Since the gradient has also radial components, the ions are emitted in a broad angular range from the thruster. For large radii in the exterior channel, the radial spreading of the extent is plainly visible, especially compared to the electron distribution in this region. The ion density shares many characteristics of the electron density due to the coupling by quasi-neutrality to the electrons. In the plume, the imprint of the magnetic field is also seen in the ion density. The electron distribution broadens radially following the ion motion, because in this region magnetization gets already reduced. Due to the similarity scaling the charge separation between electrons and ions in the near-field plume might be artificially overestimated. The increase of the Debye length λDe relative to the system size enhances the screening width wherever charge separation occurs, especially at sheath boundaries and near the channel exit [10].
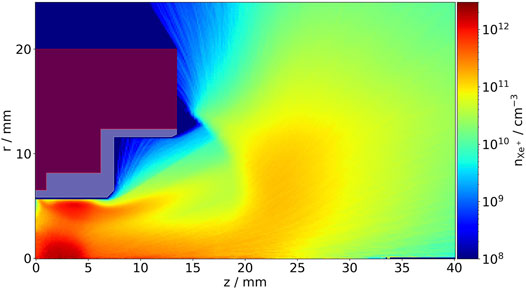
FIGURE 4. Singly charged Xenon ion (Xe+) density distribution. The metal casing (transparent red) and dielectric (transparent white) are also denoted.
The same signatures as for the Xe+ ions can be found for the Xe2+ ions. Their density distribution, which is seen in Figure 5, is very similar to the singly charged ions, but their number density is about an order of magnitude smaller. This is due to the lower ionization probability of the doubly charged ions.
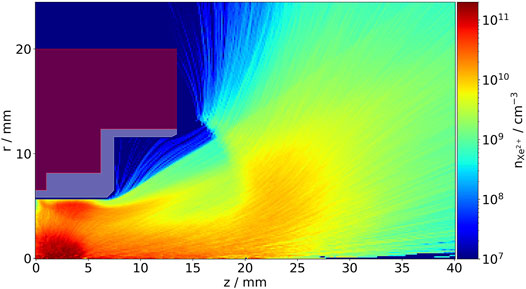
FIGURE 5. Doubly charged Xenon ion (Xe2+) density distribution. The metal casing (transparent red) and dielectric (transparent white) are also denoted.
Figure 6 shows the distribution of the Xenon neutrals. Neutrals are injected close to the origin of the domain and fill the entire domain due to collisions. Therefore, the density gradually decreases from its peak at about 2 ⋅ 1014 cm−3 in both axial and radial direction. The neutral density is very smooth. Even ionization collisions hardly reduce the local density significantly, because the ionization rate is rather low.
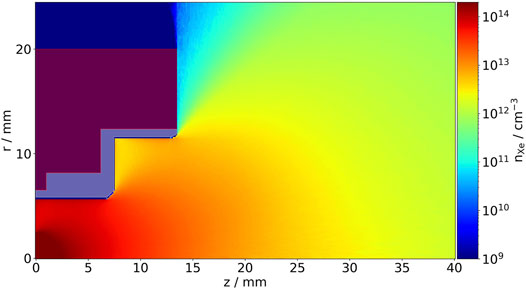
FIGURE 6. Neutral Xenon (Xe) density distribution. The metal casing (transparent red) and dielectric (transparent white) are also denoted.
These ionization events generate ions by electron-neutral-Xenon ionization collisions. Their distribution is seen in Figure 7. The distribution of these events results from the interplay between electron density, their energy and the neutral density. Again, the magnetic field structure, which is also seen in the electron density, is clearly visible.
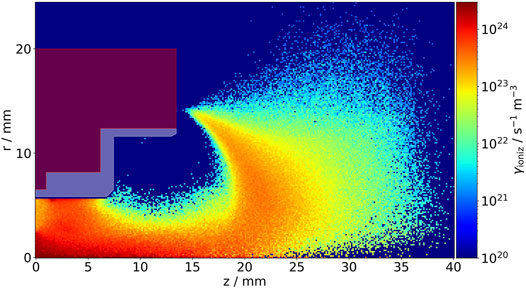
FIGURE 7. Distribution of Xe ionization collisions. The metal casing (transparent red) and dielectric (transparent white) are also denoted.
Figure 8 presents the angle-resolved energy distribution of ejected Xe+ ions at the domain boundary. The distribution of ion current
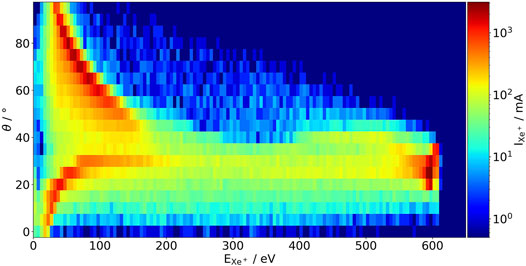
FIGURE 8. Simulated angular energy distribution of emitted Xe+ ions measured at the domain boundary. The angle θ is measured from the symmetry axis to the ray formed by the vertex at the thruster exit at (r = 0 mm, z = 13.45 mm) to the point where the ion left the domain.
Instead, the MS4 offers a great opportunity for a detailed comparison of the simulation with the experiment, since the beam forming occurs mostly in the plume. The optical emission measurement is compared to the output of the simulated total electron-Xenon excitation collisions Hayashi [27], which can cause light emission. Within an optically thin plasma, the measured brightness is the integral of the line-of-sight in the 3D system projected onto the 2D camera sensor. The transfer from the cylindrical (r,z) simulation to the experimental picture is described via a forward Abel transformation. This transform relates the local emissivity ɛ(r, z) to the measured intensity I (y, z) in the sensor
where Rlimit is an upper limit, such as the radial extent of the plasma. The total electron-Xenon excitation collisions in the PIC code is shown Abel-transformed in Figure 9 on top of the upper half of the symmetric picture taken from an experimental measurement of optical emission. The resulting radiance is in arbitrary units. The transform itself is calculated via the PyAbel package [28]. Values below and above a certain threshold are cut off to mimic the experimental measurement process. The upper cut-off represents the saturation of the photo sensor. Values below the lower threshold are masked from the overlay which enhances the visibility of the boundary of the simulated light emission. This shape resembles the halo around the bright areas in the experiment. Since the casing blocks the view of the channel, no experimental information from inside the channel is available. Simulation and experiment agree reasonably well in the plume. The simulated electron-Xenon excitation qualitatively matches the brightness patterns of the photo. This is especially true for the very bright, crescent-shaped region and the dark void at the thruster exit at large radii.
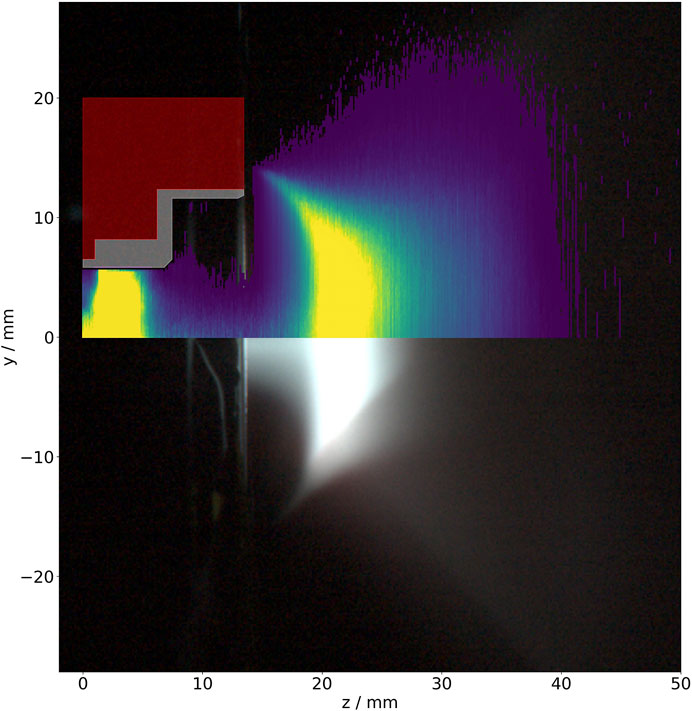
FIGURE 9. Optical emission measurement of the MS4 overlaid on the upper half with the Abel-transformed, simulated, total electron-Xenon excitation collision distribution.
Summary and Discussion
The optimization of thruster designs is long and costly. PIC simulations are a suitable tool to guide and speedup the process. Not only the thruster itself, but also the plasma models need to be tested thoroughly. The MS4 thruster is an ideal test candidate to validate PIC simulations, since most of the beam forming occurs outside the channel with good access for diagnostics. With the help of the Abel-transformed, total electron-Xenon excitation collision distribution, which translates directly into light emission patterns PIC simulations can be checked. The experimentally observed radiation could be reproduced quite well by the simulation. This emission pattern is rather insensitive to operating parameters, SEE value for dielectrics and neutral plume density. This is understandable, because this pattern is driven by the neutralizer source and the magnetic field structure in the near-field plume.
The situation is different for the plasma within the thruster channel, but here a validation is much more complicated due to missing measurements, because there is no diagnostic access.
As discussed before, the dominant electron energy distribution hitting the side walls is at the cusp-like magnetic field at the wall of the inner cylinder. Using these distributions, one gets an averaged SEE yield from about 1 up to 2 [23,29,30]. In this work, a SEE value of 0.99 is chosen. Further studies will be done with a more complex SEE model [31] for the plasma simulation.
Data Availability Statement
The raw data supporting the conclusion of this article will be made available by the authors, without undue reservation.
Author Contributions
LL and DK did the PIC modeling. LL and RS analyzed the data and wrote the first draft of the manuscript. LL, RS, and NS performed a detailed analysis of the effects of SEE variation, to which is referred to. RH provided the experimental data. All authors contributed to the final version of the manuscript.
Funding
This work is funded by the European Union as EU project 101004140-HEMPT-NG2.
Conflict of Interest
RH is employed by Thales Deutschland GmbH.
The remaining authors declare that the research was conducted in the absence of any commercial or financial relationships that could be construed as a potential conflict of interest.
Publisher’s Note
All claims expressed in this article are solely those of the authors and do not necessarily represent those of their affiliated organizations, or those of the publisher, the editors and the reviewers. Any product that may be evaluated in this article, or claim that may be made by its manufacturer, is not guaranteed or endorsed by the publisher.
References
1.NASA. Deep Space 1 (2019). Available at: https://solarsystem.nasa.gov/missions/deep-space-1/in-depth/(Accessed 12 04, 2021).
2.Psyche Team. The Spacecraft (2020). Available at: https://psyche.asu.edu/mission/the-spacecraft/(Accessed December 04, 2021).
3. Kornfeld G, Koch N, Coustou G. First Test Results of the HEMP Thruster Concept. In: Proceedings of the 28th International Electric Propulsion Conference. IEPC-2003-212; March 17-21, 2013; Toulouse, France (2003).
4. Matthias P, Kahnfeld D, Schneider R, Yeo SH, Ogawa H. Particle-in-cell Simulation of an Optimized High-Efficiency Multistage Plasma Thruster. Contrib Plasma Phys (2019) 59:e201900028. doi:10.1002/ctpp.201900028
5. Yeo SH, Ogawa H, Matthias P, Kahnfeld D, Schneider R. Multiobjective Optimization and Particle-In-Cell Simulation of Cusped Field Thrusters for Microsatellite Platforms. J Spacecraft Rockets (2020) 57:603–11. doi:10.2514/1.a34584
6. Matyash K, Kalentev O, Schneider R, Taccogna F, Koch N, Schirra M. Kinetic Simulation of the Stationary HEMP Thruster Including the Near-Field Plume Region. In: Proceedings of the 31st International Electric Propulsion Conference. IEPC-2009-110; September 20-24, 2009; Ann Arbor, MI, USA (2009). p. 1–7.
7. Lüskow KF, Neumann PRC, Bandelow G, Duras J, Kahnfeld D, Kemnitz S, et al. Particle-in-cell Simulation of the Cathodic Arc Thruster. Phys Plasmas (2018) 25:013508. doi:10.1063/1.5012584
8. Kahnfeld D, Duras J, Matthias P, Kemnitz S, Arlinghaus P, Bandelow G, et al. Numerical Modeling of High Efficiency Multistage Plasma Thrusters for Space Applications. Rev Mod Plasma Phys (2019) 3:11. doi:10.1007/s41614-019-0030-4
9. Lacina J. Similarity Rules in Plasma Physics. Plasma Phys (1971) 13:303–12. doi:10.1088/0032-1028/13/4/003
10. Matthias P, Kahnfeld D, Kemnitz S, Duras J, Koch N, Schneider R. Similarity Scaling‐application and Limits for High‐efficiency‐multistage‐plasma‐thruster Particle‐in‐cell Modelling. Contrib Plasma Phys (2020) 60:e201900199. doi:10.1002/ctpp.201900199
11. Matyash K. Kinetic Modeling of Multi-Component Edge Plasmas. [PhD Thesis]. Greifswald (Germany): University of Greifswald (2003).
12. Bronold FX, Matyash K, Tskhakaya D, Schneider R, Fehske H. Radio-frequency Discharges in Oxygen: I. Particle-Based Modelling. J Phys D: Appl Phys (2007) 40:6583–92. doi:10.1088/0022-3727/40/21/018
13. Tskhakaya D, Matyash K, Schneider R, Taccogna F. The Particle-In-Cell Method. Contrib Plasma Phys (2007) 47:563–94. doi:10.1002/ctpp.200710072
14. Hayashi M. Bibliography of Electron and Photon Cross Sections with Atoms and Molecules Published in the 20th Century - Xenon (2003). Tech. Rep. NIFS-DATA-79
16. Matyash K, Schneider R, Mutzke A, Kalentev O, Taccogna F, Koch N, et al. Kinetic Simulations of SPT and HEMP Thrusters Including the Near-Field Plume Region. IEEE Trans Plasma Sci (2010) 38:2274–80. doi:10.1109/TPS.2010.2056936
17. Matyash K, Schneider R, Mutzke A, Kalentev O, Taccogna F, Koch N, et al. Comparison of SPT and HEMP Thruster Concepts from Kinetic Simulations. In: Proceedings of the 31st International Electric Propulsion Conference. IEPC-2009-159; September 20-24, 2009; Ann Arbor, MI, USA (2009). p. 1–11.
18. Taccogna F, Longo S, Capitelli M, Schneider R. Particle-in-cell Simulation of Stationary Plasma Thruster. Contrib Plasma Phys (2007) 47:635–56. doi:10.1002/ctpp.200710074
19. Matthias P, Bandelow G, Matyash K, Duras J, Hacker P, Kahnfeld D, et al. PIC Simulations of Capacitively Coupled Oxygen Rf Discharges. Eur Phys J D (2018) 72:82. doi:10.1140/epjd/e2017-80565-y
20. Schleede J, Lewerentz L, Bronold FX, Schneider R, Fehske H. Plasma Flow Around and Charge Distribution of a Dust Cluster in a Rf Discharge. Phys Plasmas (2018) 25:043702. doi:10.1063/1.5021316
21. Melzer A, Hübner S, Lewerentz L, Matyash K, Schneider R, Ikkurthi R. Phase-resolved Optical Emission of Dusty Rf Discharges: Experiment and Simulation. Phys Rev E (2011) 83:036411. doi:10.1103/physreve.83.036411
22. Teichmann T, Küllig C, Dittmann K, Matyash K, Schneider R, Meichsner J. Particle-in-cell Simulation of Laser Photodetachment in Capacitively Coupled Radio Frequency Oxygen Discharges. Phys Plasmas (2013) 20:113509. doi:10.1063/1.4831760
23. Dunaevsky A, Raitses Y, Fisch NJ. Secondary Electron Emission from Dielectric Materials of a Hall Thruster with Segmented Electrodes. Phys Plasmas (2003) 10:2574–7. doi:10.1063/1.1568344
24. Hunter JD. Matplotlib: A 2d Graphics Environment. Comput Sci Eng (2007) 9:90–5. doi:10.1109/mcse.2007.55
25. Caswell TA, Droettboom M, Lee A, De Andrade ES, Hoffmann T, Hunter J, et al. Matplotlib/Matplotlib: Rel: v3.5.0 (2021). doi:10.5281/ZENODO.5706396
26. Duras J, Kahnfeld D, Bandelow G, Kemnitz S, Lüskow K, Matthias P, et al. Ion Angular Distribution Simulation of the Highly Efficient Multistage Plasma Thruster. J Plasma Phys (2017) 83. doi:10.1017/s0022377817000125
27. Hayashi M. Determination of Electron-Xenon Total Excitation Cross-Sections, from Threshold to 100 eV, from Experimental Values of townsend’s α. J Phys D: Appl Phys (1983) 16:581–9. doi:10.1088/0022-3727/16/4/018
28. Gibson S, Hickstein DD, Yurchak R, Ryazanov M, Das D, Shih G. Pyabel/pyabel: v0.8.4 (2021), 595830107. doi:10.5281/ZENODO.4690660
29. Ordonez CA, Peterkin RE. Secondary Electron Emission at Anode, Cathode, and Floating Plasma‐facing Surfaces. J Appl Phys (1996) 79:2270–4. doi:10.1063/1.361151
30. Raitses Y, Smirnov A, Staack D, Fisch NJ. Measurements of Secondary Electron Emission Effects in the Hall Thruster Discharge. Phys Plasmas (2006) 13:014502. doi:10.1063/1.2162809
Keywords: simulations, plasma, thrusters, diagnostics, cathodes, plume, particle-in-cell
Citation: Lewerentz L, Kahnfeld D, Schulz N, Heidemann R and Schneider R (2022) PIC Simulations of the MS4 Thruster. Front. Phys. 10:833159. doi: 10.3389/fphy.2022.833159
Received: 10 December 2021; Accepted: 03 February 2022;
Published: 25 February 2022.
Edited by:
Filippo Cichocki, Istituto per la Scienza e Tecnologia dei Plasmi (ISTP), ItalyReviewed by:
Roderick William Boswell, Australian National University, AustraliaAndrea Cristofolini, University of Bologna, Italy
Copyright © 2022 Lewerentz, Kahnfeld, Schulz, Heidemann and Schneider. This is an open-access article distributed under the terms of the Creative Commons Attribution License (CC BY). The use, distribution or reproduction in other forums is permitted, provided the original author(s) and the copyright owner(s) are credited and that the original publication in this journal is cited, in accordance with accepted academic practice. No use, distribution or reproduction is permitted which does not comply with these terms.
*Correspondence: Lars Lewerentz, bGFycy5sZXdlcmVudHpAdW5pLWdyZWlmc3dhbGQuZGU=
 Lars Lewerentz
 Daniel Kahnfeld1
 Ralf Heidemann
 Ralf Schneider