 Olivier B. Simon1Rajan Jain2,3Yoon-Seong Choi4,5
 Carsten Görg1Krithika Suresh1
 Cameron Severn1,6
 Debashis Ghosh1*
- 1Department of Biostatistics and Informatics, Colorado School of Public Health, University of Colorado Anschutz Medical Campus, Aurora, CO, United States
- 2Department of Radiology, NYU Grossman School of Medicine, New York, NY, United States
- 3Department of Neurosurgery, NYU Grossman School of Medicine, New York, NY, United States
- 4Radiological Sciences Academic Clinical Programme, Duke-NUS Medical School, Singapore, Singapore
- 5Department of Radiology, Yonsei University College of Medicine, Seoul, South Korea
- 6Department of Pediatrics, Section of Endocrinology, School of Medicine, University of Colorado Anschutz Medical Campus, Aurora, CO, United States
Radiomics has shown great promise in detecting important genetic markers involved in cancers such as gliomas, as specific mutations produce subtle but characteristic changes in tumor texture and morphology. In particular, mutations in IDH (isocitrate dehydrogenase) are well-known to be important prognostic markers in glioma patients. Most classification approaches using radiomics, however, involve complex hand-crafted feature sets or “black-box” methods such as deep neural networks, and therefore lack interpretability. Here, we explore the application of simple graph-theoretical methods based on the minimum-spanning tree (MST) to radiomics data, in order to detect IDH mutations in gliomas. This is done using a hypothesis testing approach. The methods are applied to an fMRI dataset on n = 413 patients. We quantify the significance of the group-wise difference between mutant and wild-type using the MST edge-count testing methodology of Friedman and Rafsky. We apply network theory-based centrality measures on MSTs to identify the most representative patients. We also propose a simple and rapid dimensionality-reduction method based on k-MSTs. Combined with the centrality measures, the latter method produces readily interpretable 2D maps that reveal distinct IDH, non-IDH, and IDH-like groupings.
Introduction
The advent of widespread medical imaging, large imaging datasets, and large-scale inexpensive computing power has ushered in an era of unprecedented resources for medical image analysis [1]. Cancers can now be automatically detected and staged from histopathology images, or from clinical imaging datasets such as MRI, CT or PET data. In particular, considerable success has been achieved using complex computer-derived image-analysis features derived from such data as input for advanced statistical and machinelearning methods. This approach, known as “radiomics”, offers the potential to take into account multiple features of the image not detected by human observers and hence also avoiding the issue of inter-observer variability [2].
Genotyping of gliomas is difficult and invasive, as it requires biopsy of brain tissue. While some genetic correlates of cancer prognosis, such as MGMT promoter methylation, have not shown strong correlation with radiomics features [3], other mutation types are associated with marked differences in radiomic profiles—although considerable variability between studies exists. In particular, isocitrate dehydrogenase (IDH) mutations are found in 5–13% of glioblastomas and are strongly correlated with radiomics features [3].
Current automated methods for visual or radiomic genotyping of gliomas increasingly depend on deep neural network methods and pipelines, often using off-the-shelf architectures such as ResNet for detection and then classification [4]. Still other studies have made use of random forest methods for genotyping, in combination with CNN-based methods for tumor segmentation [3]. Alongside neural networks, more traditional “hand-crafted” features, involving human-defined combinations of pixel-level image analysis methods such as gray-level co-occurrence matrices (GLCMs), represent a second still-vibrant branch of radiomics analysis [5]. Handcrafted features often have the benefit of imparting greater interpretability to radiomics analyses; on the other hand, since neural network models are considered by some to be more free from human bias, current state-of-the-art radiomics methods frequently combine both [6].The area under the curve (AUC) is a typical metric for evaluation for these approaches, with values around 0.85−0.95 representing the state-of-the-art as of this writing [2]. Other measures such as F1 score, sensitivity and specificity are also common. However, while useful for gauging performance, these measures do little to provide an intuitive understanding of the structure of the underlying data, or the reasons for the classifier outputs—a problem which is particularly serious with neural networks, which with their many millions of automatically learned parameters are often considered to be “black-boxes” [7]. While deep learning is the current state-of-the art classification technique, we do note that other modeling procedures could be used, such as logistic regression, support vector machines or L1-penalized regression approaches, among many others.
Minimum spanning trees (MSTs) are graph-theoretic structures in which a set of data-points or “nodes” are connected into a single component using the minimum possible total connection distance [8]. Notably, MSTs, while easy to compute, are capable of representing key statistical properties of highly complex datasets in a vastly simplified format that is also readily amenable to lower-dimensional (even 2D) visualization. This renders them applicable to understanding a range of systems, such as gene expression, transportation networks and brain connectivity [9, 10]. Furthermore, node centrality measures--which aim at measuring the “importance” of a given node to the overall network structure--are readily applicable to the MST [11]. Therefore, MST and other graph-based approaches may offer an appealing and complementary alternative to the ‘blpredictions given by neural-networks.
In addition to being easy to calculate, the MST of a high-dimensional dataset also comes with an attendant hypothesis testing procedure that allows one to assess the significance of the difference between classes. This is the Friedman-Rafsky multivariate runs test (here abbreviated “MVR”) [12–14]. Briefly, MVR involves constructing an MST over the pooled data from two different classes, removing the edges that connect different classes, and counting the number of connected components that result. Smaller numbers of connected components indicate greater significance between the classes; this significance, furthermore, can be calculated using a standard normal approximation. Note that our goal here of inference is substantially different from much of the radiomics literature described above, which is focused on classification performance.
The k-MST is a simple extension of the MST, found by repeating the MST algorithm k times, each time excluding any connections chosen in prior iterations [14]. This allows a richer level of connectivity information which in turn can improve statistical test results such as edge-counting [12, 14]. At the same time, like an MST, a k-MST is a uniquely defined mathematical structure that can be calculated from any given point-set without requiring any user-tuned parameters; thus, use of the k-MST may greatly ameliorate one of the common concerns regarding “handcrafted” radiomics features, namely that of lower reproducibility stemming from bias in the feature design [6].
In the present work, we use the k-MST as a representation of the underlying structure of multivariate radiomics data, randomly embed it in a 2D region, and apply a simple 2D force-directed layouts methodology whereby nodes that are directly connected in the k-MST experience an attractive force. To avoid the expensive process of calculating repulsive forces between non-connected nodes, an isotropic expansion or “reflation” is carried out after each iteration, to counteract the tendency of a wholly-attractive configuration of forces to collapse to a point.
Because the k-MST contains only a small fraction of the possible pairwise connections between nodes, and because there are no explicit repulsive forces to calculate, our method allows rapid creation of 2D representations of arbitrarily high-dimensional radiomics datasets. Importantly, we find this method consistently converges to configurations which effectively segregate the IDH and non-IDH patients—especially when combined with the results of node centrality measures. This suggests possible wide applications of MST-based methods in creating “explainable” maps of radiomic data with respect to tumor genotype.
Methods
Our analytic workflows are described in Figures 1,2. Our dataset derives from MRI scans conducted on 413 glioma patients, genotyped as either IDH-mutated (n = 144) or IDH wild type (n = 269). The data come from a previously published study [4]. T2-weighted and fluid-attenuated inversion recovery (FLAIR) MR images of diffuse gliomas (WHO grades II, III and IV) were obtained in DICOM format from After conversion to NIfTI format, T2-weighted images were re-sampled to 1 mm isovoxel resolution using the ‘trilinear’ option from the FLIRT function, while FLAIR images were registered to the T2 images after skull stripping, all using the FMRIB software library (http://fsl.fmrib.ox.ac.uk/fsl/fslwiki/FSL). Next, image signal intensity was normalized using the WhiteStripe R package. Tumor areas (defined by hyper-intensity in T2 images and edema on FLAIR images) were segmented with semi-automatic methods such as region growing, signal intensity thresholding, and edge detection, with an open-source software (Medical Image Processing, Analysis and Visualization, https://mipav.cit.nih.gov/). Segmentations were manually corrected by a neuroradiologist as deemed necessary.
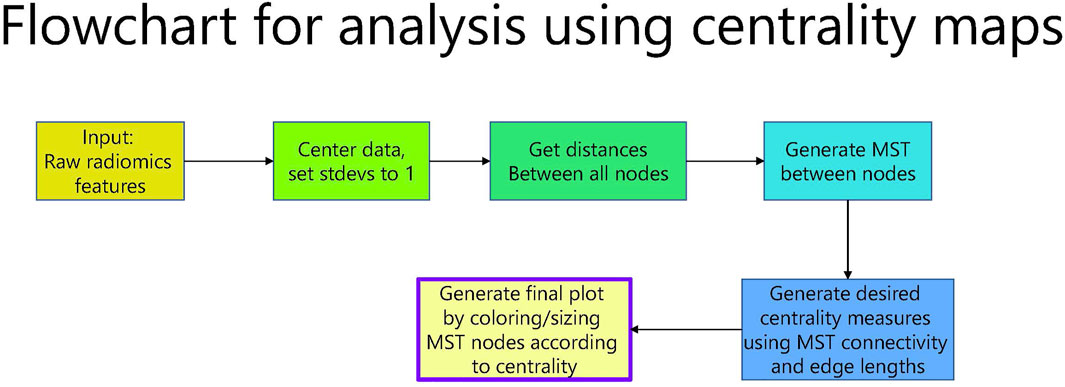
FIGURE 1. Flowchart for analysis using centrality maps.
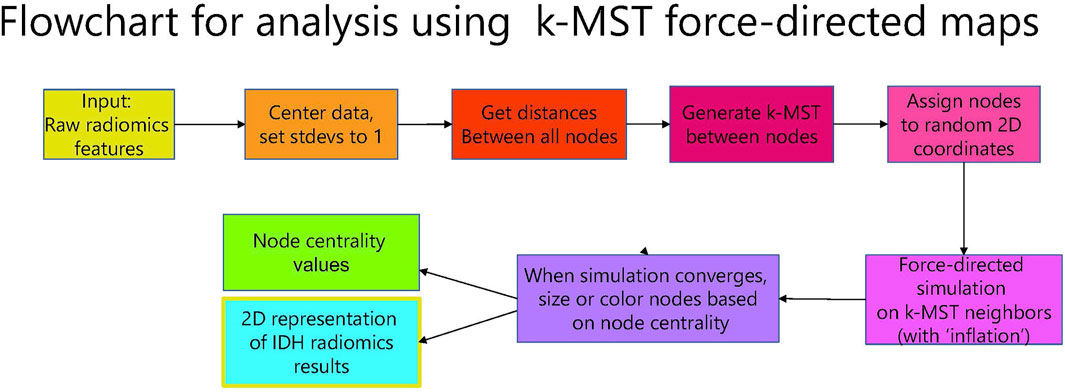
FIGURE 2. Flowchart for analysis using k-MST force-directed maps.
Once MRI post-processing was completed, 467 radiomics features were calculated per patient using the PyRadiomics suite [15]. A full list of features used is included under (Supplementary Table S4). All data was centered to zero and normalized by dividing each column by its standard deviation. To account for the possibility of redundancy or overlap among the radiomics features, our MATLAB pipeline provides the option to perform PCA, retaining only those components which together comprise >98% of the total variance. This step reduces the number of components from the original 467 to 48. Example results of our pipeline using this PCA step are provided in Supplementary Figures; however, as this step did not dramatically change the character of the results, it was not used in the main study.
Next, using the features as dimensions and each patient as a node, we constructed MSTs over the pooled patient data from both groups and carried out the multivariate runs (MVR) test outlined by Friedman and colleagues [12](13) [14]. The Euclidean distance based on the standardized radiomics feature vectors was used to calculate distances between all pairs of subjects. This yields a graph with edge weights based on the distance which is used to construct an MST. For the MVR test, edges connecting dissimilar node-types (i.e., nodes connected from two different groups) are removed, yielding a number of disjoint trees, R. Given two MSTs with Na and Nb nodes, (and N = Na + Nb), Friedman and Rafsky demonstrate that R is normally distributed, with mean equal to
and variance (conditioned on C, the number of pairs of edges that share a common node in the given MST), equal to
This allows rapid, exact, and direct assessment of the degree of significant similarity between the IDH and non-IDH groups.
Next, a variety of node centrality measures were calculated for each node of the MSTs drawn over the IDH and non-IDH groups separately. Six measures of centrality were assessed for each node included: 1) degree centrality; 2) total degree count of neighbors; 3) through-space closeness; 4) through-tree closeness; 5) betweenness; and 6) eigenvector. Degree centralities are simply the number of other nodes to which the node of interest is directly attached; closeness is the inverse of average distance to all other nodes, either through space or through the MST connections; betweenness indicates the proportion of all the shortest paths between nodes in the MST that pass through the node of interest; and eigenvalue centrality, roughly speaking, combines the concepts of degree and betweenness by relating each MST node to the entries of the principal eigenvector of the MST connectivity matrix [16].
The k-MST is an extension of the MST, found by repeating the MST algorithm k times, each time excluding all the connections previously chosen. This allows a richer level of connectivity information which in turn can improve statistical test results such as edge-counting. Here, we use the k-MST as a representation of the underlying structure of multivariate data and apply a simple 2D force-directed layout methodology whereby nodes that are directly connected in the k-MST experience an attractive force. “Reflation” is carried out after each iteration, to counteract the tendency of a wholly-attractive configuration of forces to collapse to a point. Because the k-MST contains only a small fraction of the possible pairwise connections between nodes, and because there are no explicit repulsive forces to calculate, our method allows rapid creation of 2D representations of arbitrarily high-dimensional radiomics datasets.
For the kMST force-directed layouts method for dimension reduction, the steps are as follows: using the distance matrix over the pooled patient nodes, the minimal spanning tree algorithm is iteratively applied, each time setting the distance matrix entries corresponding to chosen edges to a high value so that they are not chosen again. The edges chosen by each successive MST calculation are then saved. For the present work, we used a 5-MST, or 5 iterations.
The method is then initialized by assigning the nodes to random positions within the unit square (we used a uniform distribution was used for this purpose). Next, position updates are iteratively calculated, by summing the attractive ‘forces’ exerted on each node by only its direct neighbors within the MST. The attractive force is “spring-like” in that it increases linearly with distance between nodes.
To avoid having to calculate numerous repulsion effects between all nodes not connected in the kMST, we instead implemented an ‘inflationary’ step: at the end of each iteration the coordinates of the nodes are automatically rescaled to fit just inside the unit square. This inflationary step preserves the configuration changes of each position update while preventing the whole configuration from collapsing to a point.
Two parameters are used to generate the position updates: dEq, the equilibrium distance where attraction between kMST neighbors becomes repulsion with decreasing distance; and kAtt, the relative strength of the attractive force. For this study, we used values of dEq = 0.025 and kAtt = 0.015.
All calculations (after MRI acquisition and processing, and radiomics feature extraction) were implemented directly using a custom MATLAB pipeline. Scripts used are available on Github at https://github.com/Ghoshlab/OSimonScripts.
Results
Node centralities for IDH-mutated and IDH-wildtype patients are displayed using six different centrality definitions in Figure 3 and Supplementary Figure S1, using node size and color to represent centrality. Notably, in this case, the same small number of nodes were consistently chosen as “most central”, despite the wide differences in the centrality definitions applied. Specifically, for the IDH-mutated gliomas, Patient 24 was the ‘most central’ for node degree, node neighbor degree, through-space closeness, and eigenvector centrality, while Patient 80 was the most central in the case of through-tree closeness and betweenness. Among the IDH wild type gliomas, three nodes were prominent: Patient 35 (degree centrality), Patient 37 (neighbor degree, through-tree closeness), and Patient 39 (through-space closeness, eigenvector).
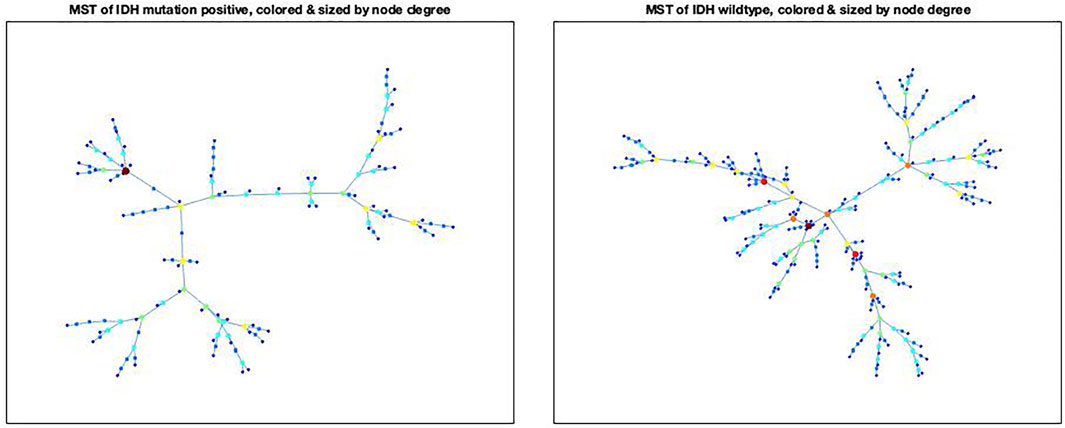
FIGURE 3. MSTs for the IDH mutation positive (Figure 3A) and IDH mutation negative tumors (Figure 3B), with node sizes proportional to degree of the nodes. The X- and Y-axes represent spatial coordinates for visualization of the minimum spanning trees.
These nodes are usually located towards the “center” of the MST, usually at a junction between several sub-trees. Conversely, the lowest-centrality nodes are invariably found at the edges of the MST, among nodes with only one connection (“leaves”). These observations confirm that these measures do indeed reflect the intuitive idea of centrality.
Additionally, when PCA reduction was used to decrease the number of features, nearly all the central nodes remained the same, with the sole exception that in the IDH-wildtype gliomas the highest eigenvector centrality shifted from Patient 39 to Patient 35 (Supplementary Figure S2). This close correspondence suggests that the centrality measures and MST algorithms used are robust to complex manipulations and changes of coordinates, such as those which occur using PCA.
The MVR results for our radiomics dataset (Figure 4) showed a clear distinction between the IDH-mutated and IDH-wildtype groups, consistent with prior literature reporting the strong effect of this mutation on radiomics profiles. Beginning with the pooled MST, the number of separate trees that would be expected in the null case (188.6) far exceeds the actual number resulting from the cut (91). This amounts to a difference of −9.82 standard deviations, effectively excluding the possibility that the groups differ according to chance. Thus, the MVR test of Friedman and Rafsky rejects the null hypothesis of no difference between the two groups with a p-value less than 1 × 10⁻³².
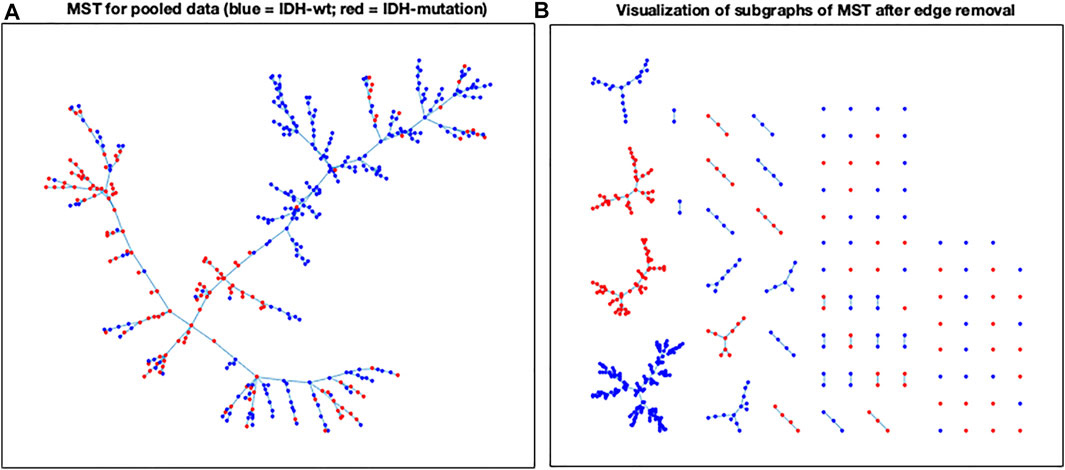
FIGURE 4. (A) The pooled MST before the hybrid-edge cut; (B) A 2-dimensional representation of the subtrees of the MSTs after removing the hybrid edges. The X- and Y-axes represent spatial coordinates for visualization of the minimum spanning trees.
As was the case with the node centralities, the MVR test carried out with PCA reduction to 48 features (Supplementary Figure S3) yielded results similar to the original dataset. While the null expectation value of the number of trees remains the same by definition, number of trees from the actual cut (97), and the total standard deviations from the expectation value (−9.21) reveal a change of only half a standard deviation despite the PCA manipulation. This again helps establish the robustness of these methods to feature selection.
Applying the kMST-force directed algorithm to the 5-MST drawn over the pooled data-points, we found that the method rapidly and effectively produces readily interpretable visual layouts of the group structure. A representative result is shown in Figure 5. The results of three randomly-initialized runs of the algorithm using 3-MST, 5-MST, and 7-MST respectively (Supplementary Figures 4A–I) show that, despite the random initialization and the large number of datapoints involved, the final configurations produced by the algorithm are remarkably consistent overall (notwithstanding mirror-symmetry and rotations), and also reveal a clear though not perfect spatial separation between the two genotype groups. As might be expected, the runs using the lowest-complexity k-MST (the 3-MST) show somewhat more variability in the final structure and also a somewhat different final structure from the others, whereas the 5-MST and 7-MST show quite good consistency both between random initializations and between each other. This strongly indicates that the k-MST, despite its much-simplified structure with respect to the full graph, contains the information necessary for meaningful and reproducible dimension reduction of the data and that its local minimum under force calculation is likely unique. Furthermore, as in the previous approaches, the layouts were consistent and quite similar even when PCA reduction was first carried out (data not shown).
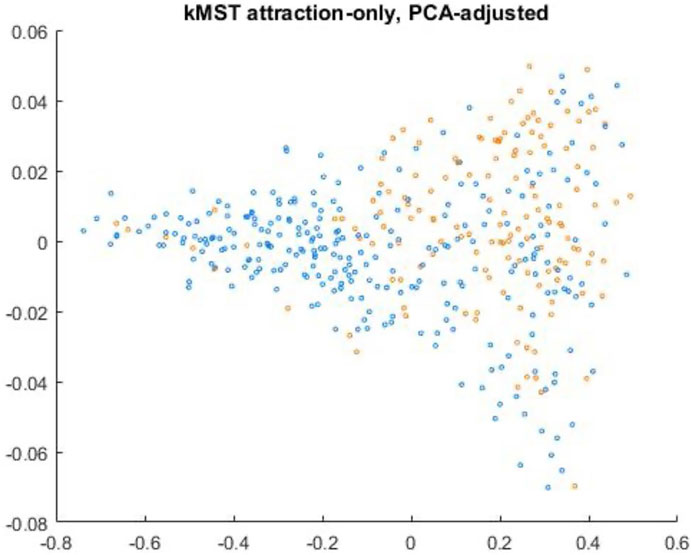
FIGURE 5. Representative example of 5-MST force-directed result using PCA-reduced data. IDH-mutated patients are shown in orange, while IDH-wildtype is blue. The algorithm was run for 1800 iterations, with the values of kEq and kAtt held constant. The X- and Y-axes represent spatial coordinates for visualization of the minimum spanning trees.
Given that the k-MST force-directed algorithm did not perfectly separate the two classes—more non-IDH nodes are present in the region dominated by IDH than vice-versa--we wondered whether the centrality measures would reasonably reflect the location of the nodes with respect to the overall distribution of class examples within the 2D layout, i.e., whether the nodes closest to the center of their class distribution in the layout would have the highest centralities as well. We found this to be generally the case, though the choice of centrality measure does have an effect. Interestingly, we find that eigenvector centrality gives much lower precedence to the “IDH-like” non-IDH cases found in the predominantly region, yielding better separation between IDH and wild-type regions when both centrality and kMST layout are used (Supplementary Figure 4F). Other measures, particularly betweenness, seem to be much less effective at distinguishing ‘IDH-mimics’ from the other wild-types—there are a few IDH-like cases with relatively high betweenness, but this centrality also yield an even clearer overall divide between the main IDH and wild-type than does eigenvector (Supplementary Figure 4E). Degree-based or closeness-based centrality measures, on the other hand, do not appear to be especially effective at discriminating the central regions of the two classes in the kMST layout, even when the difference is exaggerated by squaring the centrality (Supplementary Figures 4A–D).
Discussion
In the foregoing, we have demonstrated the feasibility of a simple graph-theoretical toolkit to address the problems presented by large, high-dimensional radiomic datasets. For the example dataset drawn from IDH-mutated and IDH-wildtype glioma patients, we were able to use MST-based methods to establish highly significant differences between the two groups, to identify patients that are most “representative” of each group using a combination of centrality measures, and to use a simple kMST-based force-directed method to illustrate those centrality measures within the context of a two-dimensional map of the data. Importantly, we find this method converges to a very consistent configuration which can effectively segregate IDH-mutated and IDH wild-type gliomas, especially when combined with centrality measures.
Although there is overlap between the two classes, there is a very clear difference in the overall localization between the two groups. Particularly focusing on the 5-MST and 7-MST—which converged consistently to a roughly triangular 2D point distribution—we see that IDH-wildtype patients tend to group strongly in one corner of the triangle with almost no IDH-mutated patients present, while at another corner and towards the center of the triangle IDH-mutated cases predominate. Notably, a significant minority of IDH-wildtype patients exhibit IDH-like localization, suggesting that the IDH mutation is sufficient but not necessary for an “IDH-like” phenotype. This means that stratification by radiomic features alone may be vulnerable to false positives, in the sense that patients with typically IDH-like radiomic features (at least according to our mode of analysis) may nonetheless lack the IDH mutation. Conversely, there might be further subtypes of IDH-wildtype populations to further characterize, although our study is not sufficiently powered for this type of discovery.
We hypothesize this may be due to other mutations or combinations of mutations that partially phenocopy the IDH mutation. Future genetic studies may help elucidate these IDH-mimicking gene combinations, perhaps by looking for epistatic effects on the IDH pathway [17]. Furthermore, it would be highly worthwhile to track the outcomes of IDH-like patients, to determine whether they in fact share the prognosis generally associated with IDH mutation proper. As noted, our results suggest that the combination of eigenvector centrality and k-MST layouts may be especially useful in distinguishing between wild-type glioma patients that are IDH-like and those that are more ‘typical’.
Among the force-directed layouts methods, the Barnes-Hut algorithm, which coalesces sufficiently distant points into a single center of mass by constructing a quadtree based on a distance criterion, may be the best-known means of simplifying force calculations for very large numbers of points [18]. In our case, however, the use of the k-MST greatly reduces the number of interactions that need to be calculated at each iteration and inherently restrains the calculation only to “sufficiently close” node pairs, so that the Barnes-Hut approach is unnecessary. The replacement of explicit repulsion term calculations with a simple “inflationary” step after each iteration also simplifies the overall calculation while likely reducing the chance of the configuration becoming trapped in “geometrically-frustrated” local minima. Notably, for 5-MST and higher, we saw no evidence of alternative minima for our simulation—in all conditions tested, the overall arrangement of points did not differ qualitatively from the overall pattern seen here. It will be interesting to see if this general pattern is observed for different datasets.
The choice of k for the k-MST is likely to depend on n, the number of observations being handled by the simulation, as Figure 3 suggests that choosing k too low means that the final configuration will be underdetermined. Arguments based on stochastic-block models suggest that there is a minimum value of k below which there is inadequate information to reconstruct the true underlying class-membership; however, this values grows only slowly, as Ω (log n) [19].
With respect to other common dimensional-reduction methods, our “spring-like” approach with stochastic initialization and gradient descent is related to such familiar approaches like t-SNE [20], though we do not assign neighbors using a Gaussian or t-distribution but rather use repeated application of the MST algorithm itself. One potential future issue is that the k-MST approach is likely to be sensitive to class imbalance. If one class comes to be vastly outnumbered by another its members may be less likely to be connected in the k-MST, and hence will not experience the attractive forces that produce strong clustering; conversely, the attraction between relatively few similar nodes may be overwhelmed by the attractive force of a much larger number of adjoining, yet dissimilar nodes.
Even in this case, however, we believe it is likely that the members of the less-populated class will tend either to have a higher chance of being connected through the k-MST (by a similar reasoning to that which motivates the MVR test itself), or will form part of a larger region containing “similar” nodes of the other class (as we see with the considerable number of WT patients whose nodes consistently segregate into the IDH-dominated region). One possible solution to this potential limitation, inspired by work for the MVR test [21], might be simply to weight the attractive forces within the k-MST simulation in inverse proportion to the number of nodes in the class, so that “rarer” nodes attract each other most strongly.
One potential computational limitation of our approach relates to its dependence on the creation of MST, which requires creation of a full-graph distance matrix. Since this contains n2 pairwise distances, the computational overhead will increase with O (n2), limiting the number of data-points that can be calculated. However, clustering-based approaches are known which can be used to generate approximate MSTs that run in O (n3/2), substantially speeding up the distance-matrix bottleneck [22]. A natural next step, therefore, will be to implement and evaluate approximate MSTs, which should allow the processing of hundreds of thousands of data-points in reasonable time.
It is well-known that radiomics approaches can be vulnerable to false positives, particularly in the case where there are more radiomic features than there are patients [23]. Furthermore, it has been noted that “choice of the classification model could lead to variations in the predictive values of the radiomic features up to >30%” [23]. While our approach largely avoids feature-selection issues by effectively condensing the data into a higher-level statistical, graph-theoretical, indeed structural question, further validation studies on other types of radiomics and imaging data are clearly indicated, as such studies can help to eliminate false positives [23].
Even taking this into account, we believe the centrality/MVR/k-MST force-directed combination approach presented here has the potential to greatly simplify the analysis of radiomics data, while simultaneously rendering it far more readily interpretable. By relying on the simple, MVR test—which is parameter-free except with respect to the variable C, itself derived from the pooled data MST--we avoid numerous somewhat arbitrary aspects of testing and analysis with high-dimensional data. Since the MST itself does not depend on any arbitrary parameters, this too provides a simpler, possibly more “objective” approach. As raised by a reviewer, there is an important theoretical question, which involves our centrality based analysis. It is based on the MST, and the relationship between MST-based centrality with the original data-based graph centrality remains an open problem.
In conclusion, we have developed a combination of graph-theoretical approaches that provide rapid visualization, significance testing, and dimensionality reduction for very high-dimensional radiomics (and other) datasets, with the potential for considerable streamlining of the workflow and improved “explainability”. Future investigations will help gauge the effectiveness of this general approach to other radiomics use-cases, as well as to other high-dimensional medical data.
Data Availability Statement
The original contributions presented in the study are included in the article/Supplementary Materials, further inquiries can be directed to the corresponding author.
Author Contributions
OS and DG formulated the design of the study. OS developed and implemented the methodology. All authors provided feedback on its implementation. Y-SC provided the data for the study. OS wrote the first draft, and all authors contributed to writing of subsequent drafts of the manuscript. All authors approved the final version of the manuscript.
Funding
This research has been partially supported by the National Cancer Institute through Grant R01 CA129102. The funding agency played no role in the design or analysis of the study.
Conflict of Interest
The authors declare that the research was conducted in the absence of any commercial or financial relationships that could be construed as a potential conflict of interest.
Publisher’s Note
All claims expressed in this article are solely those of the authors and do not necessarily represent those of their affiliated organizations, or those of the publisher, the editors and the reviewers. Any product that may be evaluated in this article, or claim that may be made by its manufacturer, is not guaranteed or endorsed by the publisher.
Acknowledgments
OS and DG would like to acknowledge the support of NCI R01 CA129102. DG acknowledges the support of the Grohne-Stepp Endowment from the University of Colorado Cancer Center.
Supplementary Material
The Supplementary Material for this article can be found online at: https://www.frontiersin.org/articles/10.3389/fphy.2022.783765/full#supplementary-material
References
1. De Bruijne M. Machine Learning Approaches in Medical Image Analysis: From Detection to Diagnosis. Med Image Anal (2016) 33:94–7. doi:10.1016/j.media.2016.06.032
2. Bhandari AP, Liong R, Koppen J, Murthy SV, Lasocki A. Noninvasive Determination of IDH and 1p19q Status of Lower-Grade Gliomas Using MRI Radiomics: a Systematic Review. AJNR Am J Neuroradiol (2021) 42(1):94–101. doi:10.3174/ajnr.a6875
3. Calabrese E, Villanueva-Meyer JE, Cha S. A Fully Automated Artificial Intelligence Method for Non-invasive, Imaging-Based Identification of Genetic Alterations in Glioblastomas. Sci Rep (2020) 10(1):11852–11. doi:10.1038/s41598-020-68857-8
4. Choi YS, Bae S, Chang JH, Kang S-G, Kim SH, Kim J, et al. Fully Automated Hybrid Approach to Predict the IDH Mutation Status of Gliomas via Deep Learning and Radiomics. Neuro-Oncol. (2021) 23(2):304–13. doi:10.1093/neuonc/noaa177
5. Rogers W, Thulasi Seetha S, Refaee TAG, Lieverse RIY, Granzier RWY, Ibrahim A, et al. Radiomics: from Qualitative to Quantitative Imaging. Bjr (2020) 93:20190948. doi:10.1259/bjr.20190948
6. Hosny A, Aerts HJ, Mak RH. Handcrafted versus Deep Learning Radiomics for Prediction of Cancer Therapy Response. Lancet Digit Heealth (2019) 1(3):E106–107. doi:10.1016/S2589-7500(19)30062-7
7. Arpit D, Jastrzębski S, Ballas N, Krueger D, Bengio E, Kanwal MS, et al. A Closer Look at Memorization in Deep Networks. PMLR (2017). 233–42.
8. Gower JC, Ross GJS. Minimum Spanning Trees and Single Linkage Cluster Analysis. Appl Stat (1969) 18(1):54–64. doi:10.2307/2346439
9. Louf R, Jensen P, Barthelemy M. Emergence of Hierarchy in Cost-Driven Growth of Spatial Networks. Proc. Natl. Acad. Sci. U.S.A. (2013) 110(22):8824–9. doi:10.1073/pnas.1222441110
10. Stam CJ, Tewarie P, Van Dellen E, Van Straaten ECW, Hillebrand A, Van Mieghem P. The Trees and the Forest: Characterization of Complex Brain Networks with Minimum Spanning Trees. Int J Psychophysiol (2014) 92(3):129–38. doi:10.1016/j.ijpsycho.2014.04.001
11. Freeman LC. A Set of Measures of Centrality Based on Betweenness. Sociometry (1977) 40:35–41. doi:10.2307/3033543
12. Chen H, Friedman JH. A New Graph-Based Two-Sample Test for Multivariate and Object Data. J Am Stat Assoc (2017) 112(517):397–409. doi:10.1080/01621459.2016.1147356
13. Friedman JH, Rafsky LC. Multivariate Generalizations of the Wald-Wolfowitz and Smirnov Two-Sample Tests. Ann Stat (1979) 697–717. doi:10.1214/aos/1176344722
14. Friedman JH, Rafsky LC. Graph-theoretic Measures of Multivariate Association and Prediction. Ann Stat (1983) 377–91. doi:10.1214/aos/1176346148
15. Van Griethuysen JJM, Fedorov A, Parmar C, Hosny A, Aucoin N, Narayan V, et al. Computational Radiomics System to Decode the Radiographic Phenotype. Cancer Res(2017) 77(21):e104–e107. doi:10.1158/0008-5472.can-17-0339
16. Newman MEJ. Mathematics of Networks. New Palgrave Encycl Econ (2008) 2:1–8. doi:10.1057/978-1-349-95121-5_2565-1
17. van de Haar J, Canisius S, Yu MK, Voest EE, Wessels LFA, Ideker T. Identifying Epistasis in Cancer Genomes: a Delicate Affair. Cell (2019) 177(6):1375–83. doi:10.1016/j.cell.2019.05.005
18. Barnes J, Hut P. A Hierarchical O(N Log N) Force-Calculation Algorithm. nature (1986) 324(6096):446–9. doi:10.1038/324446a0
19. Moore C. The Computer Science and Physics of Community Detection: Landscapes, Phase Transitions, and Hardness. ArXiv Prepr ArXiv170200467 (2017).
21. Chen H, Chen X, Su Y. A Weighted Edge-Count Two-Sample Test for Multivariate and Object Data. J Am Stat Assoc (2018) 113(523):1146–55. doi:10.1080/01621459.2017.1307757
22. Zhong C, Malinen M, Miao D, Fränti P. Fast Approximate Minimum Spanning Tree Algorithm Based on K-Means. Springer (2013). p. 262–9. doi:10.1007/978-3-642-40261-6_31Fast Approximate Minimum Spanning Tree Algorithm Based on K-Means
Keywords: medical imaging, biostatistics, genotype-phenotype correlation, tree-based methodology, data visualization
Citation: Simon OB, Jain R, Choi Y-, Görg C, Suresh K, Severn C and Ghosh D (2022) A Unified Approach to Analysis of MRI Radiomics of Glioma Using Minimum Spanning Trees. Front. Phys. 10:783765. doi: 10.3389/fphy.2022.783765
Received: 26 September 2021; Accepted: 12 April 2022;
Published: 05 May 2022.
Edited by:
Daniel Rodriguez Gutierrez, Nottingham University Hospitals NHS Trust, United KingdomReviewed by:
Zhiwei Ji, Nanjing Agricultural University, ChinaRoberto Gatta, University of Brescia, Italy
Enrico Capobianco, University of Miami, United States
Copyright © 2022 Simon, Jain, Choi, Görg, Suresh, Severn and Ghosh. This is an open-access article distributed under the terms of the Creative Commons Attribution License (CC BY). The use, distribution or reproduction in other forums is permitted, provided the original author(s) and the copyright owner(s) are credited and that the original publication in this journal is cited, in accordance with accepted academic practice. No use, distribution or reproduction is permitted which does not comply with these terms.
*Correspondence: Debashis Ghosh, ZGViYXNoaXMuZ2hvc2hAY3VhbnNjaHV0ei5lZHU=