- 1Shandong Institute of Advanced Technology, Jinan, China
- 2Laboratory for Space Weather Storms, Institute of Space Science and Applied Technology, Harbin Institute of Technology, Shenzhen, China
- 3State Key Laboratory of Lunar and Planetary Sciences, Macau University of Science and Technology, Macao, China
For magnetopause crossing events, the observed magnetospheric magnetic fields in the vicinity of the subsolar magnetopause frequently present an overshoot structure; that is, in small vicinity of the magnetopause, the closer to the magnetopause, the stronger the magnetospheric magnetic field is. In this investigation, an automatic identification algorithm is developed to rapidly and effectively search the magnetopause crossing events using THEMIS data from 2007 to 2021. Nearly 59% of magnetopause crossing events identified near the subsolar region appear an overshoot structure. The statistical result shows that, for overshoot cases, the normalized change rate of magnetospheric magnetic field near the magnetopause is linearly related to the normalized magnetopause velocity, which means that the overshoot structure may be caused by the redistribution of the magnetospheric magnetic field due to the rapid magnetopause motion.
1 Introduction
The magnetospheric magnetic field (MMF) originates from the Earth’s main field, current systems inside the magnetosphere, for example, ring current, tail current, ionospheric current, field-aligned current [ [1], and references therein], Chapman–Ferraro current on the boundary [2], and the interconnection due to partial penetration of the interplanetary magnetic field into the magnetosphere [3, 4]. The MMF is totally confined in the magnetosphere when ignoring the magnetic reconnection process around the magnetopause. The motion and deformation of the magnetopause will lead to the redistribution of the MMF [4, 5]. The position of the magnetopause is determined by the pressure balance on both sides. As the dynamic pressure of the solar wind varies dramatically, the position of the magnetopause is extremely unstable with the subsolar point distributing from 5 to 22 RE [6, 7], where RE is the radius of the Earth. According to the statistical results of the work of Paschmann et al. [8], the maximum normal velocity of the magnetopause is 367 km/s and the mean value is 51 km/s. This result is consistent with previous investigations [9–12]. The period of fluctuation of the magnetopause is mostly less than 200 s [13, 14], which arises or grows due to the boundary-inherent Kelvin–Helmholtz instability, or external sources, for example, solar wind pressure pulses or waves and disturbances in the foreshock region [15, 16]. On the other hand, the magnetopause is not always a smooth surface. Some local distortions, driven by flux transfer events, Kelvin–Helmholtz waves, and magnetosheath jets, may appear on it [17, 18].
For spacecraft located near the magnetopause, a number of magnetopause crossing events (MCEs) are expected to be detected as the location of the magnetopause is very volatile along with the change of the solar wind conditions, especially when the dynamic pressure pulse structures imping on the magnetosphere. In this study, we analyze the MCEs detected by THEMIS when THEMIS’s apogee was located near the subsolar point. It is found that a large fraction of cases interestingly appear an overshoot structure as observed in the bow shock region [19, 20]; that is, from the magnetosphere to the magnetosheath, the magnetic field intensity increases quickly right before the magnetopause ramp, so the MMF adjacent to the magnetopause is stronger than that further away from the magnetopause. This structure is not rarely observed, but it still has not been paid much attention yet in the community of magnetopause research. To further understand this phenomenon, we carry out a statistical research on the relationship between the change rate of MMF near the magnetopause and the instantaneous speed of the magnetopause motion, based on an overshoot-type MCE database constructed from nearly 15 years’ THEMIS observations at the subsolar region. It is found that the normalized change rate of MMF during the overshoot interval depends linearly on the normalized magnetopause motion speed in the statistical sense.
In Section 2, we give a brief introduction to the THEMIS MCE dataset constructed by an automatic MCE identification algorithm, and then, some typical MCEs are shown to present the interesting overshoot structure in Section 3. A statistical analysis about the dependence of the variation of MMF near the subsolar magnetopause and the magnetopause motion is given in Section 4. In the last section, a brief summary and discussion are given.
2 MCE Hunting Algorithm
The five THEMIS probes were placed in highly elliptical equatorial orbits on 17 February 2007 [6, 21]. Right after the launch, all probes were lined up in the same orbit with a 15.4 RE apogee. Around 2008, the orbits began to separate, with the apogee of THB, THC, THD&E, and THA being 30 RE, 20 RE, 12 RE, and 10 RE, respectively. Since 2011, THB&C became ARTEMIS and orbited the moon, the remaining three Earth-orbiting probes had an apogee of approximately 12 RE. The apogee rotated slowly around Earth to cover the dayside, dawnside, nightside, and duskside of the magnetosphere. In this study, the ion data from the electrostatic analyzer [22] and magnetic field measurements provided by the fluxgate magnetometer [23], both with the time resolution of ∼ 3 s, are used to identify MCEs.
Manual identification of MCEs can be a labor intensive task, since for the spacecraft located near the magnetopause, a number of MCEs are expected to be detected as the location of the magnetopause is dynamically controlled by the change of the solar wind conditions and inherent waves. Especially in a long-term survey, with hundreds or thousands of potential MCEs, manual identification becomes impractical [24]. On the other hand, manual identification is bound to be biased in some way. An observation classified as a MCE by one observer will not necessarily be classified as such by another observer [12]. To improve the identification efficiency, some automatic MCE identification routines were developed. MCEs have been automatically identified [7, 13, 24] in terms of the distinct difference between the disturbance level of the magnetic field in the magnetosphere and in the magnetosheath. However, some structures, such as current sheet in the magnetosheath, may also exhibit a large difference in the disturbance of the magnetic field with respect to the background magnetosheath. These structures may be mistaken for MCEs under this simple criterion. Suvorova [25] established two criteria for GOES and LANL to identify geosynchronous MCEs. For GOES (without particle data), their criterion is the correlation between the magnetic field observed by GOES and upstream monitor and the deviation of the observed magnetic field from the MMF. For LANL (without magnetic field data), their criterion is the difference of the ratio of density and temperature of high-energy ions in the magnetosheath and in the magnetosphere. These two criteria can only be used in geosynchronous MCE identification. Jelinek et al. [26] used the ratio of the parameters (magnetic field intensity and plasma density) observed by THEMIS and ACE at the same time to determine the most probable magnetopause locations in a statistical sense but failed to give the accurate magnetopause crossing time.
In this study, we develop a new algorithm to automatically identify MCEs and accurately determine the boundary layer between the magnetosheath and the magnetosphere using the in situ plasma and magnetic field data. The automatic identification of MCEs is designed in a four-step manner.
1) STEP 1: recognization of the region in which the probe is located (magnetosphere or magnetosheath).
In STEP 1, ion spectral energy flux density is used to distinguish the region in which the probe is located, but when the probe is located in the inner magnetosphere, the quality of the particle data measured by ESA is not good and missing data often occur. On the other hand, Park et al. [7] mentioned that the position of the subsolar magnetopause ranges from 5 to 22 RE. Here, the probe is regarded to be located in the magnetosphere, if the radial distance of the probe from the Earth, R, is less than 5 RE.
Figure 1 shows the ion spectral energy flux measured by THD in the magnetosphere (left) and in the magnetosheath (right). The two energy spectral curves are distinctly different: in the magnetosheath, the flux of middle energy is high and the fluxes of low and high energy are low; contrarily, the high energy flux in the magnetosphere is high. To describe the characteristics of the energy spectral curve, some parameters are defined. emax is the logarithmic value of energy (unit is eV) corresponding to the maximum flux of ion spectral flux density (see Figure 1). eleft and eright are the logarithmic value of energies on both sides of emax corresponding to the flux one-tenth lower than the maximum flux.
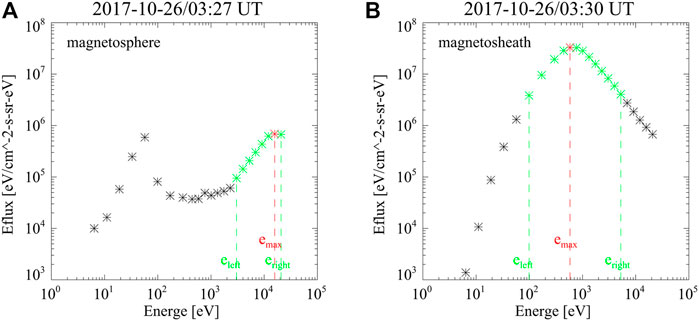
FIGURE 1. (A,B) Ion spectral energy flux densities observed by THD in the magnetosphere and magnetosheath, respectively. The observation times are marked in the title of each subfigure. The red asterisks denote the maximum flux, and the green asterisks indicate the point at which the flux is one-tenth lower than the maximum flux.
The probe is considered to be located in the magnetosphere, if the following conditions are satisfied:
• R ≤ 5 RE ⋃ emax ∉ [2, 3.5]
If the following condition is satisfied, the probe is considered to be located in the magnetosheath:
• R > 5 RE
• emax ∈ (2, 3.5) ⋂ eright − emax > 0.5 ⋂ emax − eleft > 0.5 ⋂ eright − eleft > 1
2) STEP 2: finding the candidate crossing time interval.
Based on the result of the region recognized in STEP 1, the candidate crossing time intervals, [tsp,app, tsh,app], are searched, where tsp,app denotes the start time (magnetospheric side) of crossing and tsh,app denotes the end time (magnetosheath side) of crossing. To avoid possible misjudgment, some more restrictions on the selection of MCEs are needed:
• Probe stays in the magnetosphere or magnetosheath region at least for 1 minute
• MCE completes in less than 1 minute
Note that these time constraints are mainly used to avoid possible misjudgment in STEP 1. It does not mean that the final result must meet the constraints in this step, as the next step slightly adjusts the start and end times of crossing to get the accurate one.
3) STEP 3: obtaining the accurate crossing time interval.
The third step is used to get the accurate crossing time based on the difference of the strength and disturbance level of Bz (the Z component of the magnetic field) in the magnetosphere and in the magnetosheath. As shown in Figure 2, the accurate start time of crossing is searched from tsp,app − 60 to tsh,app + 60 point by point, which satisfies the following conditions:
• Bz [ti] − Bz [ti+1] > 3σ(Bz,sp) (green asterisks in Figure 2)
•
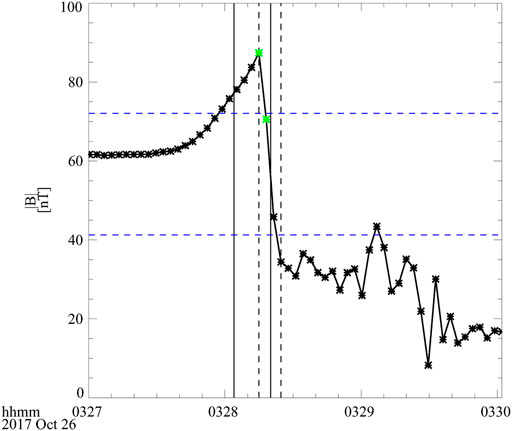
FIGURE 2. Schematic picture to show how to get the accurate magnetopause crossing time in STEP 3. The solid (dashed) vertical lines denote the crossing time interval obtained in STEP 2 (STEP 3).
The end time of crossing is the first time point that satisfies the following:
• Bz [ti] < Bz, max − 0.75(Bz, max − Bz, min) (lower blue dashed horizontal line)
Here, Bz [ti] is the Z component of the magnetic field in the GSM coordinate system at time ti; σ(Bz,sp) is the standard deviation of Bz observed within 1 minute just inside the magnetopause; Bz, max is the maximum value of Bz observed within 1 min from the magnetopause crossing time; and Bz, min is its minimum value.
4) STEP 4: confirming the crossing time interval.
The last step is to confirm the crossing time interval based on the criteria of Ivchenko et al. [13]:
• MCE should be completed within 30 s
• The standard deviation of magnetic field in the magnetospheric side is required to be less than 40% of that in the magnetosheath side
• The northward component of the MMF is required to exceed 10 nT
• The northward component of the MMF is required to be at least a factor of 1.3 greater than the corresponding magnetosheath component
According to the used criteria, our method is more suitable to identify MCEs when the magnetic field in the magnetosheath is southward. It can also obtain a good result when the magnetic field in the magnetosheath is northward, but it requires that Bz in the magnetosphere is 1.3 times bigger than that in the magnetosheath. Exactly speaking, this method may lose some cases, especially when the magnetic field strengths on the magnetospheric and magnetosheath sides are nearly equal to each other. These cases usually cannot give a clear magnetopause crossing time even by manual inspection. So, it is rational to omit them. Our procedure has been applied to the observations of five THEMIS probes between 2007 and 2021 to search for MCEs. As we focus on the MCEs near the subsolar region, the MCEs observed only within 30o between the Sun–Earth line are suitable for further research. As the position of the magnetopause and the magnetic field just inside the magnetopause can be affected by the dipole tilt angle [27, 28], the constraint that the MCEs should be within 20o from the equator in the sum of the latitude of the magnetopause and the dipole tilt angle is added to the selection criteria. Eventually, 10,462 events of magnetopause crossing have been successfully identified by our method, which constructs an MCE database for further statistical study on the large-scale magnetopause structures and some important scientific problems related to small-scale structures of the magnetopause. In this study, we focus on the variation features of the MMF just inside the subsolar magnetopause.
3 Overshoot Structure Adjacent to the Magnetopause
Figures 3–5 show six typical subsolar MCEs identified by our automatic identification algorithm. The parameters in each figure from top to bottom are ion spectral energy flux density, three components of the magnetic field, magnetic field intensity, bulk velocity of ions, and position of the probe. As the inspected time interval is short and the velocity of the probe is very small relative to the speed of the magnetopause, the probes are regarded as being located at fixed points during the inspected interval.
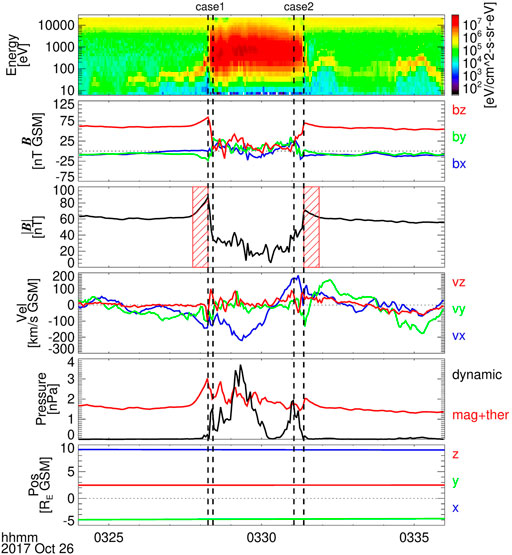
FIGURE 3. Typical subsolar MCEs with an overshoot structure observed by THD between 03:24 UT and 03:36 UT on 26 October 2017. The parameters from top to bottom are ion spectral energy flux density, the three components of the magnetic field, the magnetic field strength, the bulk velocity of ion, various pressure (the red line means the total of magnetic and thermal pressure), and the position of THD. The time intervals marked by two vertical dashed lines are the magnetopause crossing time identified by our MCE automatic identification algorithm. The change rate of MMF is calculated by data measured during the time interval marked by oblique stripes.
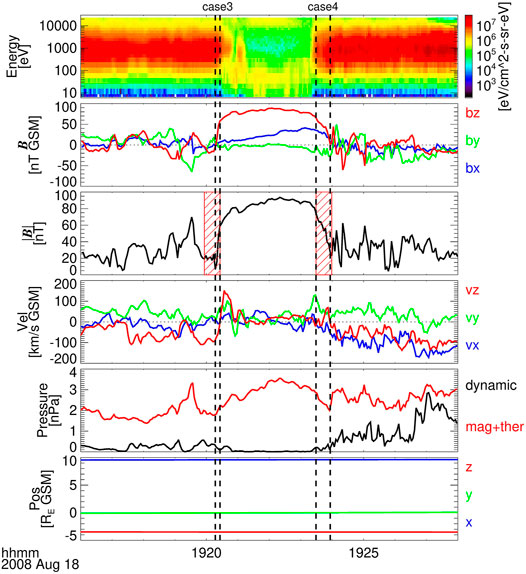
FIGURE 4. Typical subsolar MCEs without an overshoot structure observed by THA between 19:16 UT and 19:28 UT on 18 August 2008. The format is the same as in Figure 3.
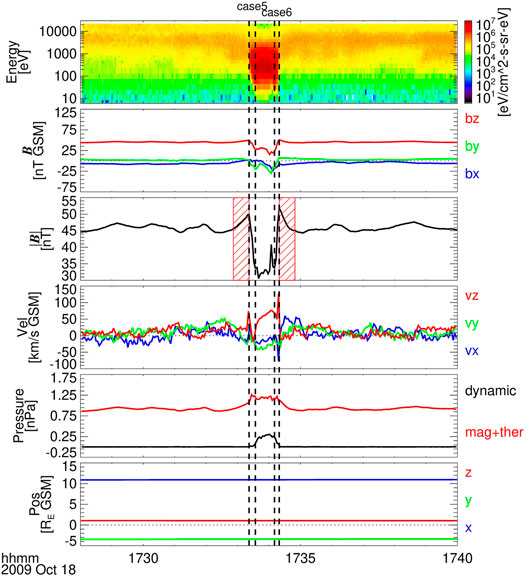
FIGURE 5. Typical subsolar MCEs with overshoot structure observed by THE between 17:28 UT and 17:40 UT on 18 October 2009. The format is the same as in Figure 3.
Figure 3 presents two consecutive MCEs detected by THD between 03:24 UT and 03:36 UT on 26 October 2017. At the beginning of this time interval, THD was located in the magnetosphere where the high-energy ions and strong magnetic fields were dominated. Around 03:28:14 UT, an abrupt decrease in the magnetic field strength and increase in the particle flux were observed, indicating that the magnetopause was moving inward and crossed THD. The crossing direction, Dir, is defined as 1 when the probe crosses the magnetopause from the magnetosphere to the magnetosheath and equal to -1 when the probe crosses in the opposite direction. The regions between two vertical dotted lines are procedure-given ramps of the magnetopause crossing, which denote the sharpest field change between the magnetosphere and the magnetosheath. It can be seen that, from the magnetosphere to the magnetosheath, the magnetic field in the vicinity of the ramp first increased gradually from a relatively stable state and then decreased sharply, which resembles a magnetic overshoot structure that is frequently observed at planetary bow shocks. The MMF strength observed by THD within 30 s adjacent to the magnetopause crossing time increased quickly and arrived at its peak just inside the magnetopause, B0 = 83.71 nT. The variation of MMF can be fitted by a straight line. The slope of the fitted line, SB, is 0.73 nT/s, and the mean absolute deviation from the observation, MD, is 0.33 nT. At 03:28:14 UT, the magnetopause was located at (9.1, -3.8, 2.5) RE in the GSM coordinate system, and the magnetopause standoff distance, R0, is 10.19 RE. Subsequently, the magnetopause moved outward and crossed THD again at 03:31:23 UT. After the second MCE, MMF decreased quickly from its peak value (B0 is 69.15 nT). The change of MMF can also be fitted by a straight line with SB = −0.28 nT/s and MD = 0.38 nT.
Figure 4 shows the observations of THA between 19:16 UT and 19:28 UT on 18 August 2008 when THA was located at (9.6, -0.01, -3.5) RE. THA was located in the magnetosheath at the start time, and it crossed the magnetopause at 19:20:26 UT. Subsequently, the magnetopause moved inward and crossed THA at 19:23:56 UT. It can be seen from case 3 that, unlike case 2, the MMF increased gradually, and it can also be fitted by a straight line with SB = 0.82 nT/s and MD = 0.87 nT. On the other hand, in case 4, unlike case 1, the MMF changed irregularly (MD = 1.56 nT), although the overall trend was decreasing.
Figure 5 presents two consecutive MCEs detected by THE during the interval between 17:28 UT and 17:40 UT on 18 October 2009. During this time interval, THE was located at (10.9, -3.4, 1.0) RE. At the beginning of this time interval, THE was located in the magnetosphere, and it crossed the magnetopause around 17:33:22 UT. The magnetic field just inside the magnetopause increased linearly with SB = 0.15 nT/s and MD = 0.09 nT. The magnetopause moved outward and crossed THE again at 17:34:10 UT. After the second MCE, the MMF adjacent to the magnetopause also showed an overshoot structure with SB = −0.27 nT/s and MD = 0.44 nT. For the two events, although the MMF had some oscillations in 17:28–17:32 and 17:35–17:40, which were possibly triggered by magnetopause motion or other small structures appearing on the magnetopause, the overshoot can be easily identified.
Thousands of MCEs have been detected by the five THEMIS probes. After visual inspection of the variations of MMFs just inside the magnetopause, it is found that, like case 1, case 2, case 5, and case 6, an overshoot structure, that is, from the magnetosphere to the magnetosheath, the magnetic field adjacent to the magnetopause plane increases quickly in a short interval from a relatively stable MMF state and then decreases sharply at the crossing ramp, is very common. Here, the criteria to judge an overshoot structure are as follows: MD is smaller than 1 nT and SB*Dir > 0. Totally, we got 6,170
4 Relationship Between Overshoot and the Magnetopause Motion
A statistical research on the relationship between the magnetic field intensity at the point fixed on the magnetopause, B0, and the subsolar magnetopause standoff distance, R0, was carried out by Shue et al. [29]. In their work, a simple equation was obtained to fit their dependence based on 614 subsolar MCEs with plateau magnetic fields in the magnetospheric side:
where the power law exponent, D, is used in contrast to the expected -3 for the pure dipole magnetic field. Is this equation still valid under an overshoot structure? Overshoot structure means that the magnetosphere is not in a steady state; this situation is most likely caused by the motion of magnetopause. So, we will conduct a statistical research on the relationship between overshoot and the magnetopause motion in the following.
The normal speed of the magnetopause, Vmp, can be obtained by the de Hoffmann–Teller velocity [30], VHT, and the magnetopause normal direction is obtained by constrained minimum variance analysis [31], nmvabc. The ratio of the middle and the smallest eigenvalue obtained in the constrained minimum variance analysis procedure, λ2/λ3, marks the quality of the normal, and the larger the λ2/λ3, the more reliable the normal, and the threshold is often taken as 2 [32]. The angle between the magnetopause normal calculated by constrained minimum variance analysis and by Shue et al. [33], Φ, is also recorded to indicate the degree of magnetopause deformation from the normally smoothed magnetopause. The larger the Φ, the greater the deformation. On the other hand, the correlation coefficient of two electric fields calculated by E1 = − v × B and EHT = − VHT × B (v, B are the ion bulk velocity and magnetic field observed by the probe adjacent to the magnetopause, respectively), HTcc, denotes the quality of the de Hoffmann–Teller frame, and it ranges from 0 to 1. The larger the HTcc, the more reliable the de Hoffmann–Teller frame. The reliability of the magnetopause normal velocity depends on the reliability of the normal direction, nmvabc, and de Hoffmann–Teller velocity, VHT. Three criteria with limits on λ2/λ3, HTcc, and Φ are used to select cases with reliable normal velocity, which are shown in Table 1. λ2/λ3 > 5 guarantees the reliability of the calculated normal direction, HTcc > 0.8 ensures that the calculated de Hoffmann–Teller frame is reliable, and Φ < 20o denotes that the magnetopause is not greatly deformed. Among the identified MCEs with overshoot, 1,641 cases meet these requirements, and the corresponding normal velocities are calculated.
The interplanetary magnetic field direction may have a great influence on the state of the magnetosphere, but the uncertainty of the traveling time of solar wind from bow shock to the magnetopause is large, and the magnetic field direction may change when they travel to the magnetosheath. Figures 3 and 4 clearly show the existence of the turbulent fluctuations of the magnetic field and velocity in the magnetosheath. To date, a number of distinct case studies and a few statistical explorations at different parts of the magnetosheath show that the turbulence feature is highly related to the background and upstream conditions [34]. Magnetosheath turbulence will disconnect the Bz components of the magnetic field in the solar wind and near magnetopause. Pulinets et al. [35] show that the sign of the Bz near the magnetopause subsolar point does not coincide with the sign of interplanetary magnetic field Bz in
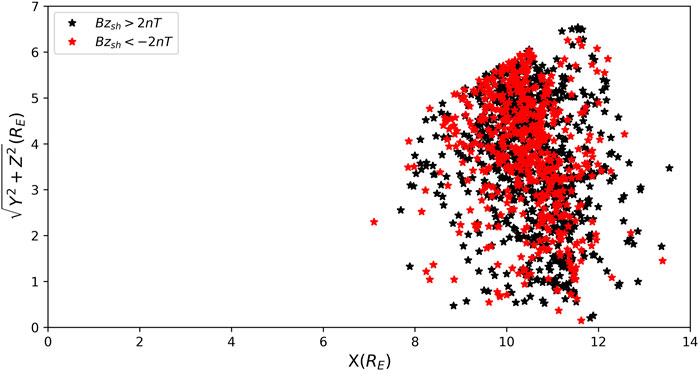
FIGURE 6. Distribution of the location of magnetopause crossing events in the (x,
Figure 7 shows the statistical results based on these events. In Figure 7A, log10(B0) is plotted against log10 (R0) for the northward magnetosheath magnetic field. Figure 7B shows the relation between SB/B0 and Vmp/R0 for the northward magnetosheath magnetic field. Figure 7C and Figure 7D are drawn in the same format as Figure 7A and Figure 7B, respectively, except for the southward magnetosheath magnetic field. These data can be fitted by straight lines, and the fitting parameters are integrated into Table 2. It can be seen that log10(B0) and log10 (R0) have a good linear relationship in Figures 7A,C, and their correlation coefficients, cc, are -0.89 and -0.87, respectively. An F test is performed to evaluate the confidence level of a fit [36]. The critical F value tabulated with 95% confidence and 921 (585) degrees of freedom is 3.86 (3.86). The calculated F values from the data are 3,483 and 1,797, which are much larger than the critical F value. This demonstrates the rationality of Eq. 1. The normalized change rate of MMF, SB/B0, and the normalized speed of the magnetopause, Vmp/R0, shown in Figures 7C,D, all have a clear linear relationship with cc equal to -0.68 and -0.71, respectively, and the calculated F value (806 and 588) is also much larger than the critical F value.
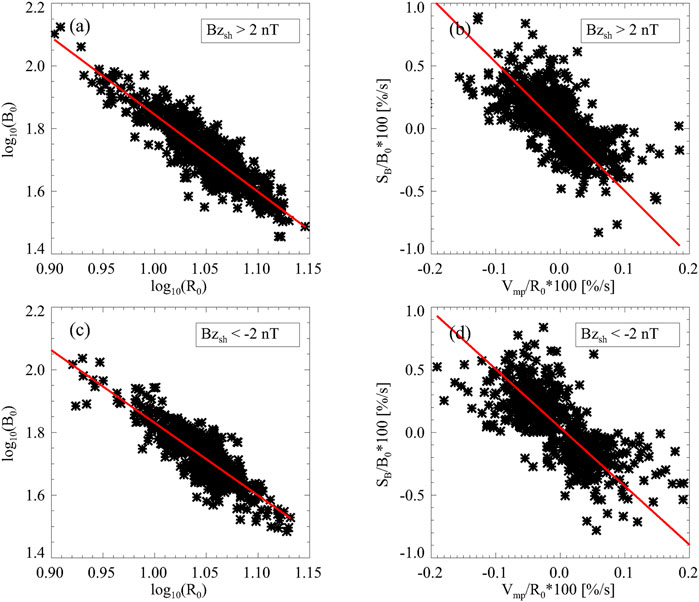
FIGURE 7. Statistical results based on MCEs with an overshoot structure. (A) Here, log10(B0) is plotted against log10 (R0) for Bzsh > 2nT. (B) The relation of SB/B0 and Vmp/R0 for Bzsh > 2nT. (C) and (D) Plotted in the same format as in (A) and (B), respectively, except for Bzsh < − 2nT. These data are fitted by straight lines shown by red color.

TABLE 2. Some parameters in Figure 7.
5 Summary and Discussion
In this study, the variation of the MMF just inside the subsolar magnetopause is studied, and we find that more than half of the MCEs show an overshoot structure. It is also found that the normalized change rate of the magnetic field intensity just inside the subsolar magnetopause is linearly related to the normalized velocity of the magnetopause in cases showing an overshoot structure.
It is reasonable to consider that the overshoot may be a certain kind of the magnetopause current layer itself. Generally, the magnetopause is made up of the magnetopause current (it may be composed of several current layers). Some other structures will be distributed on both sides, such as the depletion layer, magnetosheath boundary layer, and low latitude boundary layer. However, according to previous studies, no evidence indicated that these current sheets and structures can result in the formation of the overshoot magnetic structure near the magnetopause. In addition, some kinds of waves and local indentations may appear on the magnetopause, which have been reported in few case studies. These structures may be common (although few reported), but so far, there is no statistical study on this issue. Although they are possibly responsible for the formation of the overshoot in a statistical sense, it is difficult to explain the linear relationship between the variation of magnetic field and the magnetopause motion for this kind of overshoot. To study the wave propagation and the indentation at the magnetopause surface, multiple spacecraft data analyses are needed, and it is more suitable for a case study. For a single spacecraft, it is impossible to distinguish whether the magnetic field variation comes from spatial or temporal effect.
The fitting result between log10(B0) and log10 (R0) shows that the magnetic field strength just inside the magnetopause with the northward magnetosheath magnetic field is usually larger than that with the southward magnetosheath magnetic field. This result is consistent with the results of the work of Shue et al. [29] and Wang et al. [37]. The fitting result between SB/B0 and Vmp/R0 shows that the magnetic field strength just inside the magnetopause with the northward magnetosheath magnetic field may be slightly more compressed than that with the southward magnetosheath magnetic field with the same inward magnetopause velocity, as the slope in Figure 7B is a little smaller than that in Figure 7D. This effect may be caused by the magnetic erosion under the southward magnetosheath magnetic field [38].
Considering the aforementioned information, we think the temporal change due to magnetosphere compression or decompression is very likely to be responsible for the gradual magnetic increase (overshoot under magnetopause inward motion) or decrease (overshoot under magnetopause outward motion). Here, we give a brief explanation to the overshoot structure. When the magnetopause moves inward or outward rapidly, the MMF will change dramatically resulting from the quick change of position and intensity of the magnetopause current system. One probe at a fixed position in the magnetosphere near the subsolar magnetopause will experience a very rapid increasing or decreasing magnetic field due to the reconfiguration of MMF, in response to the sudden compression or decompression of the magnetosphere. Therefore, the overshoot structure is expected to be formed. Likewise, when the magnetopause is stable or the motion of magnetopause is relatively slow, the variations of MMF at a fixed point can be negligible. In addition, sometimes when the magnetopause moves slowly, the influence of other processes (e.g., plasma wave and other current systems) may result in the irregular variation of MMF near the magnetopause.
Data Availability Statement
The raw data supporting the conclusions of this article will be made available by the authors, without undue reservation.
Author Contributions
XS developed the MCE automatic hunting approach and wrote the draft. XS and PZ performed the data analysis and result analysis. All authors participated in discussions and revisions on the manuscript.
Funding
This work was supported by the National Natural Science Foundation of China (Grant No. 41731067), the Guangdong Basic and Applied Basic Research Foundation (Grant No. 2019A1515011067), and the Shenzhen Natural Science Fund (the Stable Support Plan Program GXWD20201230155427003-20200822192703001).
Conflict of Interest
The authors declare that the research was conducted in the absence of any commercial or financial relationships that could be construed as a potential conflict of interest.
Publisher’s Note
All claims expressed in this article are solely those of the authors and do not necessarily represent those of their affiliated organizations, or those of the publisher, the editors, and the reviewers. Any product that may be evaluated in this article, or claim that may be made by its manufacturer, is not guaranteed or endorsed by the publisher.
Acknowledgments
The authors acknowledge NASA contract NAS5-02099 and V. Angelopoulos for the use of data from the THEMIS Mission. Specifically, they thank C. W. Carlson and J. P. McFadden for the use of ESA data and K. H. Glassmeier, U. Auster, and W. Baumjohann for the use of FGM data provided under the lead of the Technical University of Braunschweig and with financial support through the German Ministry for Economy and Technology and the German Center for Aviation and Space (DLR) under contract 50OC0302.
References
1. Ganushkina NY, Liemohn MW, Dubyagin S, Daglis IA, Dandouras I, De Zeeuw DL, et al. Defining and Resolving Current Systems in Geospace. Ann Geophys (2015) 33:1369–402. doi:10.5194/angeo-33-1369-2015
2. Chapman S, Ferraro VCA. A New Theory of Magnetic Storms. J Geophys Res (1930) 38:79–96. doi:10.1038/126129a0
3. Pudovkin MI, Semenov VS. Peculiarities of the MHD-Flow by the Magnetopause and Generation of the Electric Field in the Magnetosphere. Ann de Geophysique (1977) 33:423–7.
4. Tsyganenko NA. Effects of the Solar Wind Conditions in the Global Magnetospheric Configurations as Deduced from Data-Based Field Models (Invited). In: EJ Rolfe, and B Kaldeich, editors. International Conference on Substorms, Versailles, France, 12-17, May, 1996. ESA Special Publication (1996). p. 181.
5. Song X, Zuo P, Feng X, Shue J-H, Wang Y, Jiang C, et al. Abnormal Magnetospheric Magnetic Gradient Direction Reverse Around the Indented Magnetopause. Astrophys Space Sci (2019) 364:146. doi:10.1007/s10509-019-3635-8
6. Rufenach CL, Martin RF, Sauer HH. A Study of Geosynchronous Magnetopause Crossings. J Geophys Res (1989) 94:15125–34. doi:10.1029/JA094iA11p15125
7. Park E, Moon Y-J, Lee K. Observational Test of Empirical Magnetopause Location Models Using Geosynchronous Satellite Data. J Geophys Res Space Phys (2016) 121:10,994–11,006. doi:10.1002/2015ja022271
8. Paschmann G, Haaland SE, Phan TD, Sonnerup BUÖ, Burch JL, Torbert RB, et al. Large-scale Survey of the Structure of the Dayside Magnetopause by Mms. J Geophys Res Space Phys (2018) 123:2018–33. doi:10.1002/2017ja025121
9. Berchem J, Russell CT. The Thickness of the Magnetopause Current Layer: ISEE 1 and 2 Observations. J Geophys Res (1982) 87:2108–14. doi:10.1029/JA087iA04p02108
10. Le G, Russell CT. The Thickness and Structure of High Beta Magnetopause Current Layer. Geophys Res Lett (1994) 21:2451–4. doi:10.1029/94gl02292
11. Phan TD, Paschmann G. Low-latitude Dayside Magnetopause and Boundary Layer for High Magnetic Shear: 1. Structure and Motion. J Geophys Res (1996) 101:7801–15. doi:10.1029/95ja03752
12. Haaland S, Reistad J, Tenfjord P, Gjerloev J, Maes L, DeKeyser J, et al. Characteristics of the Flank Magnetopause: Cluster Observations. J Geophys Res Space Phys (2014) 119:9019–37. doi:10.1002/2014ja020539
13. Ivchenko NV, Sibeck DG, Takahashi K, Kokubun S. A Statistical Study of the Magnetosphere Boundary Crossings by the Geotail Satellite. Geophys Res Lett (2000) 27:2881–4. doi:10.1029/2000gl000020
14. Plaschke F, Glassmeier K-H, Auster HU, Angelopoulos V, Constantinescu OD, Fornaçon K-H, et al. Statistical Study of the Magnetopause Motion: First Results from Themis. J Geophys Res (2009) 114:A00C10. doi:10.1029/2008ja013423
15. Yumoto K. Low-frequency Upstream Wave as a Probable Source of Low-Latitude Pc 3-4 Magnetic Pulsations. Planet Space Sci (1985) 33:239–49. doi:10.1016/0032-0633(85)90133-3
16. Plaschke F, Angelopoulos V, Glassmeier K-H. Magnetopause Surface Waves: Themis Observations Compared to Mhd Theory. J Geophys Res Space Phys (2013) 118:1483–99. doi:10.1002/jgra.50147
17. Dmitriev AV, Suvorova AV. Traveling Magnetopause Distortion Related to a Large-Scale Magnetosheath Plasma Jet: Themis and Ground-Based Observations. J Geophys Research-Space Phys (2012) 117:A08217. doi:10.1029/2011ja016861
18. Plaschke F, Hietala H, Archer H, Blanco-Cano M, Kajdič X, Karlsson P, et al. Jets Downstream of Collisionless Shocks. Space Sci Rev (2018) 214:81. doi:10.1007/s11214-018-0516-3
19. Heppner JP, Sugiura M, Skillman TL, Ledley BG, Campbell M. Ogo-a Magnetic Field Observations. J Geophys Res (1967-1977) (1967) 72:5417–71. doi:10.1029/JZ072i021p05417
20. Russell CT, Greenstadt EW. Initial ISEE Magnetometer Results: Shock Observation. Space Sci Rev (1979) 23:3–37. doi:10.1007/BF00174109
21. Angelopoulos V. The Themis mission. Space Sci Rev (2008) 141:5–34. doi:10.1007/s11214-008-9336-1
22. Auster HU, Glassmeier KH, Magnes W, Aydogar O, Baumjohann W, Constantinescu D, et al. The Themis Fluxgate Magnetometer. Space Sci Rev (2008) 141:235–64. doi:10.1007/s11214-008-9365-9
23. McFadden JP, Carlson CW, Larson D, Ludlam M, Abiad R, Elliott B, et al. The Themis Esa Plasma Instrument and In-Flight Calibration. Space Sci Rev (2008) 141:277–302. doi:10.1007/s11214-008-9440-2
24. Case NA, Wild JA. The Location of the Earth's Magnetopause: A Comparison of Modeled Position and In Situ Cluster Data. J Geophys Res Space Phys (2013) 118:6127–35. doi:10.1002/jgra.50572
25. Suvorova A. Necessary Conditions for Geosynchronous Magnetopause Crossings. J Geophys Res (2005) 110:A01206. doi:10.1029/2003ja010079
26. Jelínek K, Němeček Z, Šafránková J. A New Approach to Magnetopause and bow Shock Modeling Based on Automated Region Identification. J Geophys Res (2012) 117:A05208. doi:10.1029/2011ja017252
27. Spreiter JR, Briggs BR. Theoretical Determination of the Form of the Boundary of the Solar Corpuscular Stream Produced by Interaction with the Magnetic Dipole Field of the Earth. J Geophys Res (1962-1977) (1962) 67:37–51. doi:10.1029/JZ067i001p00037
28. Petrinec SM, Russell CT. An Examination of the Effect of Dipole Tilt Angle and Cusp Regions on the Shape of the Dayside Magnetopause. J Geophys Res (1995) 100:9559–66. doi:10.1029/94JA03315
29. Shue J-H, Chen Y-S, Hsieh W-C, Nowada M, Lee BS, Song P, et al. Uneven Compression Levels of Earth's Magnetic fields by Shocked Solar Wind. J Geophys Res (2011) 116:A02203. doi:10.1029/2010ja016149
30. De Hoffmann F, Teller E. Magneto-hydrodynamic Shocks. Phys Rev (1950) 80:692–703. doi:10.1103/physrev.80.692
31. Sonnerup BUO, Scheible M. Minimum and Maximum Variance Analysis. ISSI Scientific Rep Ser (1998) 1:185–220.
32. Neugebauer M, Alexander CJ. Shuffling Foot Points and Magnetohydrodynamic Discontinuities in the Solar Wind. J Geophys Res (1991) 96:9409. doi:10.1029/91JA00566
33. Shue J-H, Song P, Russell CT, Steinberg JT, Chao JK, Zastenker G, et al. Magnetopause Location under Extreme Solar Wind Conditions. J Geophys Res (1998) 103:17691–700. doi:10.1029/98ja01103
34. Rakhmanova L, Riazantseva M, Zastenker G. Plasma and Magnetic Field Turbulence in the Earth's Magnetosheath at Ion Scales. Front Astron Space Sci (2021) 7:616635. doi:10.3389/fspas.2020.616635
35. Pulinets MS, Antonova EE, Riazantseva MO, Znatkova SS, Kirpichev IP. Comparison of the Magnetic Field before the Subsolar Magnetopause with the Magnetic Field in the Solar Wind before the bow Shock. Adv Space Res (2014) 54:604–16. doi:10.1016/j.asr.2014.04.023
36. Bevington PR, Robinson DK. Data Reduction and Error Analysis for the Physical Sciences. New York: McGraw-Hill (2003).
37. Wang M, Lu J, Liu Z, Pei S. Dependence of Magnetic Field Just inside the Magnetopause on Subsolar Standoff Distance: Global Mhd Results. Chin Sci Bull (2012) 57:1438–42. doi:10.1007/s11434-011-4961-6
Keywords: magnetopause motion, magnetospheric magnetic field, overshoot, solar wind, spacecraft data analysis
Citation: Song X, Zuo P, Shen Z, Feng X, Xu X, Wang Y, Jiang C and Luo X (2022) Overshoot Structure Near the Earth’s Subsolar Magnetopause Generated by Magnetopause Motions. Front. Phys. 10:775792. doi: 10.3389/fphy.2022.775792
Received: 14 September 2021; Accepted: 25 February 2022;
Published: 08 April 2022.
Edited by:
Bala Poduval, University of New Hampshire, United StatesReviewed by:
Elizaveta Antonova, Lomonosov Moscow State University, RussiaAnton Artemyev, Space Research Institute (RAS), Russia
Copyright © 2022 Song, Zuo, Shen, Feng, Xu, Wang, Jiang and Luo. This is an open-access article distributed under the terms of the Creative Commons Attribution License (CC BY). The use, distribution or reproduction in other forums is permitted, provided the original author(s) and the copyright owner(s) are credited and that the original publication in this journal is cited, in accordance with accepted academic practice. No use, distribution or reproduction is permitted which does not comply with these terms.
*Correspondence: Pingbing Zuo, cGJ6dW9AaGl0LmVkdS5jbg==
 Xiaojian Song
 Pingbing Zuo
 Zhenning Shen2
 Xueshang Feng
 Chaowei Jiang