
95% of researchers rate our articles as excellent or good
Learn more about the work of our research integrity team to safeguard the quality of each article we publish.
Find out more
ORIGINAL RESEARCH article
Front. Phys. , 27 May 2022
Sec. Medical Physics and Imaging
Volume 10 - 2022 | https://doi.org/10.3389/fphy.2022.758658
This article is part of the Research Topic In Vivo Opto-Physiological Imaging View all 5 articles
 Alessandro Arrigo*
 Alessia Amato
 Cecilia Mularoni
 Andrea Saladino
 Emanuela AragonaAdelaide PinaFrancesca CalcagnoFrancesco Bandello
 Maurizio Battaglia Parodi
Background: To investigate optical coherence tomography angiography (OCTA) quantitative parameters associated with macular neovascularization (MNV) size modifications in age-related macular degeneration.
Methods: Study design was prospective, with 1-year of follow-up. All the included MNV eyes were treated by anti-VEGF intravitreal injections. Quantitative OCTA parameters, including MNV vessel tortuosity (VT) and MNV reflectivity, were calculated. Post-hoc analyses assessed the correlation between quantitative OCTA metrics and MNV size modifications.
Results: A total of 28 MNV eyes of 28 patients were included. Baseline LogMAR BCVA was 0.36 ± 0.21 LogMAR, improved to 0.28 ± 0.22 Log-MAR after 1-year (p < 0.01), with a mean number of 8 ± 3 anti-VEGF injections. Eyes characterized by high MNV VT values group showed worse outcome and higher increases of MNV size. A mean MNV reflectivity value of 101 was associated with a high probability of changes in MNV size. MNV growth was also influenced by the type of MNV, with type 2 and mixed type lesions showing increases in MNV size, unlike type 1 MNV. These factors showed a cumulative effect in determining MNV size modifications. In most of the cases, we observed MNV size increases. Conversely, MNV lesions characterized by low MNV VT values may experience size reductions over the follow-up (34% of cases). The number of intravitreal injections had no significant influence on MNV size changes.
Conclusions: Quantitative OCTA allowed to discriminate highly perfused MNV lesions, providing a basis to predict MNV size modifications and the direction of MNV expansion.
Macular nevascularization (MNV) is a common complication occurring in age-related macular degeneration (AMD) [1]. The introduction of optical coherence tomography (OCT) angiography (OCTA) has enabled us to make considerable advances in the comprehension of the pathogenesis and categorization of MNV lesions [2–7]. More recently, novel approaches based on the quantitative assessment of MNV OCTA features have added fresh details regarding the relationship between the perfusion features of the lesions and clinical outcomes [4–6]. The quantitative evaluation of MNV morphology has also proved useful in assessing the factors associated with different responses to anti-VEGF treatments [7, 8]. There is, however, a lack of information regarding the factors influencing the expansion of the neovascular network. In a recent study, MNV reflectivity properties, detected by OCTA, resulted highly related with the capability of OCTA technology to reconstruct MNV network in its entirety, compared with fluorescein angiography and indocyanine green angiography [9]. In the present paper, we tested a similar quantitative approach to assess if MNV reflectivity might be predictive of MNV size turnover and direction of growth over 1 year of follow-up.
The study was designed as an interventional, prospective, cohort study, with a 1-year follow-up. All the patients were recruited at the Ophthalmology Unit of IRCCS San Raffaele Scientific Institute, Milan, Italy. Signed, informed consent was obtained from all patients. The study was approved by the Ethical Committee of IRCCS San Raffaele Scientific Institute in Milan and was conducted in accordance with the Declaration of Helsinki (MIRD2020). The inclusion criterion was the diagnosis of AMD, complicated by naïve sub-foveal MNV showing signs of activity on structural OCT and requiring anti-VEGF intravitreal injections. All the patients underwent Ranibizumab 0.5 mg intravitreal treatment, including a loading dose with 3 monthly injections, followed by further anti-VEGF administrations planned according to a treat and extend regimen.
The diagnosis of type 1, mixed or type 2 MNV was performed by means of structural OCT and by fluorescein angiography (FA) examinations (Spectralis HRA + OCT; Heidelberg Engineering, Heidelberg, Germany). We excluded all the other MNV lesions (i.e. polypoidal choroidal vasculopathy and retinal angiomatous proliferation) because they are not easily detectable on OCTA. Further exclusion criteria were: high media opacity, ophthalmologic surgery within the last 6 months, any other type of retinal or optic nerve diseases, and any systemic condition potentially affecting the analyses.
Ophthalmologic examination included LogMAR best corrected visual acuity (BCVA), measured using standard ETDRS charts, slit lamp biomicroscopy, and Goldmann applanation tonometry. The structural OCT acquisition protocol included raster, radial and dense scans, with a high number of frames (ART>25) and enhanced depth imaging (EDI). Central macular thickness (CMT) was automatically obtained from Heidelberg software. Outer retinal atrophy was evaluated through structural OCT and fundus auto-fluorescence (FAF) images. We considered the signs of outer retinal atrophy to be the presence of a demarcated region of definite hypoautofluorescence on FAF image, corresponding to a prominent signal attenuation of the outer retinal layers, with the disappearance of the photoreceptors/RPE complex and the presence of choroidal hypertransmission on structural OCT.
OCTA images were obtained using a swept source OCT DRI Topcon Triton (Topcon Corporation, Tokyo, Japan). OCTA scans included high-resolution 3 × 3 mm and 4.5 × 4.5 mm acquisitions. Only high-quality images (Topcon Imaging Quality factor>80) were included in the analyses. Two expert graders captured the OCTA images at least twice to assess both reproducibility and repeatability. From OCTA reconstructions, we extracted the automatic segmentations of the superficial capillary plexus (SCP), deep capillary plexus (DCP), choriocapillaris (CC), and MNV network. Each segmentation was carefully inspected by the same two expert graders and manually corrected to assess the vertical extension of the MNV.
All exported reconstructions were loaded in ImageJ software (https://imagej.net/Welcome). In-house scripts were used to calculate the vessel density (VD). VD was calculated after “mean threshold” image binarization, then by calculating the proportion of white pixels to black. The foveal avascular zone (FAZ) was manually segmented and excluded from VD calculation. For the MNV reconstruction, the two graders carefully selected only the neovascular network, removing all the background signal, including spurious particle motion signal and residual of retinal capillaries or CC. MNV images were not manually adjusted or altered to not interfere with the proper calculation of the quantitative metrics. As a preliminary pre-processing step, all the MNV reconstructions were set to the same grayscale range to address possible confounding factors related with the quality of the images and the intensity of the signal. Background was set to absolute black to avoid possible issues related with different contrast to noise ratio. On the other side, we verified the preservation of high intensity and low intensity MNV voxels, to verify our main hypothesis relating MNV reflectivity and MNV size changes.
Vessel tortuosity (VT), considered as an indirect measure of MNV blood perfusion, was measured for each MNV. In short, VT is defined as the ratio of the shortest pathway to the straight-line length, and provides information about vascular perfusion, with higher values corresponding to a higher blood flow [4–6].
MNV VT was calculated by two independent examiners after applying the “skeletonize” function to MNV reconstruction, enabling each vessel to be considered as a line. ImageJ scripts were then adopted to measure the Euclidean distance of each skeletonized line and the mean value was considered as the MNV VT parameter. Based on our previous investigations (4–6), we applied a MNV VT cutoff of 8.40 to obtain Group 1 (MNV VT < 8.40) and Group 2 (MNV VT > 8.40) MNV eyes at baseline.
ImageJ tools were also used to calculate MNV reflectivity, which was independently assessed by the same two examiners. MNV reflectivity can be regarded as an indicator of the blood flow in the MNV lumen [10]. We calculated the mean reflectivity value of the entire MNV reconstruction, applying a threshold to detect the reflectivity values that were lower than (mean reflectivity value/2) to selectively study the low perfusion regions of the MNV (Figure 1). These regions were matched with changes in MNV size detected over the follow-up. Specifically, we divided the MNV area into eight different sectors, as shown in Figure 2. We selected the sectors displaying low reflectivity values at baseline and com-pared them with those showing MNV changes (smaller or larger) at the end of the follow-up, treating these sectors as dichotomous variables (0 not involved—1 involved) and calculating the per-centage of agreement. We considered a sector to be affected if it showed a difference in size of at least 20% (whether smaller or larger) of the total MNV size in the sector. All the measurements were performed at baseline, after the loading dose of 3 anti-VEGF injections and at the end of the 1-year follow-up. The flowchart showing all the quantitative steps is shown in Figure 3.
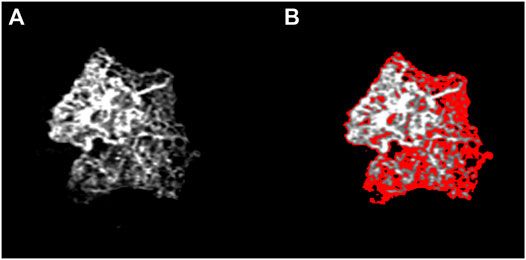
FIGURE 1. Identification of low MNV reflectivity signal. This sample image shows that the regions of low reflectivity are located at the edge of the MNV network (A), as high-lighted in red (B). The distribution of the low reflectivity signal significantly affects the changes in MNV size detectable over the follow-up.
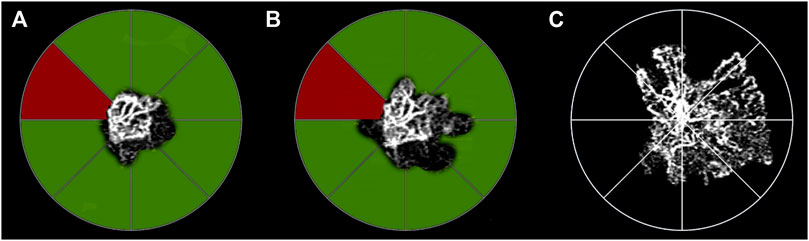
FIGURE 2. Sector analysis of low MNV reflectivity signal and changes in MNV size. The segmentation of the MNV is divided into eight sectors at baseline (A) (MNV size 0.56 mm2). Green sectors correspond to MNV subregions characterized by low MNV reflectivity signal at baseline, whereas red sectors show only a high reflectivity signal. In the sub-sequent follow-up examinations, green sectors correspond to changes in MNV size of at least 20% of the total MNV size in the sector. The influence of the increase in size on the neovascular network is already detectable after the loading dose of three-monthly injections (B) (MNV size 0.78 mm2). The persistence of low MNV reflectivity signal sectors can be identified at this time. These sectors are characterized by further increases in MNV size, detected at the end of the 1-year follow-up (C) MNV size 1.98 mm2).
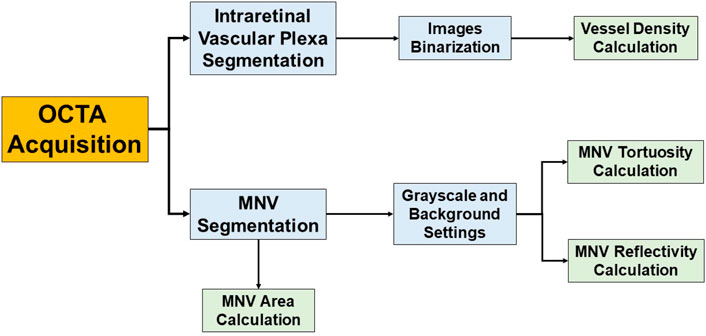
FIGURE 3. Flowchart showing all the quantitative steps adopted in the present study.
The intraclass correlation coefficient (ICC) was calculated for all the measurements performed to assess the agreement between the two examiners. Continuous variables, expressed as mean ± standard deviations, were analyzed through a two-tailed T test. The one-way Anova test, with Bonferroni correction for multiple comparisons (SPSS, Chicago, Illinois, United States), was used to compare the three types of MNV. The statistical significance was set at p < 0.05.
The ROC curve was used to identify an MNV reflectivity cutoff associated with alterations in MNV size, and Tau-Kendall correlation analysis (SPSS, Chicago, Illinois, United States) was used to assess the statistical relationships among the parameters considered. The main outcome measure was the assessment of quantitative factors associated with MNV size changes. The secondary goal was the evaluation of the factors influencing the direction of MNV expansion/reduction over the follow-up.
Our study involved 28 MNV eyes of 28 patients (15 males; mean age 73 ± 8 years). All the eyes reached the planned 1-year follow-up. Mean BCVA was 0.36 ± 0.21 LogMAR, improved to 0.28 ± 0.22 Log-MAR after 1 year (p < 0.01). Mean CMT was 425 ± 76 µm, improving to 315 ± 55 µm after 1 year (p < 0.01), with a mean number of 8 ± 3 injections. The MNVs fell into the following categories: 15 type 1 (54%), 9 mixed type (32%), 4 type 2 (14%). Clinical data are reported in Table 1. Overall, considering all the measurements, ICC was 0.98; reproducibility was 0.94; repeatability was 0.96. Fifteen eyes were categorized as MNV VT < 8.40, whereas thirteen eyes fell into the MNV VT > 8.40 category. Eyes belonging to the MNV VT > 8.40 group showed a worse outcome in terms of BCVA, OCTA parameters and outer retinal atrophy (46 vs. 20%; p < 0.01) (Table 2). VD values of SCP, DCP and CC showed no significant changes within each subgroup after 1 year of follow-up (all p > 0.05).
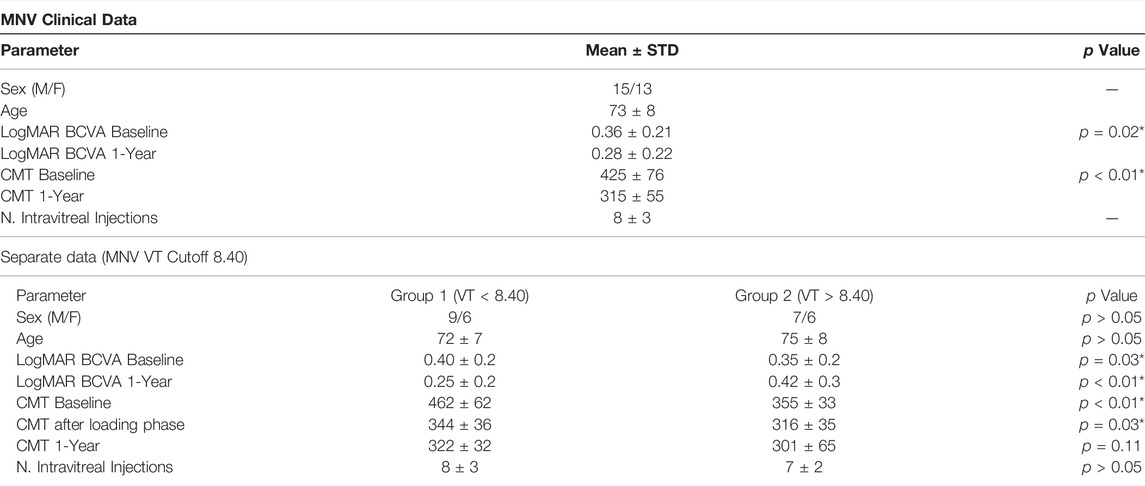
TABLE 1. MNV clinical data. The following abbreviations are used: best corrected visual acuity (BCVA), central macular thickness (CMT), vessel tortuosity (VT).
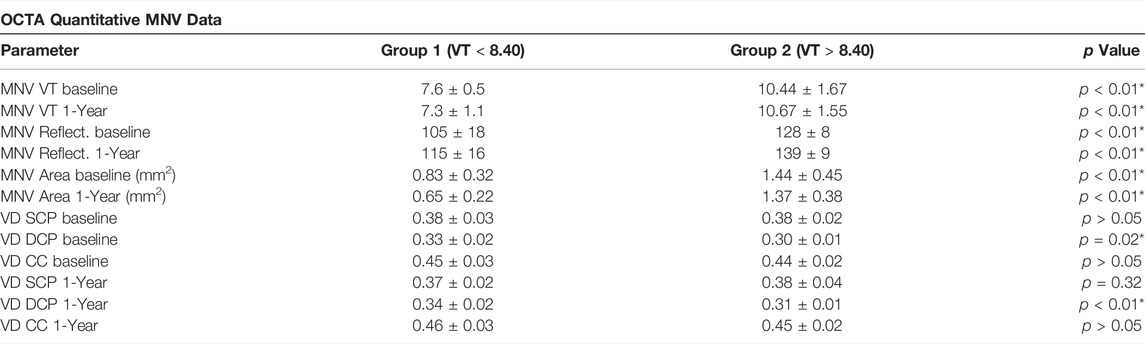
TABLE 2. OCTA quantitative MNV data. The following abbreviations are used: macular neovascularization (MNV), vessel density (VD), superficial capillary plexus (SCP), deep capillary plexus (DCP), choriocapillaris (CC).
Out of our cohort of eyes, 2/15 (13%) in the MNV VT < 8.40 group and 5/13 (38%) in the MNV VT > 8.40 group experienced an increase in MNV size over the 1-year follow-up (p < 0.01). A stable size was found in 8/15 eyes (53%) in the MNV VT < 8.40 group and in 8/13 eyes (62%) in the MNV VT > 8.40 group (p > 0.05). Conversely, 5/15 eyes (34%) in the MNV VT < 8.40 group and 0/13 eyes (0%) in the MNV VT > 8.40 group showed a decrease in size over the 1-year follow-up (p < 0.01).
Our ROC analysis showed that MNV reflectivity had a role in predicting MNV changes. In particular, a mean MNV reflectivity value of 101 was associated with a high probability of changes in MNV size (whether larger or smaller) (sensitivity 0.85; specificity 0.86; p < 0.01).
Comparing all the sectors, both at baseline and at the 12-months follow-up (a total of 8 sectors x 28 eyes x 2 examinations = 448 sectors), MNV growth was detected in 315 sectors (70.3%) and a contraction in 133 sectors (29.7%). On the other hand, the size of the portion of MNV displaying a reflectivity signal higher than the mean value/2 was found to be stable over the follow-up. In addition, modified MNV sectors corresponded more frequently to low MNV reflectivity values (reflectivity values < (mean value/2)) (Tau-Kendall coeff. 0.75; p < 0.001).
MNV growth proved to be directly related to MNV VT values. In particular, MNV with VT > 8.40 was associated with increases in MNV size over the follow-up, compared with MNV with VT < 8.40 (Tau-Kendall coeff. 0.65; p < 0.001). Furthermore, MNV growth was also influenced by the type of MNV, with type 2 and mixed type lesions being associated with increases in MNV size, unlike type 1 MNV (Tau-Kendall coeff. 0.59; p < 0.001).
The combination of identifying both type 2 and mixed type MNV together with MNV VT > 8.40 was significantly associated with MNV growth over the follow-up (Tau-Kendall coeff. 0.79; p < 0.001). We did not find statistically significant differences between type 2 and mixed type MNV (all p > 0.05).
Moreover, the MNV sectors showing low reflectivity values (< mean value/2), which are associated with MNV VT > 8.40, turned out to be prone to neovascular growth over the follow-up (Tau-Kendall coeff. 0.52; p < 0.001).
The presence of MNV type 2 (or mixed type) with MNV VT > 8.40 and with low MNV reflectivity was associated with an even greater probability of an increase in MNV size (Tau-Kendall coeff. 0.86; p < 0.001).
Two examples are shown in Figure 4.
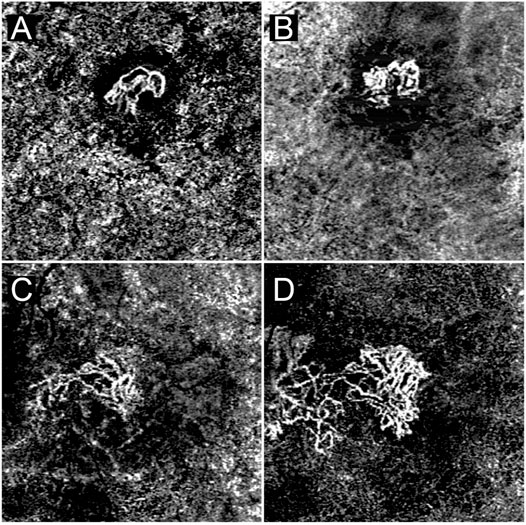
FIGURE 4. A case of MNV characterized by MNV VT < 8.40 and predominant high MNV reflectivity signal (A). This lesion experienced extremely minor changes in size over the follow-up (B). A case of MNV characterized by MNV VT > 8.40 and easily identifiable low MNV reflectivity signal regions (C). By the end of the follow-up the MNV has undergone a remarkable increase in size, closely matching the sectors displaying a low reflectivity signal (D).
The number of anti-VEGF injections showed no statistically significant effect on expansion features and reflectivity changes (all p > 0.05). Furthermore, the onset of outer retinal atrophy was weakly associated with more dynamic MNV lesions and was thus less detected in MNV characterized by stable sizes over the follow-up (Tau-Kendall coeff. 0.41; p < 0.001).
The present study aimed to identify the OCTA factors associated with changes in MNV size over a 1-year follow-up, showing the importance of MNV VT, MNV reflectivity and MNV subtypes. More specifically, as already discussed in previous studies [4, 5, 8]. MNV VT can be interpreted as indicating the amount of blood flow perfusion in the neovascular network. Higher MNV VT values are correlated with more aggressive lesions, independently of the FA type (either type 1 or type 2 MNV) [4, 5], and MNV size [8]. Our data indicate that higher perfusion, as expressed by higher MNV VT, is most significantly correlated to MNV growth. Furthermore, we found a cumulative effect due to the association of type 2 (or mixed type) MNV + MNV VT > 8.40 + low MNV reflectivity values with MNV growth. This may be explained bearing in mind the higher degree of freedom for MNV growth above the retinal pigment epithelium (RPE) compared with type 1 MNV, which was found to be in some way compressed between the RPE and the choroid. Changes in MNV size were also significantly associated with low MNV reflectivity values. Lower MNV reflectivity was identified in specific peripheral MNV sectors distinguished by their still immature neovascular structures.
Analyses of MNV reflectivity suggest that the presence of a low MNV reflectivity signal may be correlated with an unstable MNV structure in the process of undergoing further changes.
MNV reflectivity is likely influenced both by the amount of blood flow and by its speed, providing indirect information regarding the overall MNV blood flow. When low MNV reflectivity is associated with higher MNV VT (MNV VT > 8.40), MNV is seen to have expanded in the sectors involved.
In our investigation, the number of intravitreal injections was not found to be significantly associated with significant modifications of the quantitative OCTA parameters.
Anti-VEGF administration was found to decrease the MNV perfusion [11], with maximum effect after 1 week and fading gradually thereafter. The overall number of anti-VEGF injections in the present study might have been too low to observe a significant effect on global MNV perfusion and thus on the MNV size. A fixed regimen scheduling more injections might prove more appropriate in a subset of patients hosting a more aggressive MNV, characterized by higher VT. However, several mediators and cytokines other than VEGF can influence MNV growth and evolution [1]. Administering anti-VEGF alone might thus not be enough to control the MNV-related out-comes.
Looking at macular SCP, DCP and CC, we detected no significant changes in both MNV VT subgroups after 1 year of follow-up, probably related with the relatively short time interval. We have recently reported how the quantitative assessment of CC changes may be somehow predictive of MNV onset [12]. On this basis, we might hypothesized a prognostic role of retinal vasculature changes also after the onset of MNV. However, since our data are limited just to 1-year of observation, further studies with longer follow-up are warranted to investigate in detail this issue.
In view of this, further studies are warranted to assess the relationship between MNV quantitative imaging-based biomarkers and biochemical parameters.
We are aware that our study labors under several limitations, first of all related to the relatively small number of eyes and the follow-up restricted to 1 year. We based our analyses on a previously determined MNV VT cut-off value [4, 5, 8], but we cannot rule out the possibility that other values may provide better MNV categorization and an even more precise clinical impact. Moreover, OC-TA techniques are well known to be artifact-prone [13]. Another important drawback is the lack of a histopathological correlation able to confirm our findings and the advanced pathogenic hypotheses.
In conclusion, our study highlights quantitative OCTA parameters associated with the evaluation of changes in MNV size and the direction where these changes occur over the follow-up, and with the onset of outer retinal atrophy. Although this study should be considered just a first investigation regarding the role of MNV reflectivity assessment in clinical practice, the present results might pave the stone for novel quantitative ways to perform the diagnostic work-up of MNV patients, also providing new metrics which might be useful for future artificial intelligence-based analyses. In addition, the perspective of a reliable prediction of MNV evolution and of complications onset might be useful for developing personalized therapeutic strategies, to optimize treatments outcome. Further prospective studies are needed to confirm our significant findings.
The raw data supporting the conclusions of this article will be made available by the authors, without undue reservation.
The studies involving human participants were reviewed and approved by Ethical Committee of IRCCS San Raffaele Scientific Institute (Milan, Italy). The patients/participants provided their written informed consent to participate in this study.
AAr and AAm: study design, data acquisition, data analysis, data interpre-tation, manuscript draft. CM, AS, EA, AP, FC: data analysis, data acquisition. FB and MP: data interpretation, manuscript revision, study supervision.
The authors declare that the research was conducted in the absence of any commercial or financial relationships that could be construed as a potential conflict of interest.
All claims expressed in this article are solely those of the authors and do not necessarily represent those of their affiliated organizations, or those of the publisher, the editors and the reviewers. Any product that may be evaluated in this article, or claim that may be made by its manufacturer, is not guaranteed or endorsed by the publisher.
1. Wong T, Chakravarthy U, Klein R, Mitchell P, Zlateva G, Buggage R, et al. The Natural History and Prognosis of Neovascular Age-Related Macular Degeneration. Ophthalmology (2008) 115(1):116–26. doi:10.1016/j.ophtha.2007.03.008
2. Farecki M-L, Gutfleisch M, Faatz H, Rothaus K, Heimes B, Spital G, et al. Characteristics of Type 1 and 2 CNV in Exudative AMD in OCT-Angiography. Graefes Arch Clin Exp Ophthalmol (2017) 255(5):913–21. doi:10.1007/s00417-017-3588-y
3. Arrigo A, Aragona E, Capone L, Pierro L, Romano F, Bandello F, et al. Advanced Optical Coherence Tomography Angiography Analysis of Age-Related Macular Degeneration Complicated by Onset of Unilateral Choroidal Neovascularization. Am J Ophthalmol (2018) 195:233–42. doi:10.1016/j.ajo.2018.08.001
4. Arrigo A, Romano F, Aragona E, Di Nunzio C, Battista M, Bandello F, et al. Optical Coherence Tomography Angiography Can Categorize Different Subgroups of Choroidal Neovascularization Secondary to Age-Related Macular Degeneration. Retina (2020) 40(12):2263–9. doi:10.1097/iae.0000000000002775
5. Arrigo A, Aragona E, Di Nunzio C, Bandello F, Parodi MB. Quantitative Optical Coherence Tomography Angiography Parameters in Type 1 Macular Neovascularization Secondary to Age-Related Macular Degeneration. Trans Vis Sci Tech (2020) 9(9):48. doi:10.1167/tvst.9.9.48
6. Arrigo A, Bordato A, Aragona E, Amato A, Viganò C, Bandello F, et al. Macular Neovascularization in AMD, CSC and Best Vitelliform Macular Dystrophy: Quantitative OCTA Detects Distinct Clinical Entities. Eye (Lond) (2021) 35:3266-3276. [Epub ahead of print]. doi:10.1038/s41433-021-01396-2
7. Uchida A, Hu M, Babiuch A, Srivastava SK, Singh RP, Kaiser PK, et al. Optical Coherence Tomography Angiography Characteristics of Choroidal Neovascularization Requiring Varied Dosing Frequencies in Treat-And-Extend Management: An Analysis of the AVATAR Study. PLoS One (2019) 14(6):e0218889. doi:10.1371/journal.pone.0218889
8. Arrigo A, Aragona E, Bordato A, Amato A, Borghesan F, Bandello F, et al. Quantitative OCTA Parameter Variations after Treatment of Macular Neovascularization Secondary to Age-Related Macular Degeneration. Retina (2020) 41(7):1463–9. doi:10.1097/iae.0000000000003065
9. Arrigo A, Aragona E, Bordato A, Amato A, Saladino A, Bandello F, et al. High Reflectivity and Low Reflectivity Properties on OCTA Influence the Detection of Macular Neovascularization in AMD. Front Phys (2021) 9:353. doi:10.3389/fphy.2021.694035
10. Nelis P, Kleffner I, Burg MC, Clemens CR, Alnawaiseh M, Motte J, et al. OCT-angiography Reveals Reduced Vessel Density in the Deep Retinal Plexus of CADASIL Patients. Sci Rep (2018) 8(1):8148. doi:10.1038/s41598-018-26475-5
11. Calzetti G, Mora P, Favilla S, Ottonelli G, Devincenzi G, Carta A, et al. Assessment of Choroidal Neovascularization Perfusion: A Pilot Study with Laser Speckle Flowgraphy. Trans Vis Sci Tech (2020) 9(5):9. doi:10.1167/tvst.9.5.9
12. Arrigo A, Amato A, Barresi C, Emanuela Aragona E, Saladino A, Pina A, et al. Choroidal Modifications Preceding the Onset of Macular Neovascularization in Age-Related Macular Degeneration. Ophthalmol Ther (2021) 11:377-386. [Epub ahead of print]. doi:10.1007/s40123-021-00443-1
Keywords: macular neovascularization, age-related macula degeneration, OCTA, MNV growth, reflectivity
Citation: Arrigo A, Amato A, Mularoni C, Saladino A, Aragona E, Pina A, Calcagno F, Bandello F and Battaglia Parodi M (2022) Optical Coherence Tomography Angiography Parameters Correlated to the Growth of Macular Neovascularization in Age-Related Macular Degeneration. Front. Phys. 10:758658. doi: 10.3389/fphy.2022.758658
Received: 14 August 2021; Accepted: 17 May 2022;
Published: 27 May 2022.
Edited by:
Sijung Hu, Loughborough University, United KingdomReviewed by:
Feng Gao, Tianjin University, ChinaCopyright © 2022 Arrigo, Amato, Mularoni, Saladino, Aragona, Pina, Calcagno, Bandello and Battaglia Parodi. This is an open-access article distributed under the terms of the Creative Commons Attribution License (CC BY). The use, distribution or reproduction in other forums is permitted, provided the original author(s) and the copyright owner(s) are credited and that the original publication in this journal is cited, in accordance with accepted academic practice. No use, distribution or reproduction is permitted which does not comply with these terms.
*Correspondence: Alessandro Arrigo, YWxlc3NhbmRyby5hcnJpZ29AaG90bWFpbC5jb20=
Disclaimer: All claims expressed in this article are solely those of the authors and do not necessarily represent those of their affiliated organizations, or those of the publisher, the editors and the reviewers. Any product that may be evaluated in this article or claim that may be made by its manufacturer is not guaranteed or endorsed by the publisher.
Research integrity at Frontiers
Learn more about the work of our research integrity team to safeguard the quality of each article we publish.