
94% of researchers rate our articles as excellent or good
Learn more about the work of our research integrity team to safeguard the quality of each article we publish.
Find out more
BRIEF RESEARCH REPORT article
Front. Phys., 04 February 2022
Sec. Interdisciplinary Physics
Volume 10 - 2022 | https://doi.org/10.3389/fphy.2022.713087
This article is part of the Research TopicImpacts of Global Warming on Ecology and Meteorology and the Related Physical Mechanisms, Evaluation and PredictionView all 18 articles
 Yuheng Zhao1
 Jianbo Cheng2,3*
 Guolin Feng2,4*
 Zhihai Zheng1
 Rong Zhi1Zengping Zhang2Jinlong Yan3
 Dongdong Zuo5
Anomalous subsidence over the western part of the western Pacific subtropical high (WPSH) caused record-breaking precipitation anomalies over the Yangtze-Huaihe River catchment in early summer 2020 (June–July 2020). The meridional circulation (MC) made a positive contribution to this anomalous subsidence, while the zonal circulation (ZC) made a negative contribution. The quantitative contributions of the MC and ZC to this anomalous subsidence were approximately 110% and –10% in June, 130% and –30% in July, and 120% and –20% for the mean of June and July, respectively, suggesting that the MC played a dominant role in the anomalous subsidence of the western part of the WPSH. The anomalous MC, with a rising branch located at the Maritime Continent and a descending branch located over South China, was forced by the warming of the northern tropical Indian Ocean and the rapidly developed La Niña event, which further resulted in the intensification and southwestward expansion of the WPSH and thus in heavy rainfall over the Yangtze River region.
The Meiyu in China or the Baiu in Japan and Changma in Korea is the major rainy season over the East Asian with duration from early-June to mid-July, which can have vital importance on the economic development and human society of East Asian regions [1–7]. The Meiyu rain season in 2020 started early (began on June 1, 7 days earlier than usual) and ended late (ended on August 2, 15 days later than usual), lasting for 62 days, which was the longest since 1961 (Figure 1A) [1–7]. The amount of precipitation averaged over the Yangtze and Huaihe Rivers during this season reached 759.2 mm, recording a precipitation anomaly that was higher than the precipitation anomaly in the second year of a strong El Niño, ranking the highest amount since 1961. In early summer 2020 (June–July), the mid–lower reaches of the Yangtze River catchment experienced more than 10 heavy rainfall events, leading to direct economic losses of approximately 116 billion Chinese yuan [3].
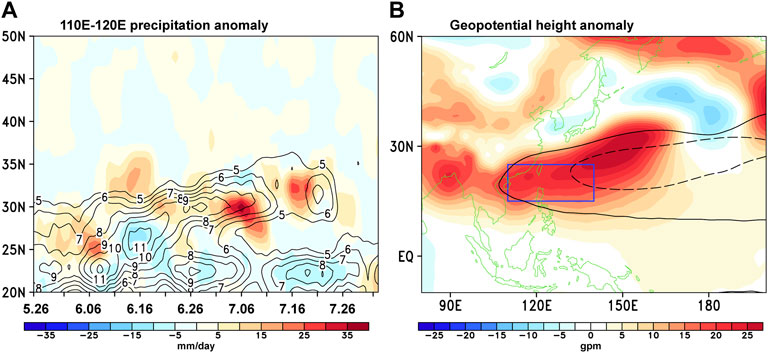
FIGURE 1. (A) Time-latitude cross-section of the climatological precipitation (1981–2010, contour interval: 1 mm day−1) and precipitation anomaly in 2020 (shading, mm day−1) averaged over 110°E–120°E from 26 May to 2 August. (B) Horizontal distribution of the geopotential height anomaly at 850 hPa in early summer 2020 (1 June–31 July 2020, shading, gpm). Dashed and solid black lines in (B) represent the 5,880 gpm contour of the 500 hPa geopotential height in climatology and 2020, respectively. The blue box in (B) (110°E–140°E, 15°N–25°N) indicates the region of the western part of the western Pacific subtropical high (WPSH). Anomalies were computed based on the climatology of 1981–2010.
To investigate the underlying causes of the Meiyu in summer 2020, many efforts have been made. Takaya et al. [2] and Zhou et al. [7] proposed that the extraordinary rainfall was originated from the tropical Indian Ocean warming, and this warming was possibly resulted from the enhanced western Pacific subtropical high (WPSH) [5]. Zheng and Wang [6] suggested that all three oceans of the Pacific, Indian, and Atlantic Oceans contributed to the Meiyu, and the Atlantic Ocean made the dominate contribution. Liu et al. [1] and Qiao et al. [5] investigated the causes of the Meiyu from the subseasonal time scale. Liu et al. [1] divided the duration of Meiyu into two periods and claimed that the sequential warm and cold Meiyu front regulated by the North Atlantic Oscillation was responsible for this unexpected extreme Meiyu event. Qiao et al. [5] divided the duration of Meiyu into three stages: advanced-onset, strong-persisting, and delayed-withdrawal, and suggested different causes in different periods. Although these studies suggested different causes of the extraordinary Meiyu in summer 2020, they consistently emphasized the role of the anomalous WPSH.
Climatologically, the WPSH can transport the water vapor from the western Pacific toward mainland China by the low-level southwesterly jet along the edge of the WPSH, which can influence the rainfall over the Yangtze River catchment [8–15]. The above-normal (subnormal) precipitation over the Yangtze River catchment in early summer is commonly accompanied by an intensification and westward shift (a weakening and eastward shift) of the WPSH [11–15]. Thus, the location, intensity, and variability of the WPSH are vitally important to the precipitation anomaly over the Yangtze River catchment in early summer [8–10]. In June and July of 2020, the area of exceptionally strong WPSH showed a strong anomalous subsidence, especially in the western part of the WPSH (Figures 2A,D,G), which caused record-breaking precipitation anomalies over the Yangtze River catchment in early summer 2020. Therefore, it is necessary to investigate the source of the anomalous subsidence in the western part of the WPSH.
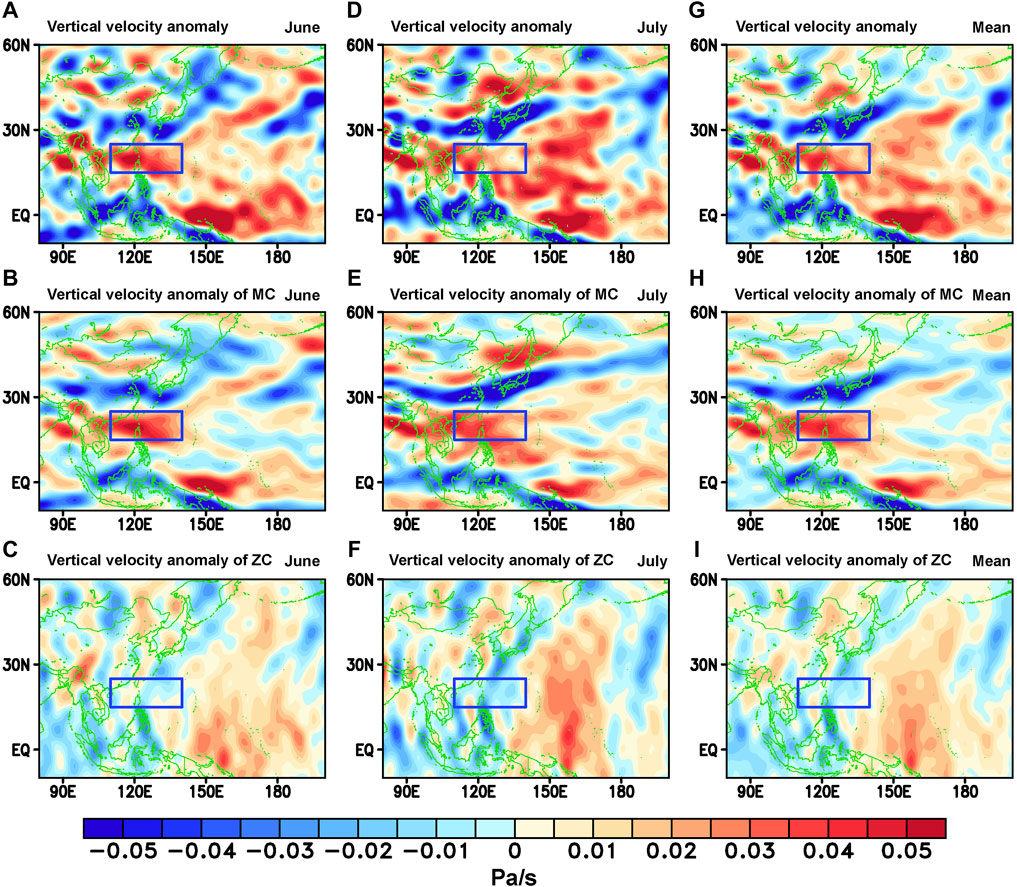
FIGURE 2. (A) Horizontal distribution of the vertical velocity anomaly at 500 hPa in June 2020 derived from the ensemble means of five reanalysis data sets (shading, Pa s−1). (B) and (C) Same as (A) but for the vertical velocity anomalies of meridional circulation (MC) and zonal circulation (ZC), respectively. (D–F) and (G–I) Same as (A–C) but for the results in July and the mean of June and July, respectively. The blue box in each plot indicates the region of the western part of the WPSH. Anomalies were computed based on the climatology of 1981–2010. The decomposition of the vertical velocity anomaly was based on the three-pattern decomposition of the global atmospheric circulation (3P-DGAC) method.
Recently, to achieve a uniform description of the general circulation of the atmosphere from a global perspective and to reveal the mechanism of the complicated interactions and connections of the circulations between the low latitudes and mid–high latitudes, a novel three-pattern decomposition of global atmospheric circulation (3P-DGAC) method was proposed [16–21]. Hu et al. [17] suggested that tropical overturning circulations consist of a couple of orthogonal overturning circulations, i.e., meridional circulation (MC) and zonal circulation (ZC). Climatologically, the MC averaged over 135°E–160°E is characterized as the anticlockwise circulation in both hemispheres, while the ZC averaged over 15°N–25°N is characterized as the anticlockwise circulation in Indian Ocean and the clockwise circulation in the Pacific and Atlantic Ocean (Supplementary Figure S1). The sinking motion of the MC between 15°N and 25°N makes positive contribution to the WPSH, while the rising motion of the ZC between 135°E–160°E makes the negative contribution (Supplementary Figure S1). Since the tropical overturning circulation can be decomposed into the MC and ZC, the vertical wind contains two components, i.e., the vertical winds of the MC and ZC (Supplementary Figure S2). Supplementary Figure S2 shows that when analyzing the MC (ZC), the vertical velocity of the MC (ZC) should be used, and the vertical velocity of the ZC (MC) is regarded as the deviation if the total vertical velocity is used. Thus, there may be a bias in studying the MC and ZC in some previous studies because the total vertical velocity has commonly been used. Additionally, the anomalous subsidence in the western part of the WPSH in early summer 2020 could be decomposed into two parts that corresponded to anomalous MC and anomalous ZC (Figure 2), and thus the quantitative contribution of the MC and ZC to the anomalous WPSH can be clarified, which is not investigated in previous studies. Therefore, we would like to address the question: what were the effects of the MC and the ZC on the anomalous subsidence of the western part of the WPSH in early summer 2020? This issue was investigated by using the 3P-DGAC method in this study.
In this study, we employed monthly horizontal winds and vertical velocity data from five reanalysis datasets as follows: the Climate Forecast System Reanalysis Version 1 and Version 2 (hereafter CSFR) [22, 23], the fifth generation of European Centre for Medium-Range Weather Forecast (ECMWF) atmospheric reanalysis of the global climate (hereafter ERA5) [24], the Japanese Meteorological Agency 55-years reanalysis (hereafter JRA-55) [25], the National Centers for Environmental Prediction (NCEP)/National Center for Atmospheric Research (NCAR) reanalysis (hereafter NCEP1) [26], and the NCEP/Department of Energy (DOE) reanalysis (hereafter NCEP2) [27]. The daily precipitation data were obtained from the Climate Prediction Center (CPC) Global Daily Unified Gauge-Based Analysis of Precipitation [28], and the monthly precipitation data were obtained from the Global Precipitation Climatology Project monthly precipitation dataset [29]. The monthly geopotential height data were obtained from ERA5 reanalysis datasets. The monthly sea surface temperature (SST) data were taken from the Extended Reconstructed SST version 5 (ERSST5) dataset [30]. For consistency, all datasets used in this study were interpolated to a
A simple introduction of the 3P-DGAC method is offered in this section. To solve the unit discrepancy in calculating the three-dimensional (3D) vorticity vector in the pressure coordinates, the spherical
where
which satisfies the following continuity equation:
Based on the features of the Rossby wave in the middle–high latitudes and the Hadley and Walker circulations in the low latitudes, Hu et al. [17] defined the 3D horizontal circulation
and the following continuity equations were satisfied:
Eq. 5 is the sufficient condition that the components of
Because three-pattern circulations (horizontal circulation, MC, and ZC) exist in both the low and the middle–high latitudes, the global atmospheric circulation can be expressed as the superposition of the horizontal circulation, MC, and ZC, as follows:
with the following components:
The following restriction condition is needed to pick up the correct decomposition:
Eq. 9 guarantees the uniqueness of the stream functions
By combining Eqs. 8, 9, the following equations were obtained:
where
Since the MC and ZC can be effectively separated from the tropical atmospheric circulation by using the 3P-DGAC method (Eq. 8, Supplementary Figure S2), the 3P-DGAC method is potentially useful for analyzing the relative contributions of the MC and the ZC to the anomalous sinking motion of the western part of the WPSH. Therefore, in this study, the 3P-DGAC method was used to investigate the effects of the MC and the ZC on the anomalous subsidence of the western part of the WPSH.
In addition to the 3P-DGAC method, by using the traditional two-dimensional (2D) decomposition method of the vortex and divergent circulations [31, 32], the vertical velocity could also be decomposed into two parts, i.e., the vertical velocity of the regional Hadley circulation (RHC) and regional Walker circulation (RWC) (Supplementary Figure S3, Supplementary Figure S4). Thus, the traditional 2D method was also adopted in this study. However, the results derived from the traditional 2D method were displayed in the Supplementary Materials. More information of the traditional 2D method and 3P-DGAC method can be found in [17–19].
Figure 2 displays the horizontal distribution of the vertical velocity anomaly at 500 hPa in early summer 2020. The anomalous subsidence of the western part of the WPSH can be decomposed into two parts that correspond to the anomalous MC and ZC by using the 3P-DGAC method, and the vertical velocity anomaly of MC was positive, while the vertical velocity anomaly of ZC was negative in the region of the western part of the WPSH from June to July, implying that the MC (ZC) made a positive (negative) contribution to the anomalous subsidence of the western part of the WPSH (Figure 2). Additionally, by comparing the first and second rows of Figure 2 (i.e., comparing Figures 2A,D,G and Figures 2B,E,H), it was found that the original vertical velocity anomaly and the vertical velocity anomaly of MC were quite similar, suggesting that the MC played a dominating role in the anomalous subsidence of the western part of the WPSH. Although Figure 2 displays the qualitative contributions of the MC and the ZC to the anomalous subsidence, further quantitative analysis is needed.
Figure 3 displays the quantitative contributions of the MC and the ZC to the anomalous subsidence of the western part of the WPSH at 500 hPa in early summer 2020 based on the 3P-DGAC method derived from five reanalysis datasets. The quantitative contributions of the MC and the ZC to the anomalous subsidence of the western part of the WPSH were approximately 110% and –10% in June, 130% and –30% in July, and 120% and –20% for the mean of June and July, respectively (Figure 3). Specifically, the quantitative contributions of the MC (ZC) were 110, 109, 108, 114, and 114% (–10%, –9%, –8%, –14%, and –14%) in June for the CFSR, ERA5, JRA-55, NCEP1, and NCEP2 reanalysis datasets, respectively. In July, the quantitative contributions of the MC (ZC) were 131, 136, 121, 133, and 146% (–31%, –36%, –21%, –33%, and –46%) for the five reanalysis datasets. For the mean of June and July, the quantitative contributions of the MC (ZC) were 119, 121, 114, 123, and 129% (–19%, –21%, –14%, –23%, and –29%) for the five reanalysis datasets. Although discrepancies existed in the quantitative contributions of the MC and the ZC to the anomalous subsidence based on the five different reanalysis datasets, the main results obtained from all five reanalysis datasets indicated that the MC played a dominant role in the anomalous subsidence of the western part of WPSH in early summer 2020. Additionally, although the quantitative contributions of the RHC and the RWC to the anomalous subsidence of the western part of the WPSH based on the traditional 2D decomposition method were different from those based on the 3P-DGAC method, the results derived from the two methods both supported the conclusion that meridional circulation played a dominant role in the anomalous subsidence of the western part of the WPSH in early summer 2020 (Figure 3, Supplementary Figure S5).
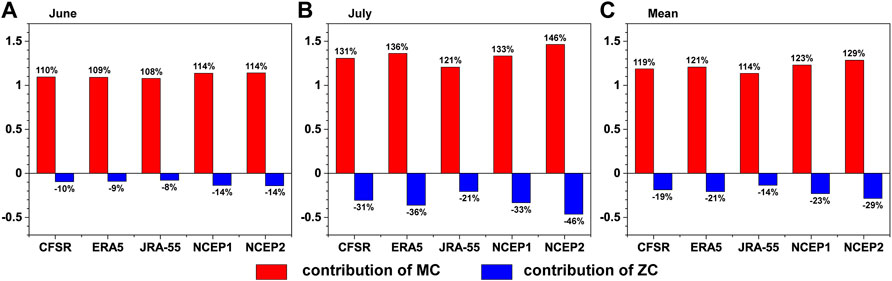
FIGURE 3. Contributions of the MC (red bars) and ZC (blue bars) to the anomalous vertical velocity of the western part of the WPSH at 500 hPa in (A) June, (B) July, and (C) the mean of June and July 2020 based on the 3P-DGAC method derived from the CFSR, ERA5, JRA-55, NCEP1, and NCEP2 reanalysis data sets. The quantitative contributions are shown at the top of each bar.
Since the MC played a dominating role in the anomalous subsidence of the western part of the WPSH in early summer 2020, we then wondered how the MC caused this anomalous subsidence. Figures 4A–D display the correlation between the regionally averaged vertical velocity anomaly of the MC over the region of the western part of the WPSH in June–July and the SST anomaly (SSTA) from December–January to June–July based on the seasonal means for the period 1979–2020. The correlation maps show that the correlated SSTA in the tropics is characterized by the persistent warming of the northern tropical Indian Ocean and the La Niña developing phase (Figures 4A–D), which was also observed from the actual SSTA (Supplementary Figures S6A–D). The warming of the northern tropical Indian Ocean is strengthened from December–January to June–July, and the northern tropical Indian Ocean warming can heat the troposphere and force the equatorial Kelvin wave to propagate eastward [33, 34], which triggers a positive Pacific–Japan (PJ) pattern (Figure 4E) and strengthens the northwest Pacific anomalous anticyclone (vectors in Figure 4D). Additionally, an enhanced zonal SST gradient is caused by the rapidly developed La Niña event, forcing anomalous easterly winds in the equatorial western Pacific (vectors in Figure 4D), which generates anomalous convection and precipitation anomalies over the Maritime Continent (Figures 4F, Supplementary Figure S6F) [5]. These two processes can lead to anomalous MC with a rising branch located on the Maritime Continent and a descending branch located over South China (Figures 2B,E,H), which can enhance the subsidence of the western part of the WPSH and lead to the southwestward expansion of the WPSH (Figure 4E, Supplementary Figure S6E) [33, 34].
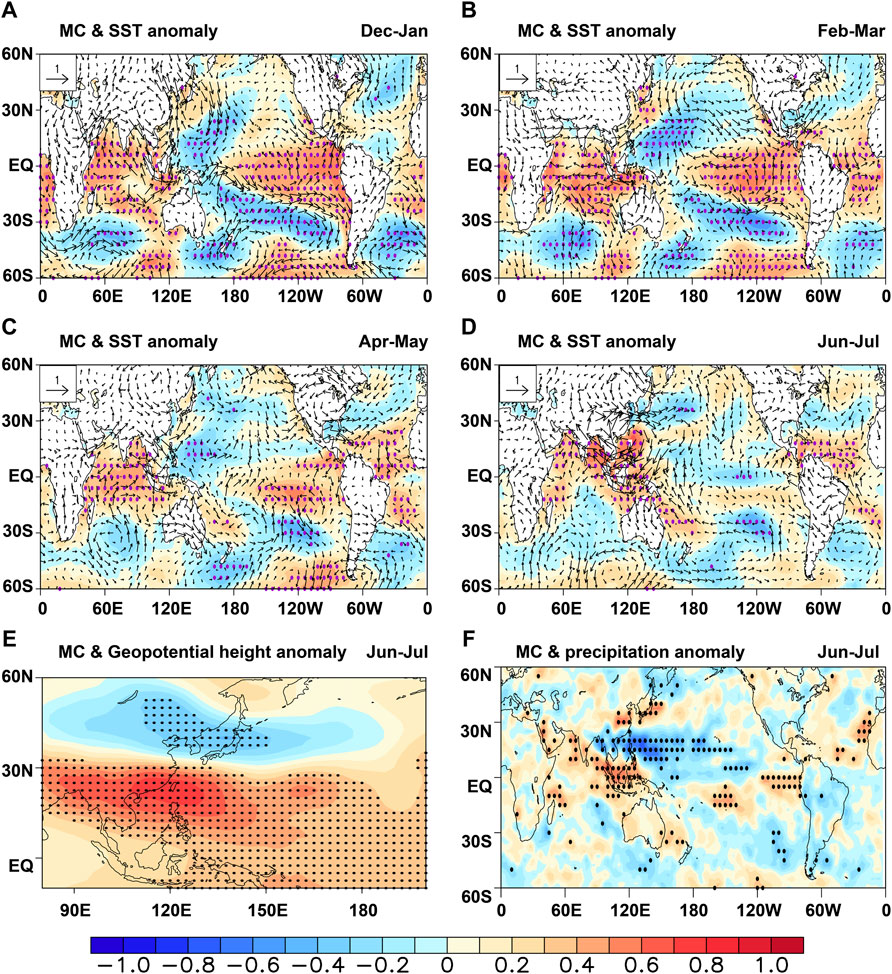
FIGURE 4. Correlation between the regionally averaged vertical velocity anomaly of the MC over the region of the western part of the WPSH (110°E–140°E, 15°N–25°N) in June–July derived from the ensemble means of five reanalysis data sets and the sea surface temperature (SST) anomaly (shading) and horizontal wind anomaly (vector) in (A) December–January, (B) February–March, (C) April–May, and (D) June–July from 1979 to 2020 based on the seasonal means. (E) Same as (D) but for the correlation between the regionally averaged vertical velocity anomaly of the MC and the geopotential height anomaly at 500 hPa in June–July. (F) Same as (D) but for the correlation between the regionally averaged vertical velocity anomaly of the MC and the precipitation anomaly in June–July. Stippling over the shading indicates that these correlation coefficients are significant above the 95% confidence level based on Student’s t-test.
The results in this study show that the anomalous subsidence over the western part of the WPSH is vitally important because the WPSH was stronger and inclined more toward the west, which caused record-breaking precipitation anomalies over the Yangtze River catchment in early summer 2020. The MC made a positive contribution to the anomalous subsidence of the western part of the WPSH, while the ZC made a negative contribution. This finding is also obtained by previous studies [1–7]. However, in this study, the quantitative contribution of the MC and ZC to the anomalous WPSH is obtained by using the 3P-DGAC method, which is not investigated in previous studies. The quantitative contributions of the MC and the ZC to the anomalous subsidence of the western part of the WPSH were approximately 110% and –10% in June, 130% and –30% in July, and 120% and –20% for the mean of June and July, respectively, suggesting that the MC played a dominant role in the anomalous subsidence of the western part of the WPSH. It should be noted that these results are obtained from the seasonal time scale and results may not the same in different periods from the subseasonal time scale, as Liu et al. [1] and Qiao et al. [5] suggested that the causes of the extraordinary Meiyu rain vary in different periods. Thus, the relative contribution of the MC and ZC to the extraordinary Meiyu rain from the subseasonal time scale should be investigated in the future. Chen et al. [35] proposed that the regional MC over the 110°E–160°E has intensified from 1979 to 2010, and the intensification of the regional MC is maintained under global warming [36]. Whether the rainfall over the Yangtze River catchment has intensified accompanied by the enhancement of the MC under global warming should also be explored.
The warming of the northern tropical Indian Ocean and the rapidly developed La Niña event forced anomalous MC with a rising branch located on the Maritime Continent and a descending branch located over South China, which further resulted in the intensification and southwestward expansion of the WPSH and anomalous precipitation over the Yangtze and Huaihe River catchment. The relative role of the warming of the northern tropical Indian Ocean and the rapidly developed La Niña events in forcing anomalous MC is not clear and should be investigated in the future.
According to Hu et al. [19], the dynamical equations of the three-pattern circulations have been established by combining the primitive equations and the 3P-DGAC method. The novel dynamical equations can be used to diagnose and predict the changes of the horizontal, meridional, and zonal circulations. Thus, the novel dynamical equations are potentially useful for prediction of the anomalous WPSH since the anomalous WPSH is closely related to the anomalous MC.
The original contributions presented in the study are included in the article/Supplementary Material, further inquiries can be directed to the corresponding authors.
YZ and JC: methodology. YZ and JC: writing original draft preparation. GF, ZZ(4th author), RZ, JY and DZ: writing review and editing. YZ and JC: visualization. All authors contributed to the article and approved the submitted version.
This work was funded by National Natural Science Foundation of China (Grant Nos 42130610, 42005012, 41975088), National Key Research and Development Program of China (Grant No. 2017YFC1502303), Natural Science Foundation of Jiangsu Province (Grant No. BK20201058), and School-level research projects of Yancheng Institute of Technology (Grant No. xjr2020022).
The authors declare that the research was conducted in the absence of any commercial or financial relationships that could be construed as a potential conflict of interest.
All claims expressed in this article are solely those of the authors and do not necessarily represent those of their affiliated organizations, or those of the publisher, the editors, and the reviewers. Any product that may be evaluated in this article, or claim that may be made by its manufacturer, is not guaranteed or endorsed by the publisher.
The Supplementary Material for this article can be found online at: https://www.frontiersin.org/articles/10.3389/fphy.2022.713087/full#supplementary-material
1. Liu B, Yan Y, Zhu C, Ma S, Li J. Record‐Breaking Meiyu Rainfall Around the Yangtze River in 2020 Regulated by the Subseasonal Phase Transition of the North Atlantic Oscillation. Geophys Res Lett (2020) 47(22):e2020GL090342. doi:10.1029/2020GL090342
2. Takaya Y, Ishikawa I, Kobayashi C, Endo H, Ose T. Enhanced Meiyu‐Baiu Rainfall in Early Summer 2020: Aftermath of the 2019 Super IOD Event. Geophys Res Lett (2020) 47(22):e2020GL090671. doi:10.1029/2020GL090671
3. Wei K, Ouyang C, Duan H, Li Y, Chen M, Ma J, et al. Reflections on the Catastrophic 2020 Yangtze River Basin Flooding in Southern China. The Innovation (2020) 1(2):100038. doi:10.1016/j.xinn.2020.100038
4. Ding Y, Liu Y, Hu Z-Z. The Record-Breaking Mei-Yu in 2020 and Associated Atmospheric Circulation and Tropical SST Anomalies. Adv Atmos Sci (2021) 38:1980–93. doi:10.1007/s00376-021-0361-2
5. Qiao S, Chen D, Wang B, Cheung HN, Liu F, Cheng J, et al. The Longest 2020 Meiyu Season over the Past 60 years: Subseasonal Perspective and its Predictions. Geophys Res Lett (2021) 48(9):e2021GL093596. doi:10.1029/2021GL093596
6. Zheng J, Wang C. Influences of Three Oceans on Record-Breaking Rainfall over the Yangtze River Valley in June 2020. Sci China Earth Sci (2021) 64:1607–18. doi:10.1007/s11430-020-9758-9
7. Zhou Z-Q, Xie S-P, Zhang R. Historic Yangtze Flooding of 2020 Tied to Extreme Indian Ocean Conditions. Proc Natl Acad Sci USA (2021) 118(12):e2022255118. doi:10.1073/pnas.2022255118
8. Wang B, LinHo. Rainy Season of the Asian-Pacific Summer Monsoon. J Clim (2002) 15(4):386–98. doi:10.1175/1520-0442(2002)015<0386:rsotap>2.0.co;2
9. Ding Y, Chan JCL. The East Asian Summer Monsoon: An Overview. Meteorol Atmos Phys (2005) 89(1):117–42. doi:10.1007/s00703-005-0125-z
10. Ye H, Lu R. Subseasonal Variation in ENSO-Related East Asian Rainfall Anomalies during Summer and its Role in Weakening the Relationship between the ENSO and Summer Rainfall in Eastern China since the Late 1970s. J Clim (2011) 24(9):2271–84. doi:10.1175/2010JCLI3747.1
11. Huang R, Wu Y. The Influence of ENSO on the Summer Climate Change in China and its Mechanismfluence of ENSO on the Summer Climate Change in China and its Mechanism. Adv Atmos Sci (1989) 6:21–32. doi:10.1007/BF02656915
12. Zhang R, Sumi A, Kimoto M. Impact of El Niño on the East Asian Monsoon. J Meteorol Soc Jpn (1996) 74(1):49–62. doi:10.2151/jmsj1965.74.1_49
13. Wang B, Wu R, Fu X. Pacific-east Asian Teleconnection: How Does ENSO Affect East Asian Climate? J Clim (2000) 13(9):1517–36. doi:10.1175/1520-0442(2000)013<1517:peathd>2.0.co;2
14. Yang J, Liu Q, Xie S-P, Liu Z, Wu L. Impact of the Indian Ocean SST basin Mode on the Asian Summer Monsoon. Geophys Res Lett (2007) 34(2):L02708. doi:10.1029/2006GL028571
15. Xie S-P, Hu K, Hafner J, Tokinaga H, Du Y, Huang G, et al. Indian Ocean Capacitor Effect on Indo-Western Pacific Climate during the Summer Following El Niño. J Clim (2009) 22(3):730–47. doi:10.1175/2008JCLI2544.1
16. Liu H, Hu S, Xu M, Chou J. Three-dimensional Decomposition Method of Global Atmospheric Circulation. Sci China Ser D-earth Sci (2008) 51:386–402. doi:10.1007/s11430-008-0020-9
17. Hu S, Cheng J, Chou J. Novel Three-Pattern Decomposition of Global Atmospheric Circulation: Generalization of Traditional Two-Dimensional Decomposition. Clim Dyn (2017) 49:3573–86. doi:10.1007/s00382-017-3530-3
18. Hu S, Chou J, Cheng J. Three-pattern Decomposition of Global Atmospheric Circulation: Part I-Decomposition Model and Theorems. Clim Dyn (2018) 50:2355–68. doi:10.1007/s00382-015-2818-4
19. Hu S, Cheng J, Xu M, Chou J. Three-pattern Decomposition of Global Atmospheric Circulation: Part II-Dynamical Equations of Horizontal, Meridional and Zonal Circulations. Clim Dyn (2018) 50:2673–86. doi:10.1007/s00382-017-3763-1
20. Hu S, Zhou B, Gao C, Xu Z, Wang Q, Chou J. Theory of Three-Pattern Decomposition of Global Atmospheric Circulation. Sci China Earth Sci (2020) 63:1248–67. doi:10.1007/s11430-019-9614-y
21. Cheng J, Gao C, Hu S, Feng G. High-stability Algorithm for the Three-Pattern Decomposition of Global Atmospheric Circulation. Theor Appl Climatol (2018) 133:851–66. doi:10.1007/s00704-017-2226-2
22. Saha S, Moorthi S, Pan H-L, Wu X, Wang J, Nadiga S, et al. The NCEP Climate Forecast System Reanalysis. Bull Amer Meteorol Soc. (2010) 91(8):1015–58. doi:10.1175/2010BAMS3001.1
23. Saha S, Moorthi S, Wu X, Wang J, Nadiga S, Tripp P, et al. The NCEP Climate Forecast System Version 2. J Clim (2014) 27(6):2185–208. doi:10.1175/JCLI-D-12-00823.1
25. Kobayashi S, Ota Y, Harada Y, Ebita A, Moriya M, Onoda H, et al. The JRA-55 Reanalysis: General Specifications and Basic Characteristics. J Meteorol Soc Jpn (2015) 93:5–48. doi:10.2151/jmsj.2015-001
26. Kalnay E, Kanamitsu M, Kistler R, Collins W, Deaven D, Gandin L, et al. The NCEP/NCAR 40-Year Reanalysis Project. Bull Amer Meteorol Soc. (1996) 77(3):437–71. doi:10.1175/1520-0477(1996)077<0437:tnyrp>2.0.co;2
27. Kanamitsu M, Ebisuzaki W, Woollen J, Yang S-K, Hnilo JJ, Fiorino M, et al. NCEP-DOE AMIP-II Reanalysis (R-2). Bull Amer Meteorol Soc. (2002) 83(11):1631–44. doi:10.1175/BAMS-83-11-1631
28. Xie P, Chen M, Yang S, Yatagai A, Hayasaka T, Fukushima Y, et al. A Gauge-Based Analysis of Daily Precipitation over East Asia. J Hydrometeorol (2007) 8(3):607–26. doi:10.1175/JHM583.1
29. Adler RF, Huffman GJ, Chang A, Ferraro R, Xie P-P, Janowiak J, et al. The Version-2 Global Precipitation Climatology Project (GPCP) Monthly Precipitation Analysis (1979-Present). J Hydrometeor (2003) 4(6):1147–67. doi:10.1175/1525-7541(2003)004<1147:tvgpcp>2.0.co;2
30. Huang B, Thorne PW, Banzon VF, Boyer T, Chepurin G, Lawrimore JH, et al. Extended Reconstructed Sea Surface Temperature, Version 5 (ERSSTv5): Upgrades, Validations, and Intercomparisons. J Clim (2017) 30(20):8179–205. doi:10.1175/JCLI-D-16-0836.1
31. Schwendike J, Govekar P, Reeder MJ, Wardle R, Berry GJ, Jakob C. Local Partitioning of the Overturning Circulation in the Tropics and the Connection to the Hadley and Walker Circulations. J Geophys Res Atmos (2014) 119(3):1322–39. doi:10.1002/2013JD020742
32. Schwendike J, Berry GJ, Reeder MJ, Jakob C, Govekar P, Wardle R. Trends in the Local Hadley and Local Walker Circulations. J Geophys Res Atmos (2015) 120(15):7599–618. doi:10.1002/2014JD022652
33. Xie S-P, Kosaka Y, Du Y, Hu K, Chowdary JS, Huang G. Indo-western Pacific Ocean Capacitor and Coherent Climate Anomalies in post-ENSO Summer: A Review. Adv Atmos Sci (2016) 33(4):411–32. doi:10.1007/s00376-015-5192-6
34. Kosaka Y, Xie S-P, Nakamura H. Dynamics of Interannual Variability in Summer Precipitation over East Asia*. J Clim (2011) 24:5435–53. doi:10.1175/2011JCLI4099.1
35. Chen S, Wei K, Chen W, Song L. Regional Changes in the Annual Mean Hadley Circulation in Recent Decades. J Geophys Res Atmos (2014) 119:7815–32. doi:10.1002/2014JD021540
Keywords: anomalous subsidence, western pacific subtropical high, meridional circulation, meiyu rain, early summer 2020
Citation: Zhao Y, Cheng J, Feng G, Zheng Z, Zhi R, Zhang Z, Yan J and Zuo D (2022) Dominant Role of Meridional Circulation in Regulating the Anomalous Subsidence of the Western Pacific Subtropical High in Early Summer 2020. Front. Phys. 10:713087. doi: 10.3389/fphy.2022.713087
Received: 21 May 2021; Accepted: 17 January 2022;
Published: 04 February 2022.
Edited by:
Eric Josef Ribeiro Parteli, University of Duisburg-Essen, GermanyReviewed by:
Xiaolong Zheng, Chinese Academy of Sciences (CAS), ChinaCopyright © 2022 Zhao, Cheng, Feng, Zheng, Zhi, Zhang, Yan and Zuo. This is an open-access article distributed under the terms of the Creative Commons Attribution License (CC BY). The use, distribution or reproduction in other forums is permitted, provided the original author(s) and the copyright owner(s) are credited and that the original publication in this journal is cited, in accordance with accepted academic practice. No use, distribution or reproduction is permitted which does not comply with these terms.
*Correspondence: Jianbo Cheng, Y2hlbmdqYjE5OTJAMTYzLmNvbQ==; Guolin Feng, RmVuZ2dsQGNtYS5nb3YuY24=
Disclaimer: All claims expressed in this article are solely those of the authors and do not necessarily represent those of their affiliated organizations, or those of the publisher, the editors and the reviewers. Any product that may be evaluated in this article or claim that may be made by its manufacturer is not guaranteed or endorsed by the publisher.
Research integrity at Frontiers
Learn more about the work of our research integrity team to safeguard the quality of each article we publish.